
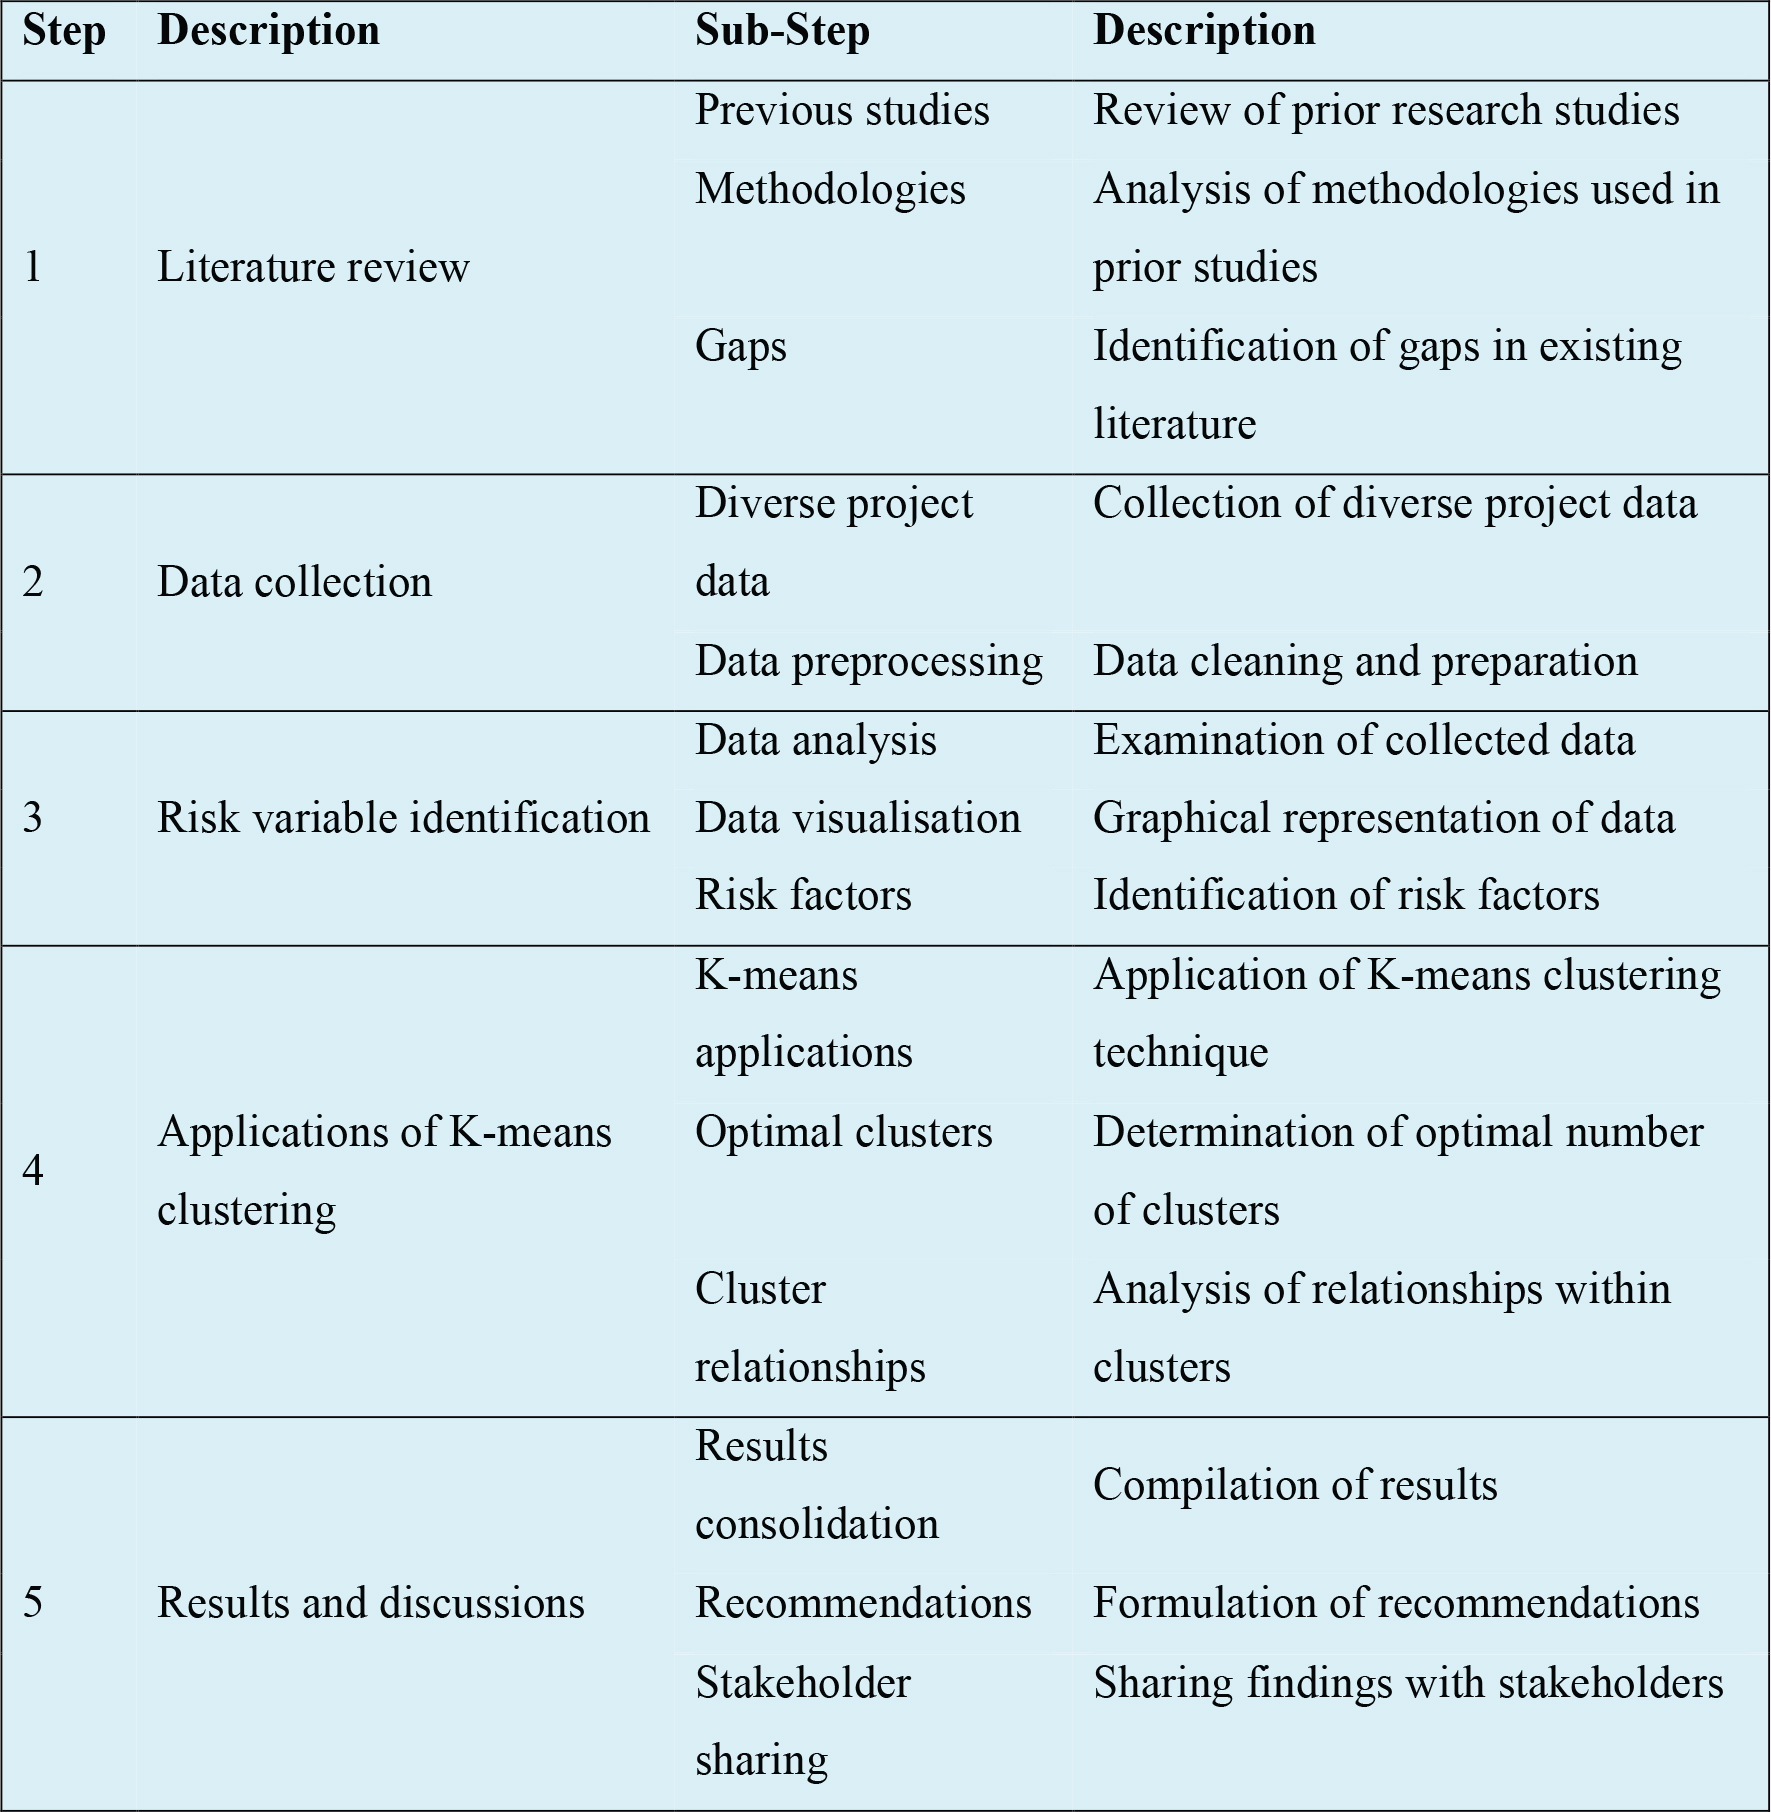
Fig. 1:
General research methodology adopted in this study.
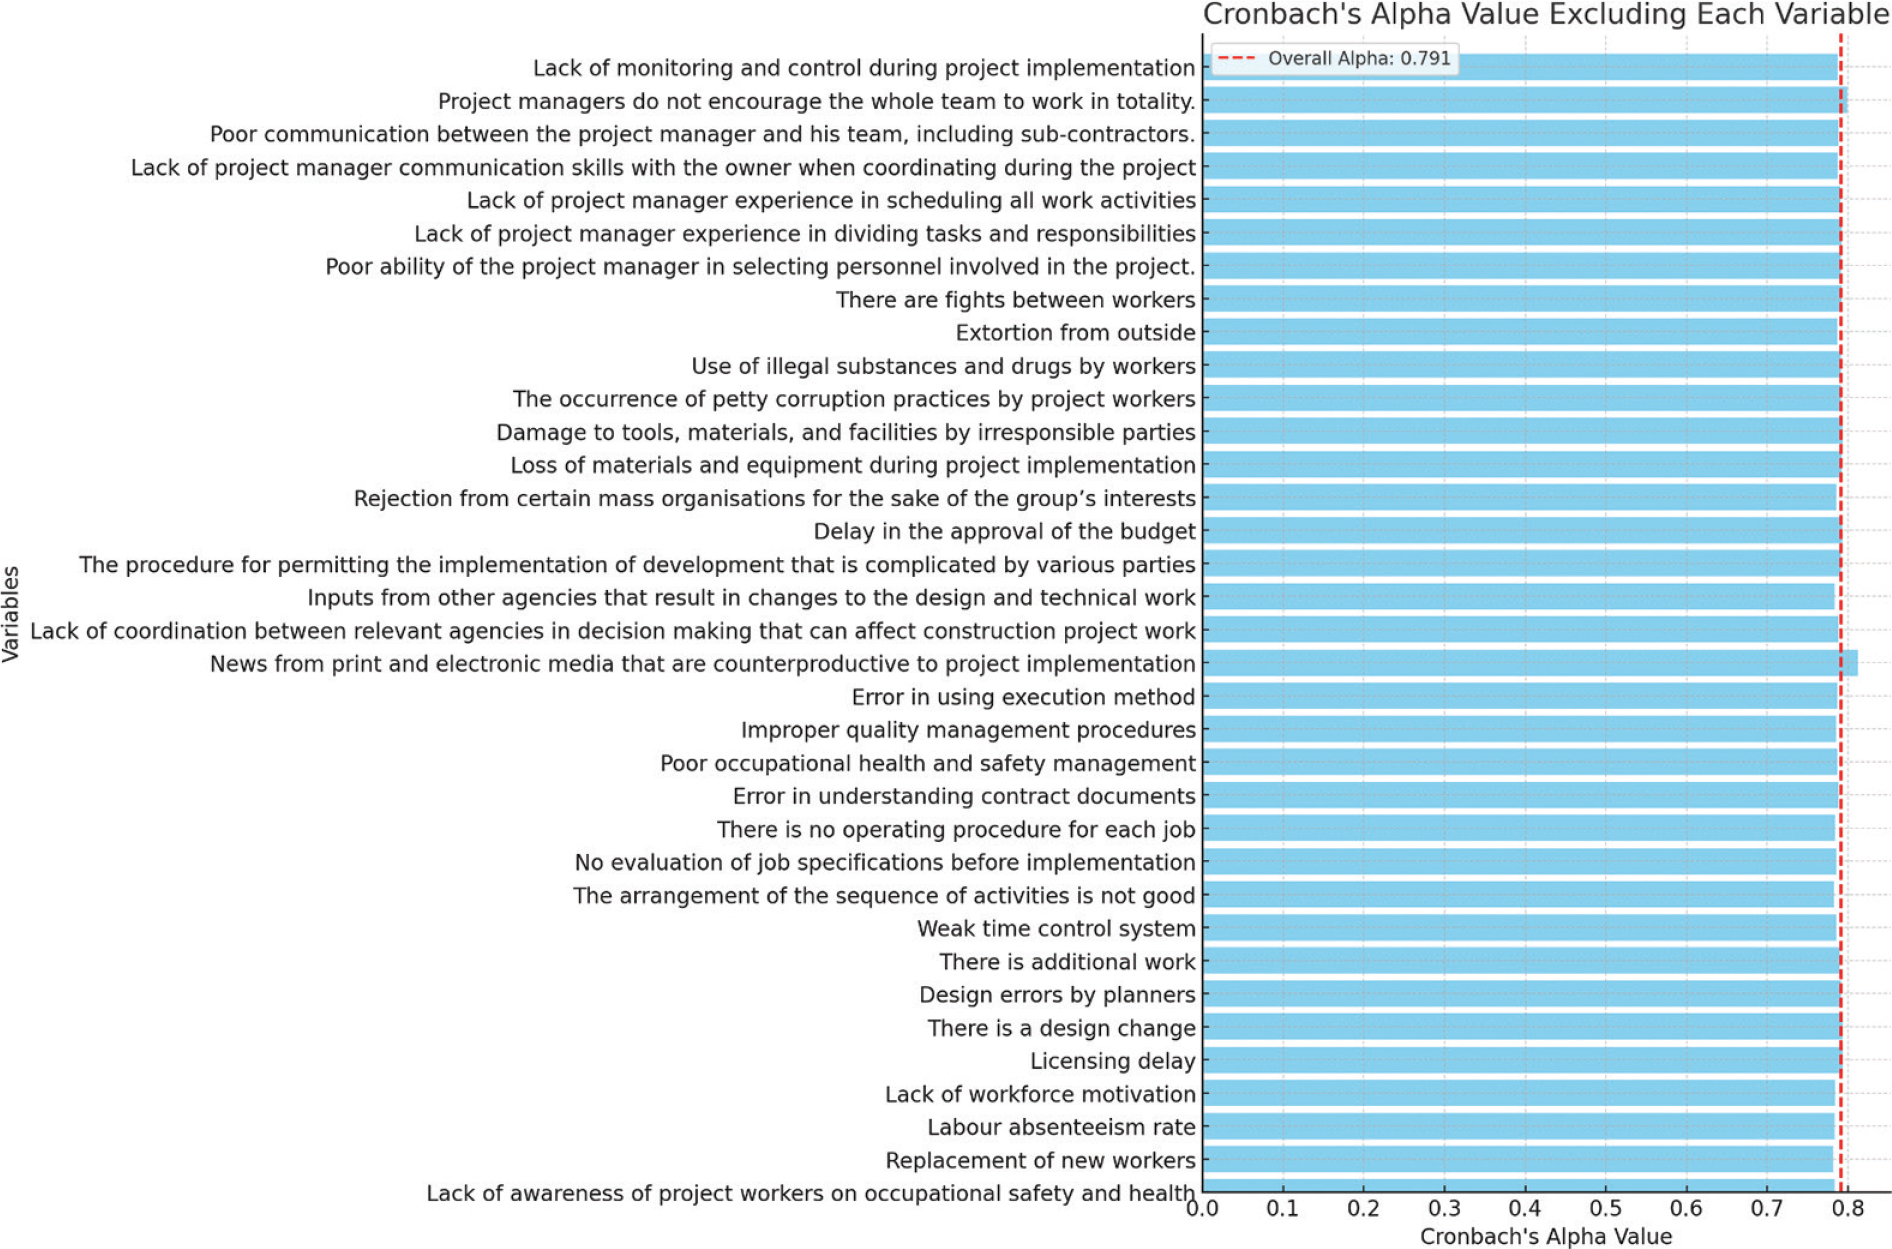
Fig. 2:
Reliability assessment using Cronbach’s Alpha.
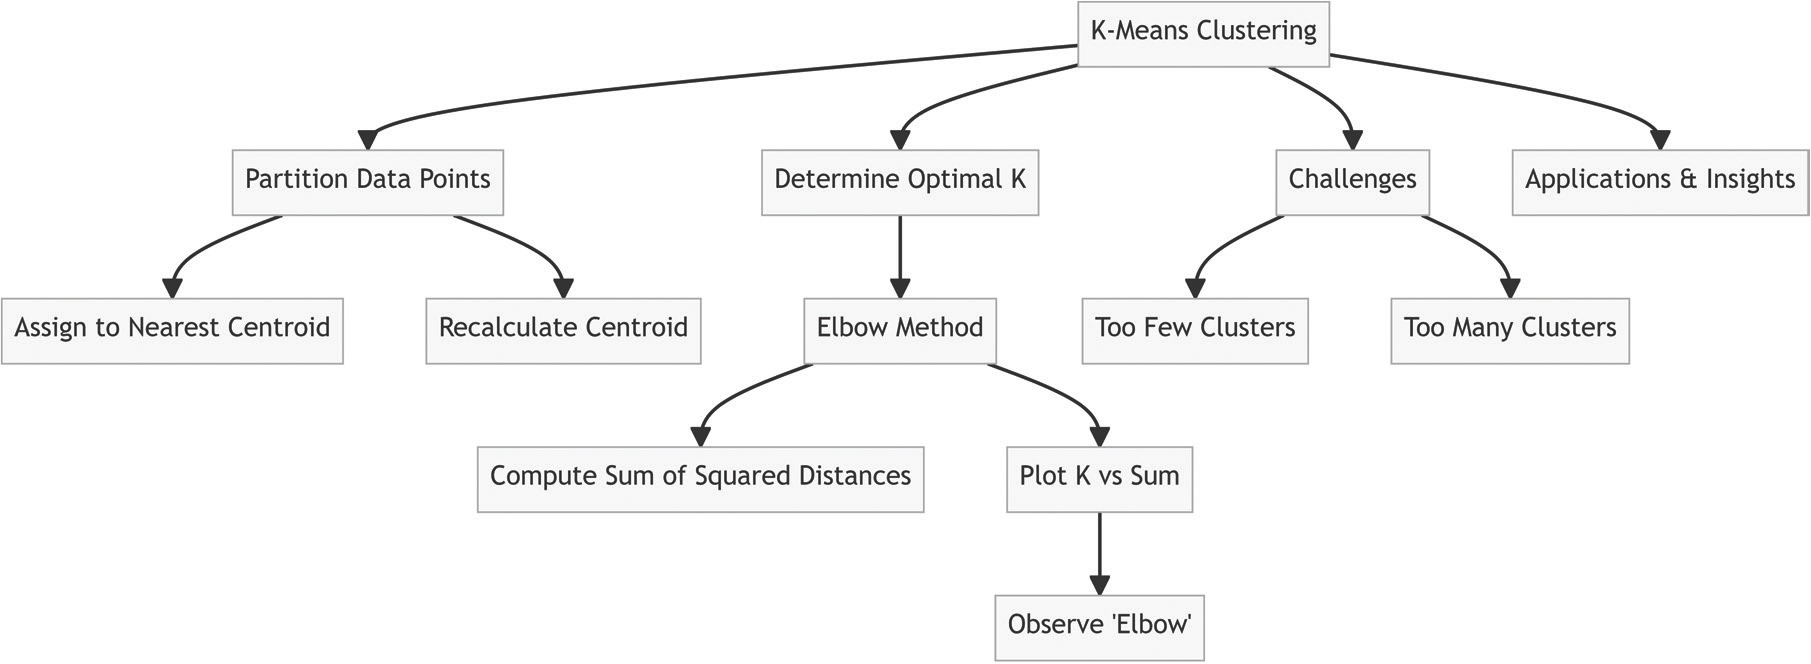
Fig. 3:
General overview of the K-means clustering approach.
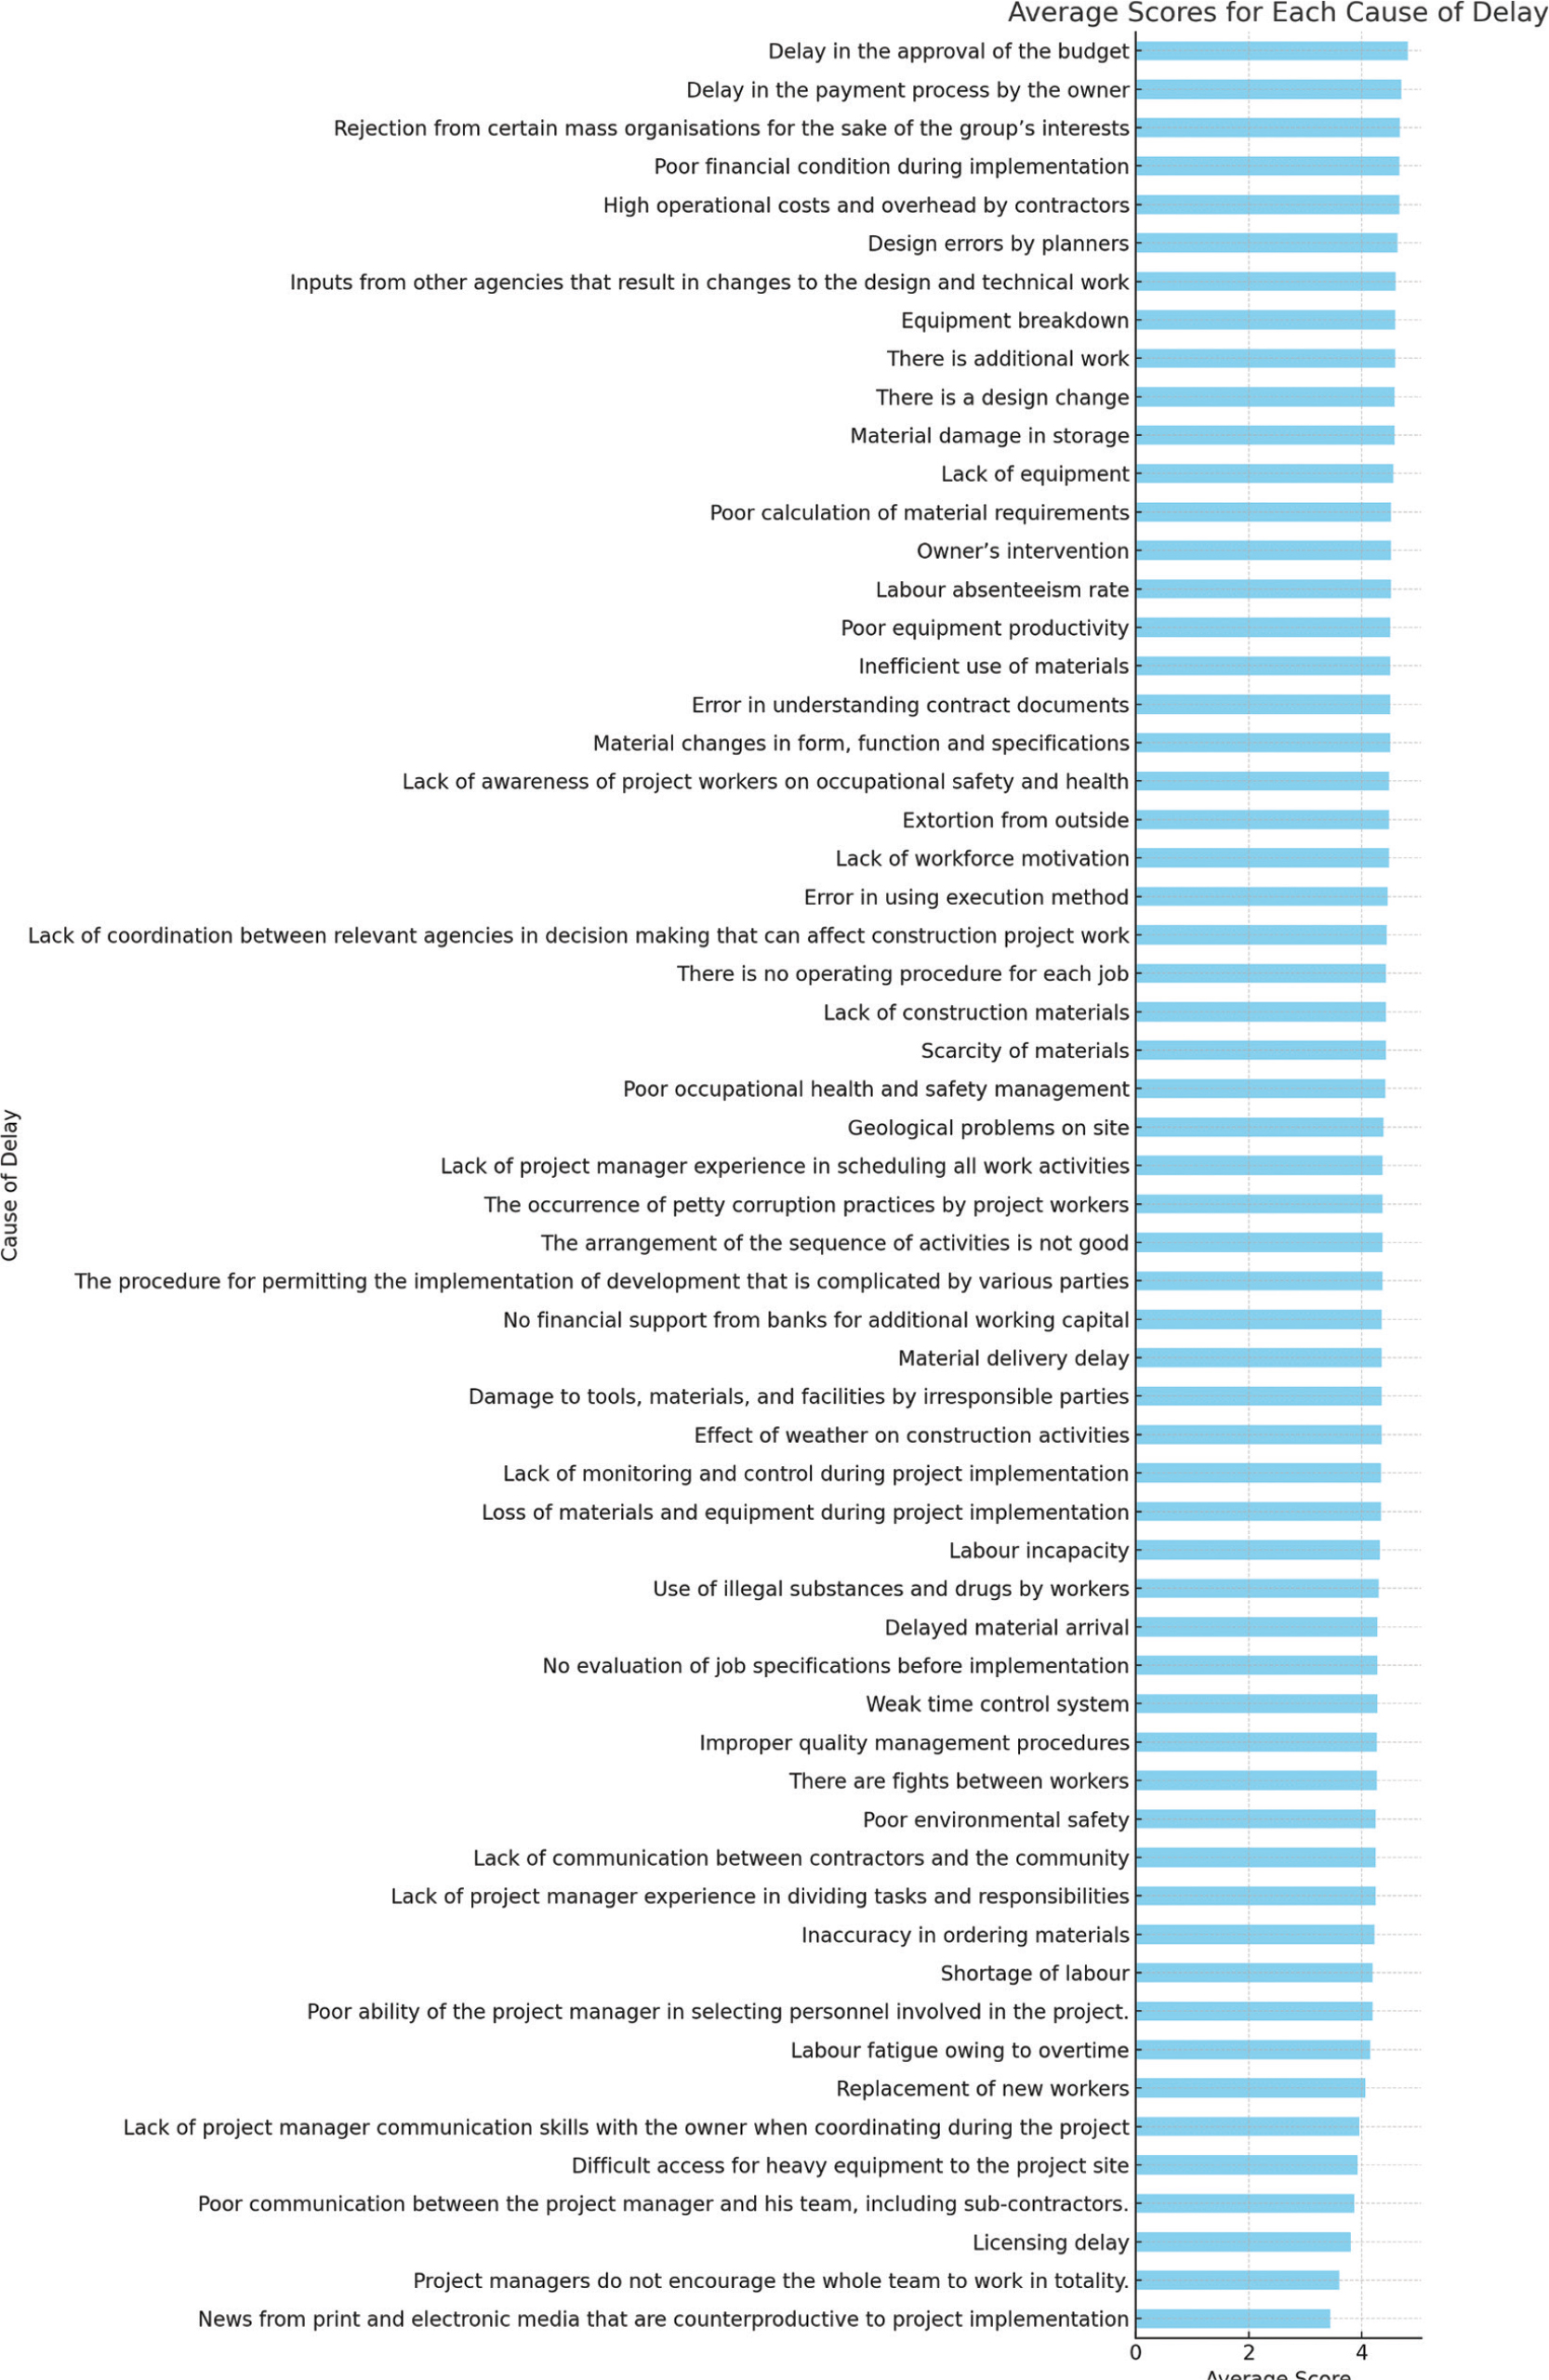
Fig. 4:
Average scores of the effects of each risk variable on the delay of construction projects.
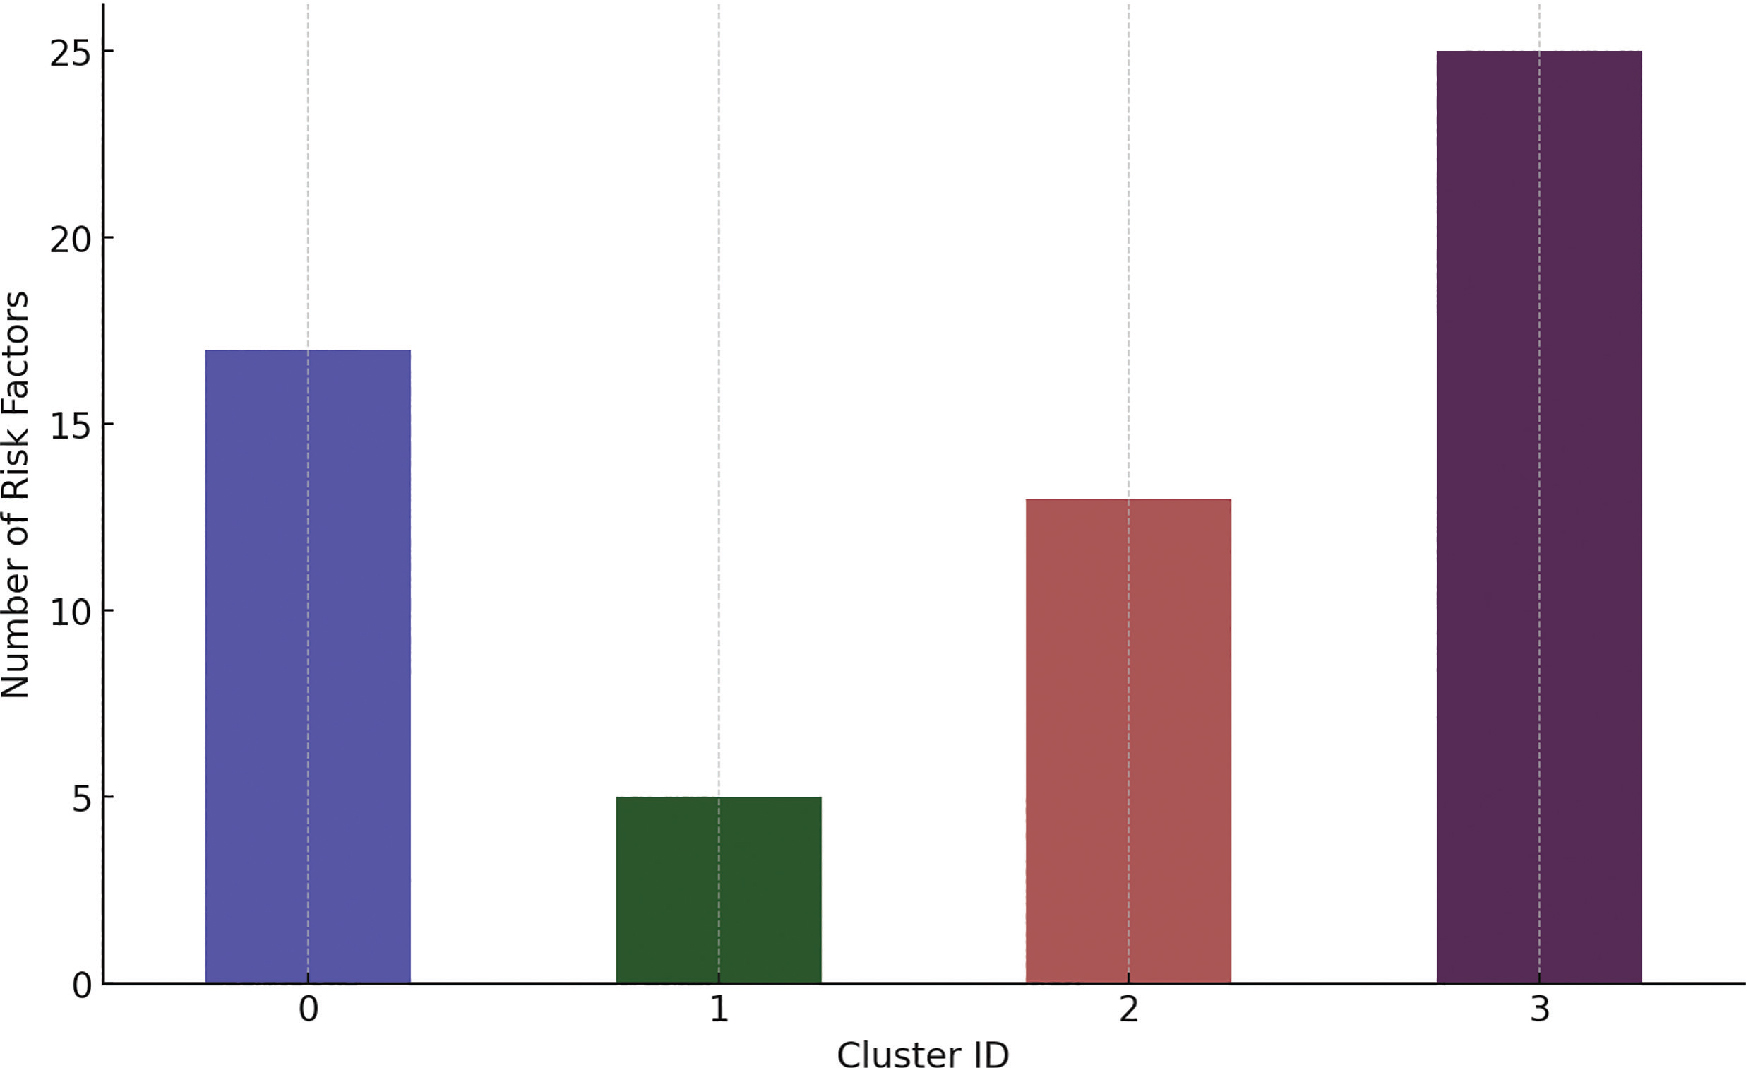
Fig. 5:
Number of risk factors associated with each cluster.
Tab. 1.
Risk factor categorisation using K-means clustering
| Risk Factor Dominant | Cluster ID | Risk Factor Dominant | Cluster ID |
|---|---|---|---|
| Lack of construction materials | 3 | There is a design change | 0 |
| Material changes in form, function and specifications | 3 | Design errors by planners | 0 |
| Material delivery delay | 2 | There is additional work | 0 |
| Material damage in storage | 3 | Weak time control system | 3 |
| Scarcity of materials | 3 | The arrangement of the sequence of activities is not good | 3 |
| Inaccuracy in ordering materials | 2 | No evaluation of job specifications before implementation | 3 |
| Inefficient use of materials | 3 | There is no operating procedure for each job | 3 |
| Delayed material arrival | 2 | Error in understanding contract documents | 3 |
| Poor calculation of material requirements | 3 | Poor occupational health and safety management | 3 |
| Equipment breakdown | 3 | Improper quality management procedures | 3 |
| Lack of equipment | 3 | Error in using execution method | 3 |
| Poor equipment productivity | 3 | News from print and electronic media that are counterproductive to project implementation | 1 |
| Poor financial condition during implementation | 0 | Lack of coordination between relevant agencies in decision making that can affect construction project work | 3 |
| Delay in the payment process by the owner | 3 | Inputs from other agencies that result in changes to the design and technical work | 0 |
| No financial support from banks for additional working capital | 1 | The procedure for permitting the implementation of development that is complicated by various parties | 3 |
| High operational costs and overhead by contractors | 0 | Delay in the approval of the budget | 1 |
| Effect of weather on construction activities | 3 | Rejection from certain mass organisations for the sake of the group’s interests | 0 |
| Poor environmental safety | 3 | Loss of materials and equipment during project implementation | 0 |
| Geological problems on site | 3 | Damage to tools, materials, and facilities by irresponsible parties | 0 |
| Lack of communication between contractors and the community | 3 | The occurrence of petty corruption practices by project workers | 0 |
| Difficult access for heavy equipment to the project site | 3 | Use of illegal substances and drugs by workers | 0 |
| Shortage of labour | 2 | Extortion from outside | 0 |
| Labour incapacity | 2 | There are fights between workers | 0 |
| Owner’s intervention | 2 | Poor ability of the project manager in selecting personnel involved in the project. | 0 |
| Labour fatigue owing to overtime | 2 | Lack of project manager experience in dividing tasks and responsibilities | 0 |
| Lack of awareness of project workers on occupational safety and health | 2 | Lack of project manager experience in scheduling all work activities | 0 |
| Replacement of new workers | 2 | Lack of project manager communication skills with the owner when coordinating during the project | 1 |
| Labour absenteeism rate | 2 | Poor communication between the project manager and his team, including sub-contractors. | 2 |
| Lack of workforce motivation | 2 | Project managers do not encourage the whole team to work in totality. | 1 |
| Licensing delay | 2 | Lack of monitoring and control during project implementation | 0 |
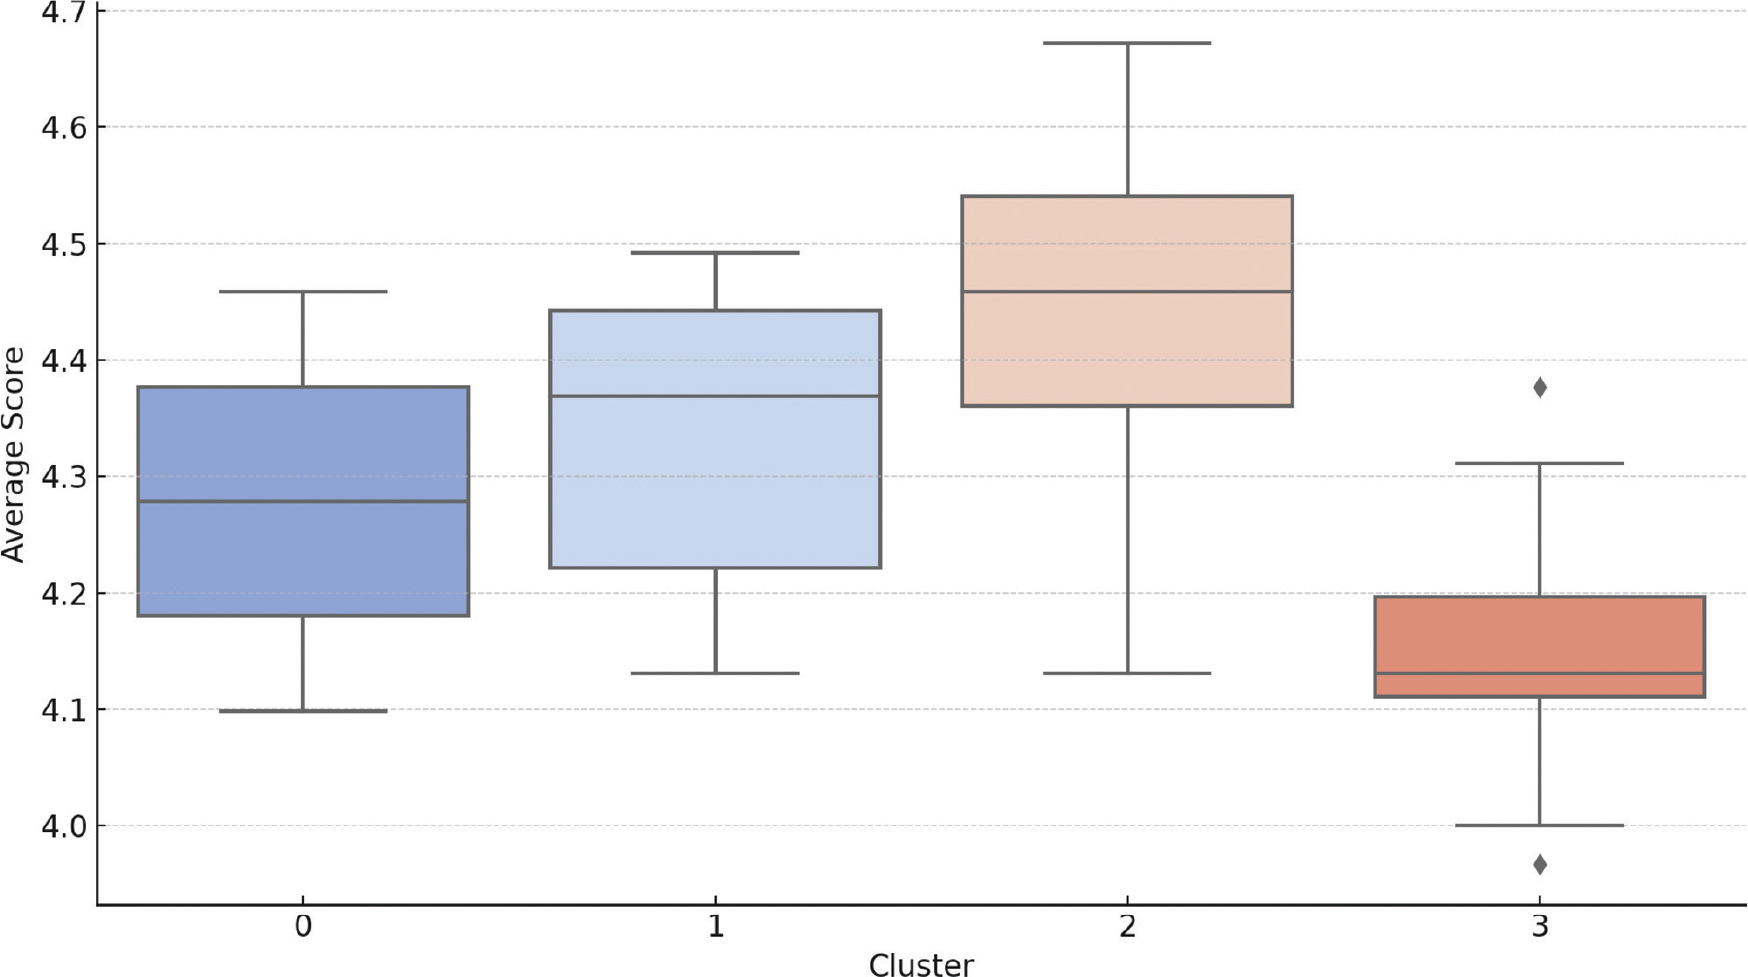
Fig. 6:
Distribution of average scores in each cluster.
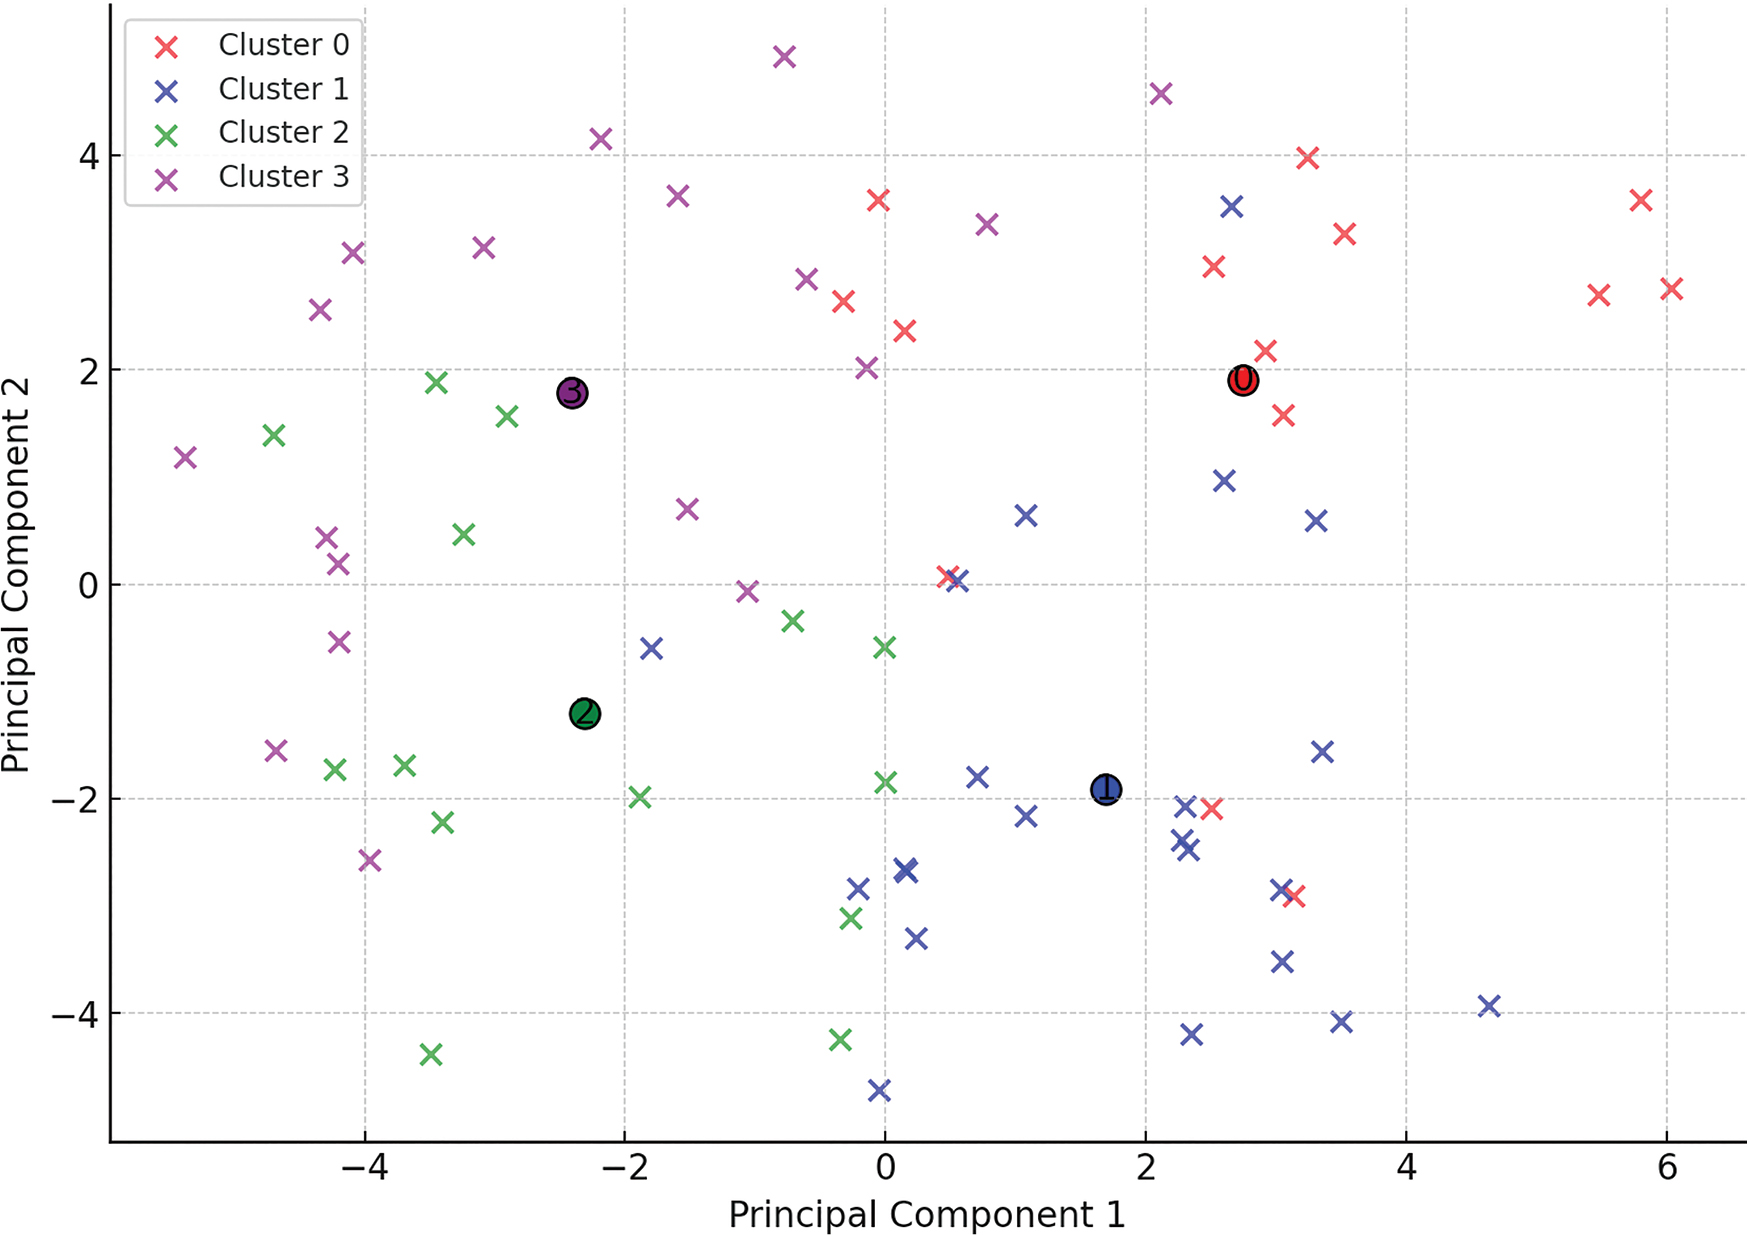
Fig. 7:
PCA analysis based on the K-means clustering results. PCA, principal component analysis.
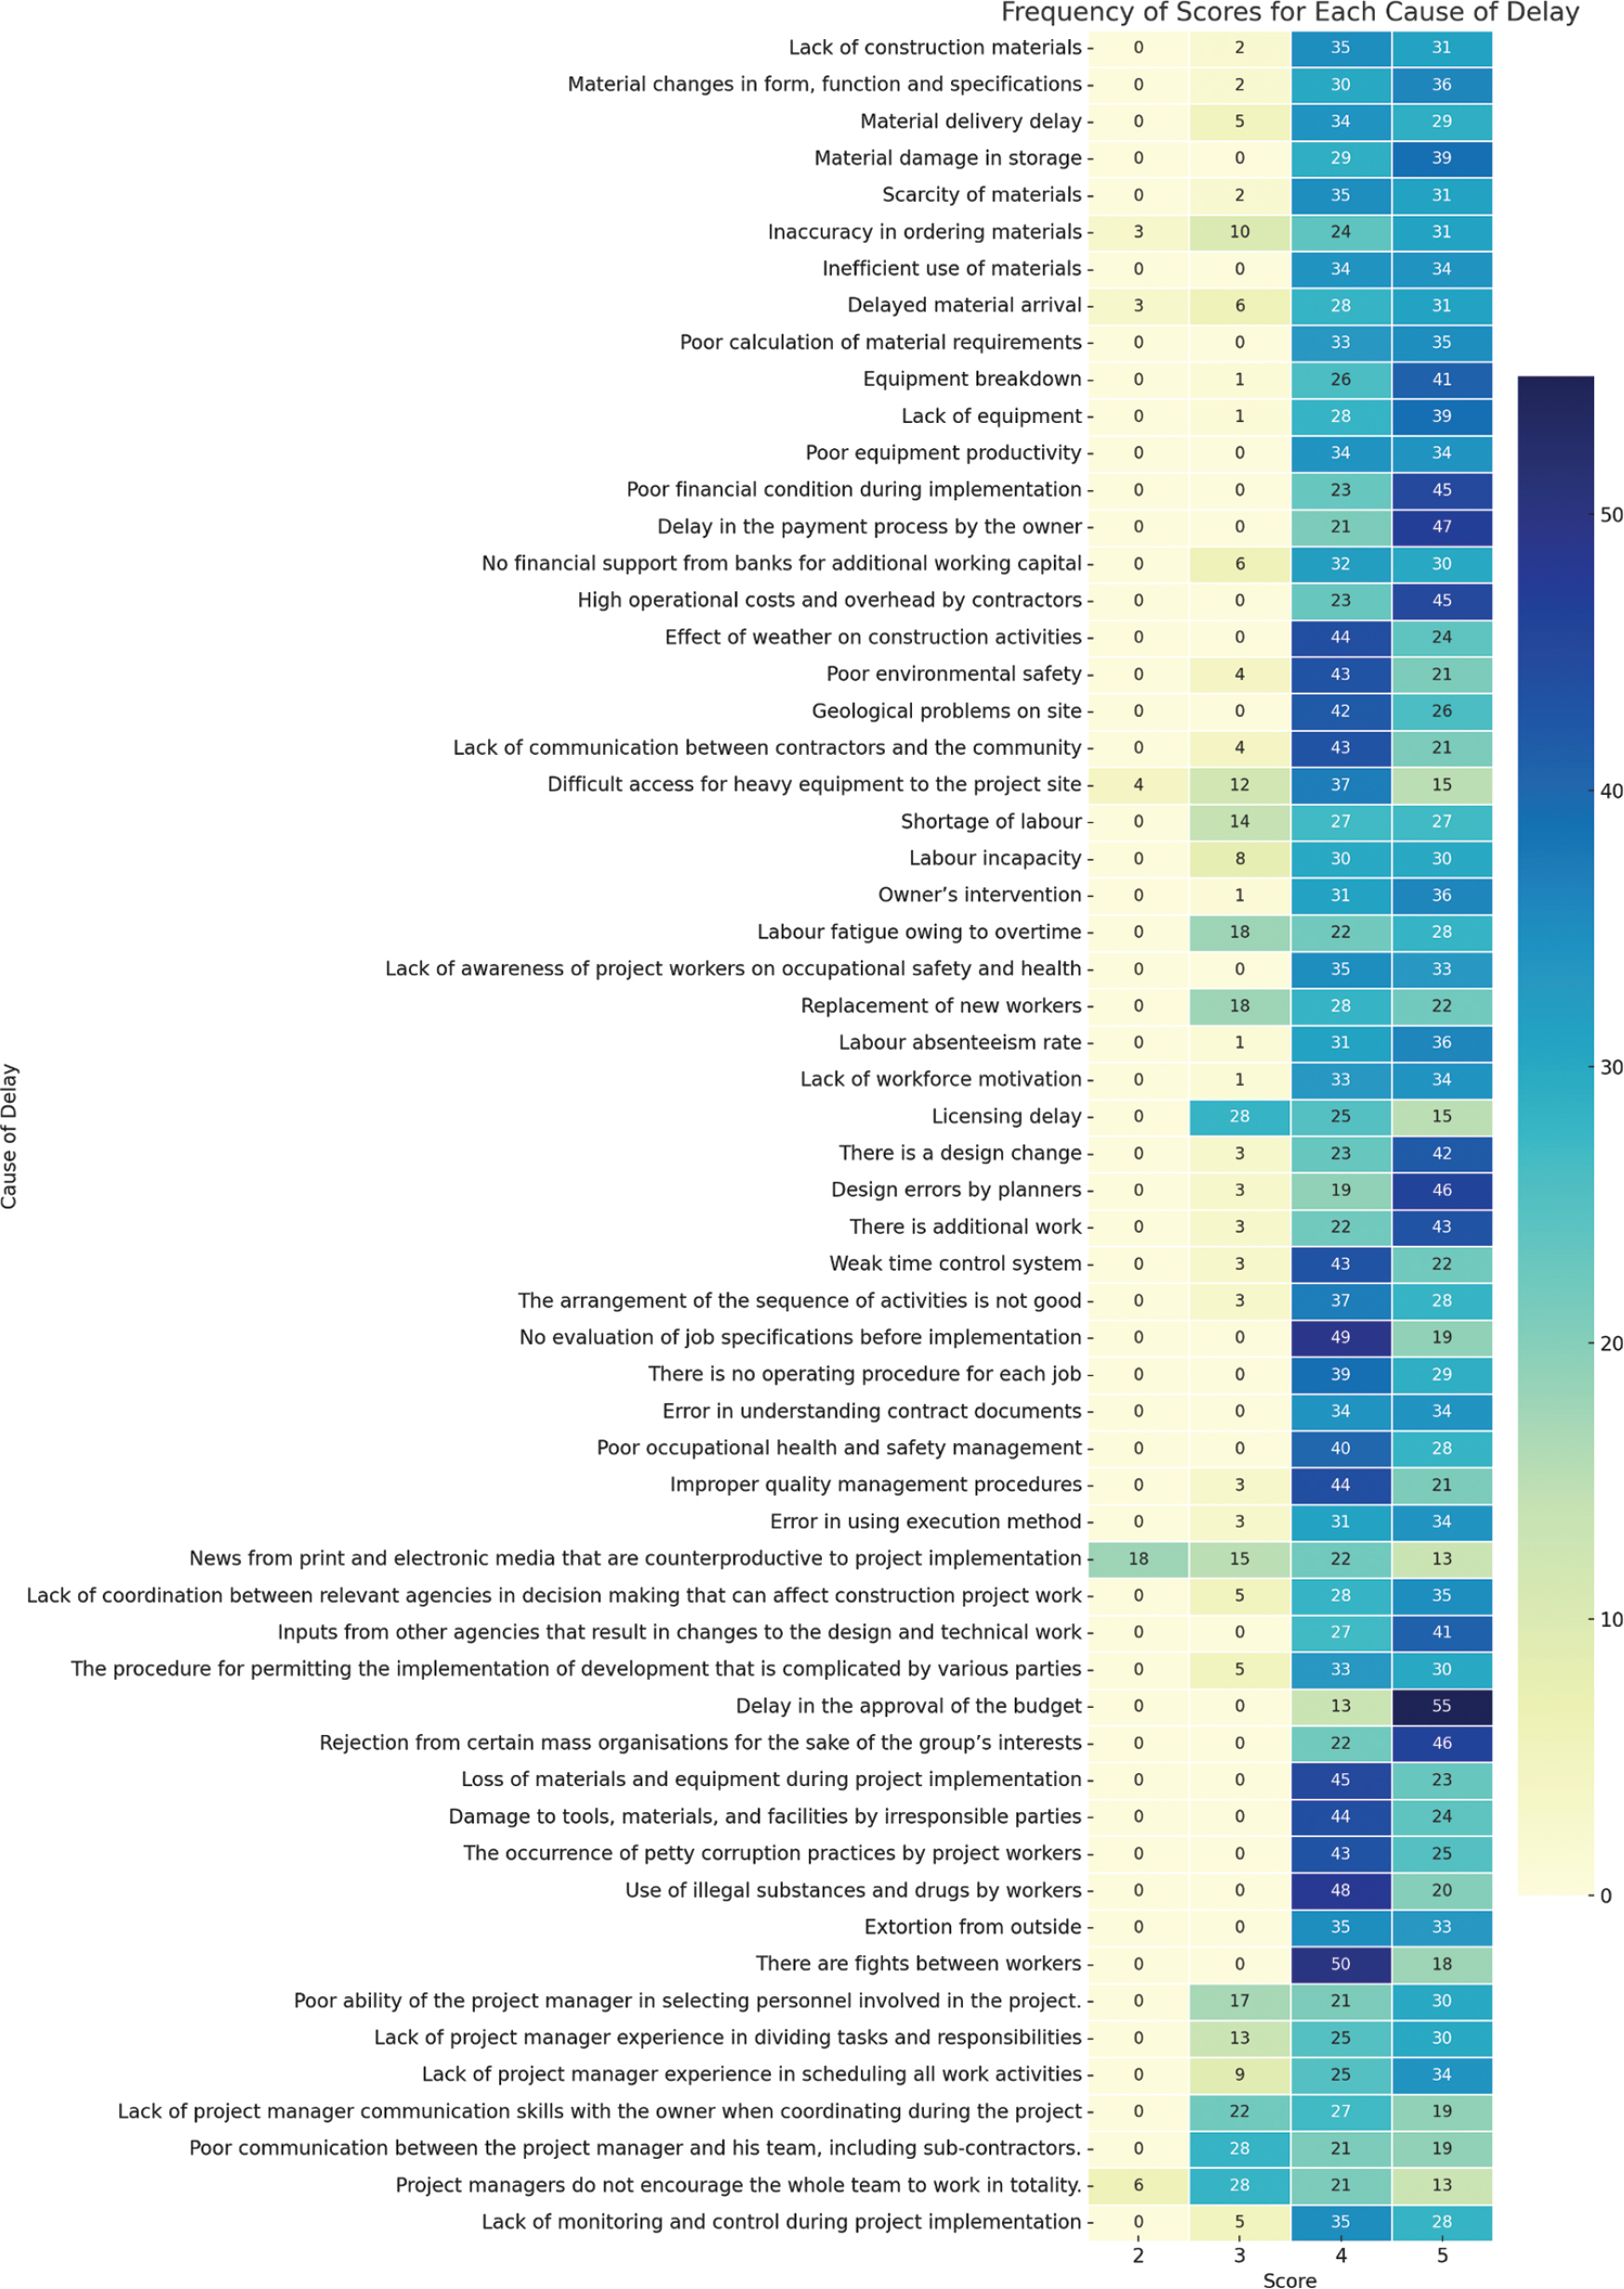
Fig. A1:
A statistical representation of the risk factors on the construction delays of projects.
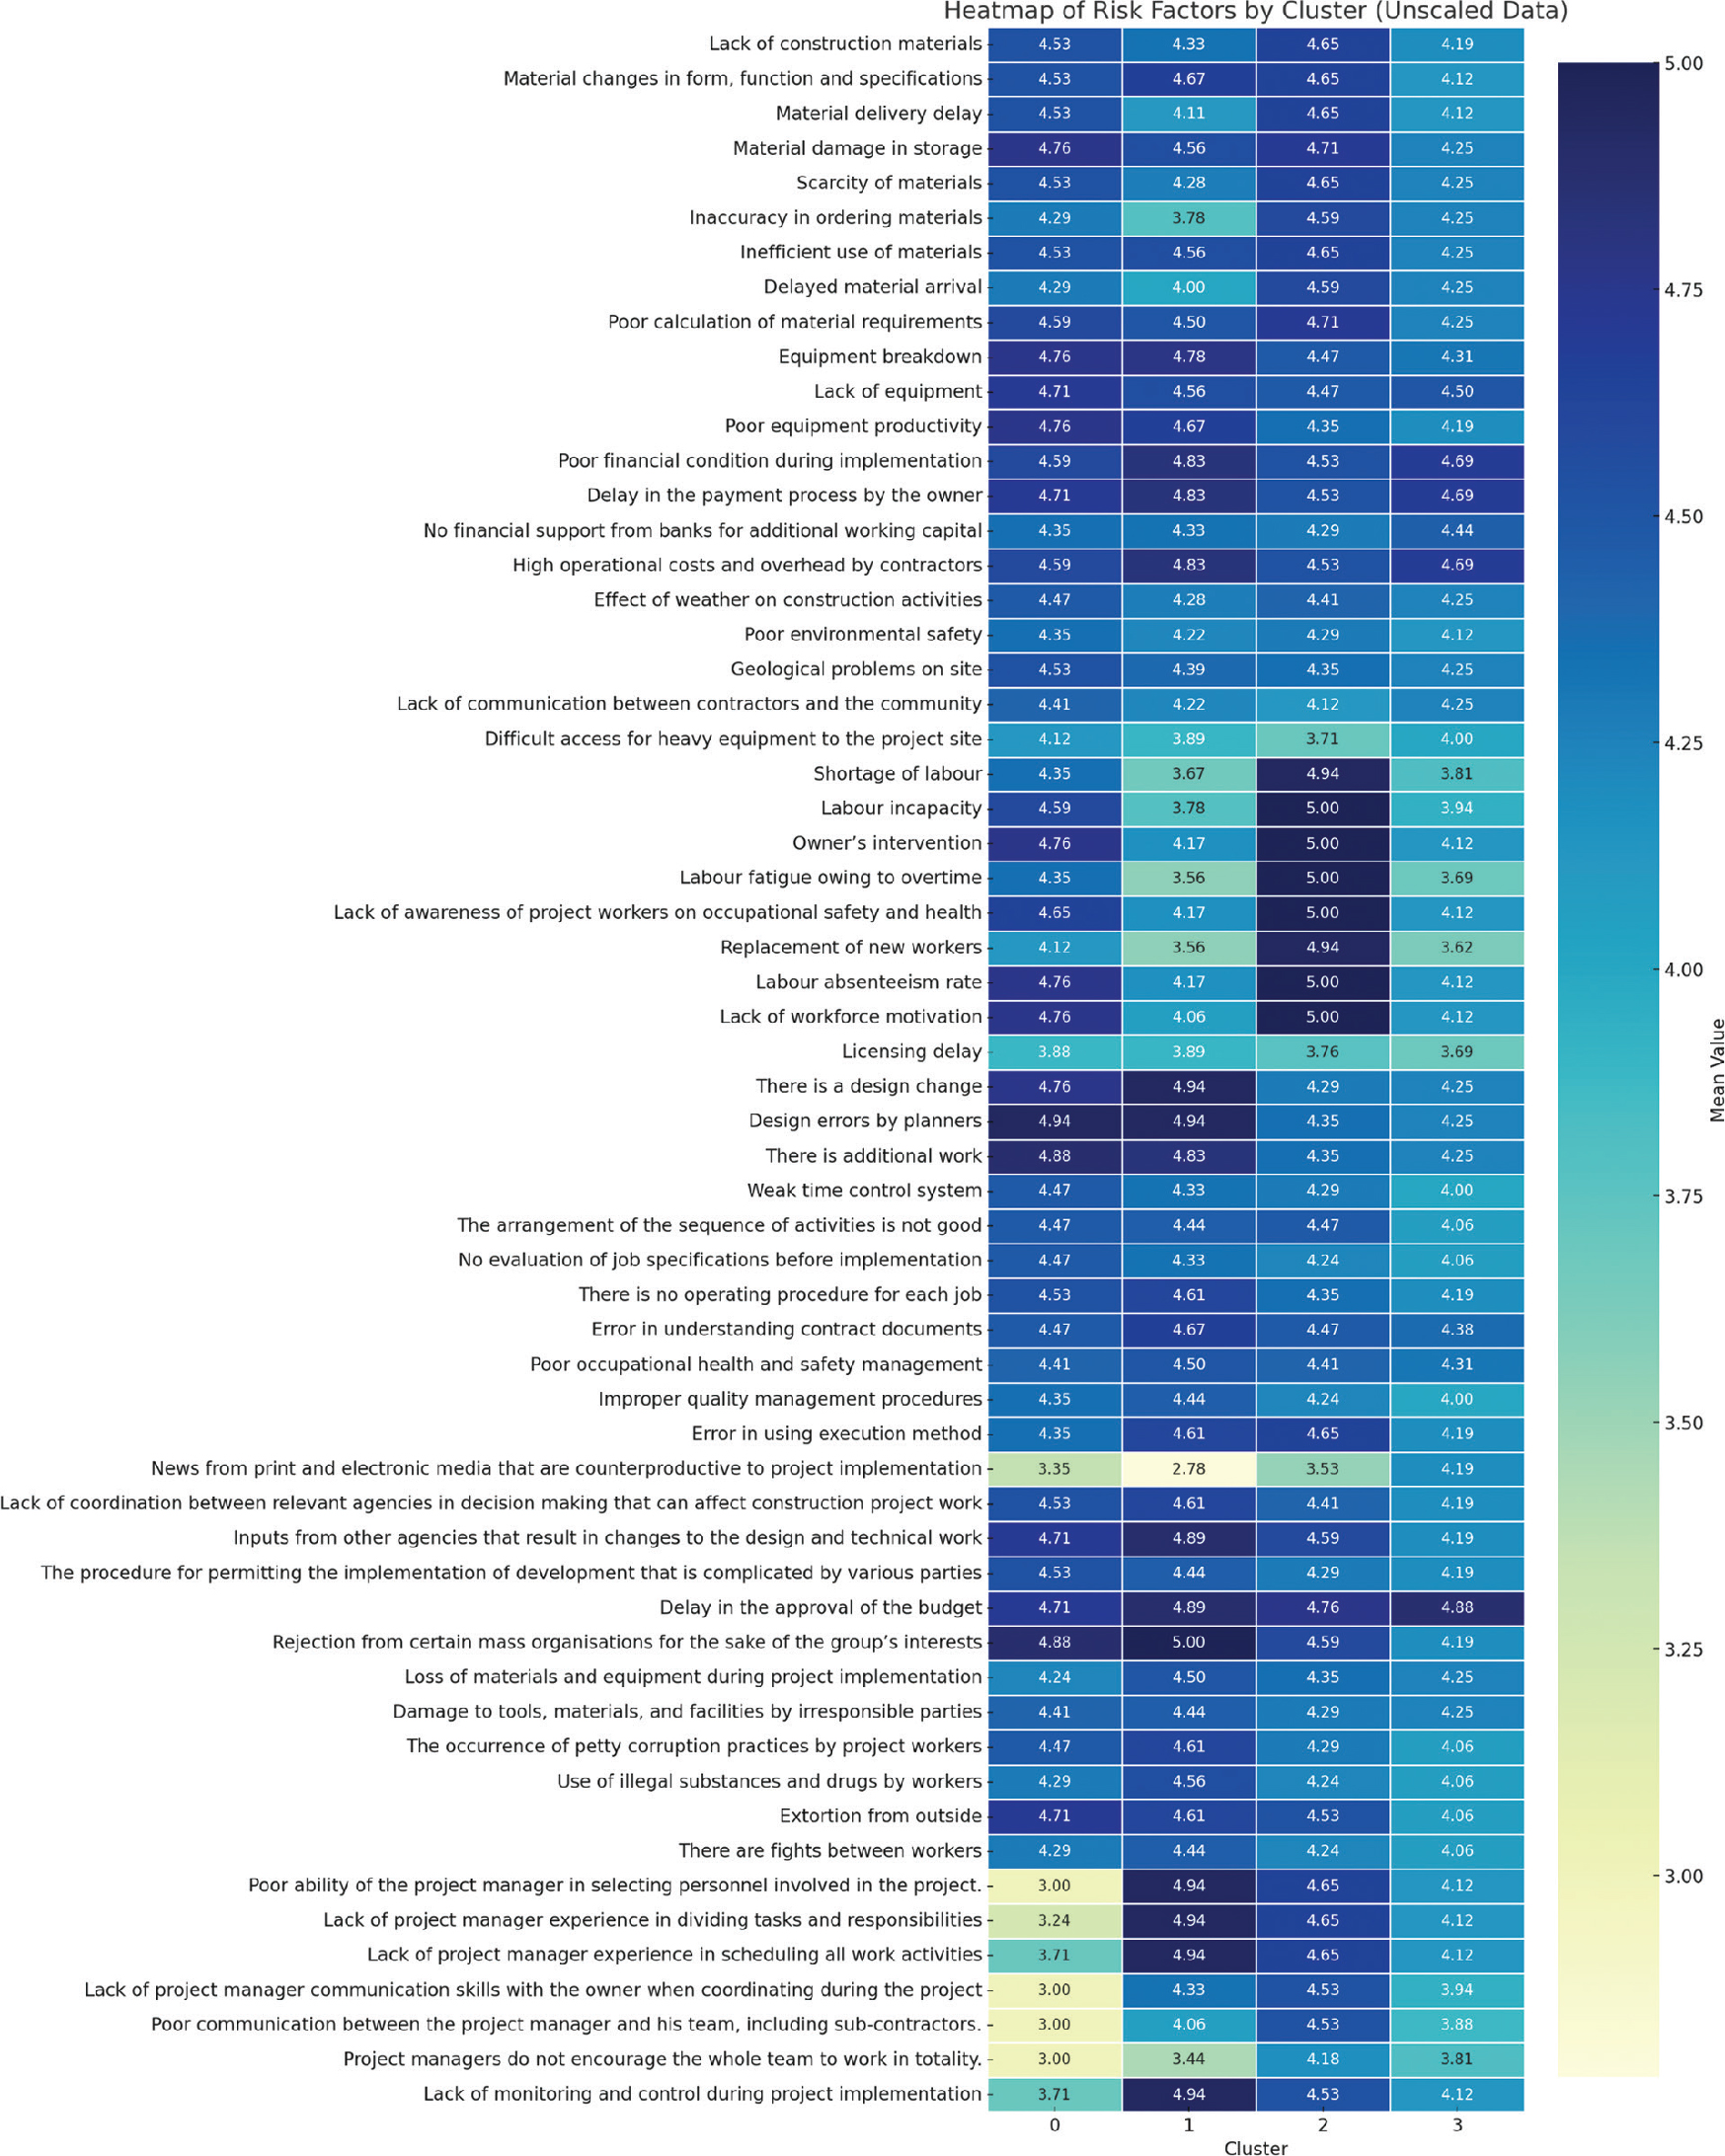
Fig. A2:
Heatmap of the interaction between risk factors and cluster.