
Fig. 1
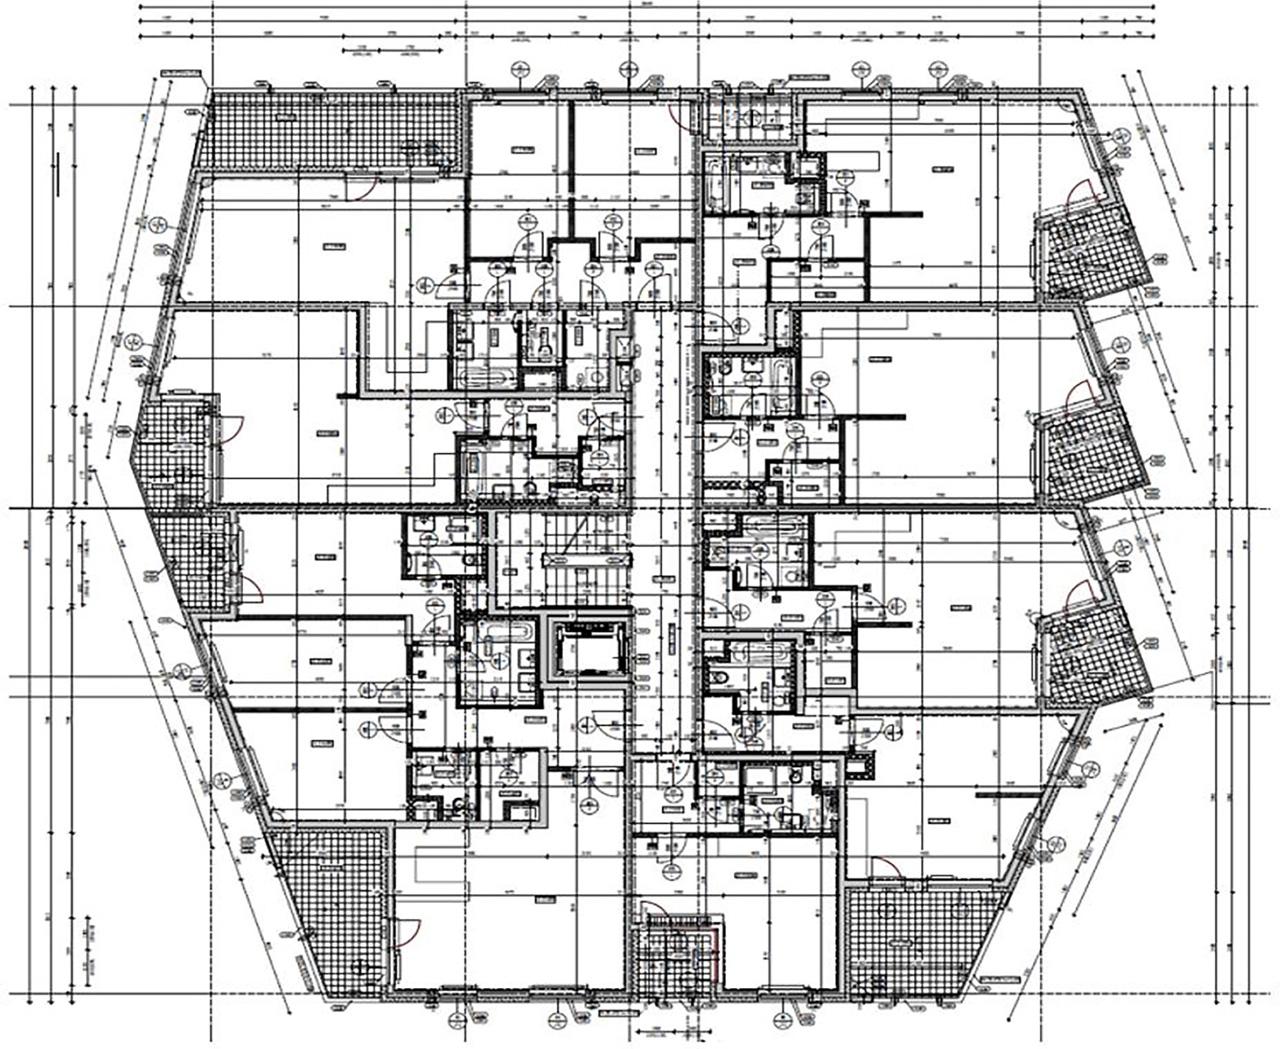
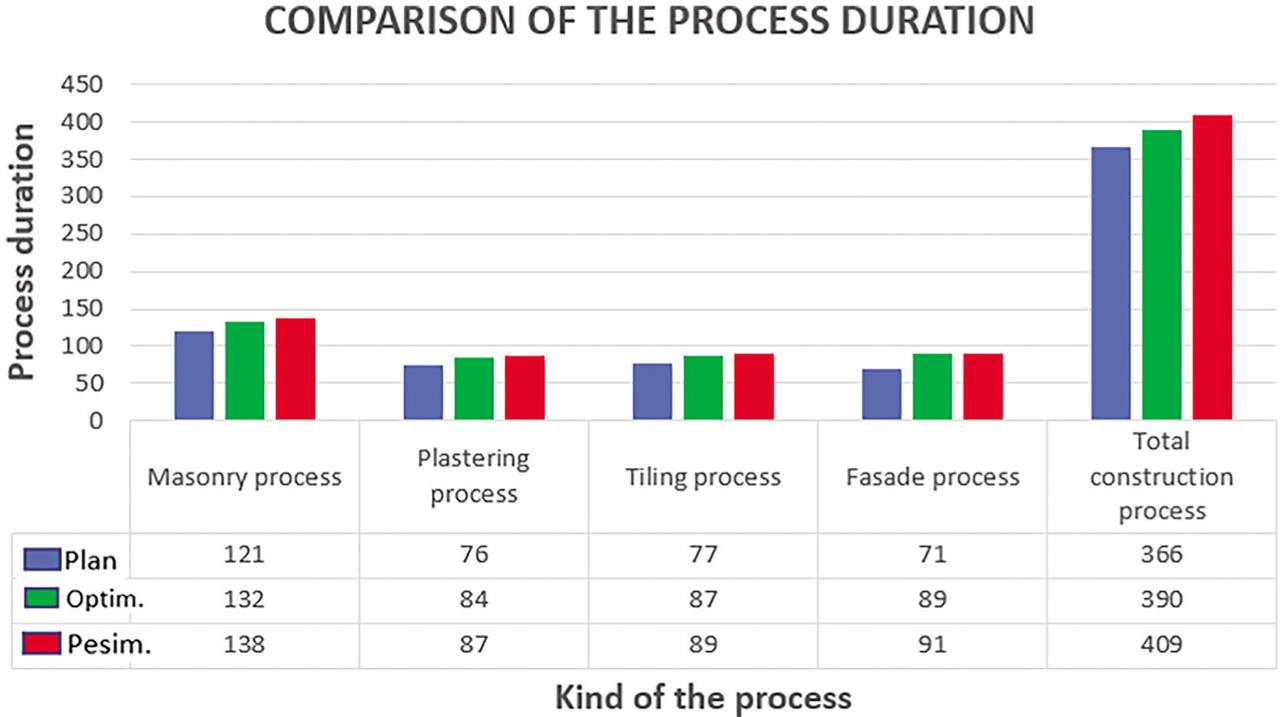
Fig. 2
Plastering works – Distribution of number of plasterers in work queue no_1
| Floor | No. of plasterers | Overall performance plan m2/sm | Overall performance plan m2/month |
|---|---|---|---|
| 1 | 8 | 87.6 | 1,752 |
| 2 | 8 | 87.6 | 1,752 |
| 3 | – | – | – |
| 4 | – | – | – |
| 5 | – | – | – |
| 6 | – | – | – |
| 7 | – | – | – |
| ς | 16 | 175.2 | 3,504 |
Plastering works SO J 34
| Worker no. | 1 | 2 | 3 | 4 | 5 | 6 | 7 | 8 | 9 | 10 | 11 | 12 | 13 | 14 | 15 | 16 |
| Performance/shift | 12 | 11 | 10 | 12 | 11 | 13 | 12 | 11 | 10 | 12 | 11 | 10 | 13 | 10 | 12 | 11 |
| Worker no. | 17 | 18 | 19 | 20 | 21 | 22 | 23 | 24 | 25 | 26 | 27 | 28 | 29 | 30 | 31 | 32 |
| Performance/shift | 12 | 11 | 11 | 12 | 11 | 13 | 12 | 11 | 12 | 12 | 11 | 12 | 13 | 12 | 10 | 12 |
Calculation of observed value XOBS – originally wrongly numbered 2
| Ordered | Series (i) | (í−1)/n | í/n | F(x) | D pro | D pro | D | ||
|---|---|---|---|---|---|---|---|---|---|
| Values x | i/n | (í−1)/n | |||||||
| 10 | 1 | 0 | 0.063 | 0.036 | 0.027 | 0.036 | 0.036 | ||
| 10 | 2 | 0.063 | 0.125 | 0.036 | 0.089 | −0.027 | 0.089 | ||
| 11 | 9 | 0.5 | 0.563 | 0.274 | 0.289 | −0.226 | 0.289 | ||
| 12 | 10 | 0.563 | 0.625 | 0.726 | −0.101 | 0.163 | 0.163 | ||
| 12 | 11 | 0.625 | 0.688 | 0.726 | −0.038 | 0.101 | 0.101 | ||
| 12 | 12 | 0.688 | 0.75 | 0.726 | 0.024 | 0.038 | 0.038 | ||
| 12 | 13 | 0.75 | 0.813 | 0.726 | 0.087 | −0.024 | 0.087 | ||
| 12 | 14 | 0.813 | 0.875 | 0.726 | 0.149 | −0.087 | 0.149 | ||
| 13 | 15 | 0.875 | 0.938 | 0.964 | −0.026 | 0.089 | 0.089 | ||
| 13 | 16 | 0.938 | 1 | 0.964 | 0.036 | 0.026 | 0.036 | ||