
1. INTRODUCTION
Sunflower is one of the leading oilseed crops of Ukraine, determining the country's export potential, the economic efficiency of agricultural production, and the stability of agri-food systems [Flagella et al. 2002; Sadras et al. 2015; Pichura et al. 2023]. Its yield level serves as an integral indicator of the effectiveness of agronomic technologies, the genetic potential of hybrids, and the environmental conditions of cultivation. The issue of increasing and stabilizing sunflower productivity is particularly relevant in the steppe zone of Ukraine, where agroecosystems operate under chronic moisture deficit [Dudiak et al. 2019, 2020, 2021; Pichura et al. 2022; Pichura, Potravka 2025], high temperature variability, and an increasing frequency of extreme weather events [Egerer et al. 2023]. The combined effect of these factors limits the realization of the genetic potential of hybrids and increases the risk of yield instability [Flagella et al. 2002].
In modern sunflower cultivation technologies, the application of multifunctional plant growth regulators plays an important role, as they are capable of modifying plant physiological and biochemical processes, enhancing resistance to abiotic stress, optimizing mineral nutrition, and intensifying photosynthetic activity [Breus et al. 2019, 2020; Domaratskiy 2021]. The use of such products is considered an effective tool for adapting agronomic technologies to climatic variability, particularly in regions of risky farming [Domaratskiy et al. 2022]. At the same time, hybrid responses to plant growth regulators are genotype-specific [Des Marais et al. 2013] and largely depend on the hydrothermal regime of the growing season, which necessitates an in-depth investigation of their production effect under contrasting weather conditions [Fu, Wang 2023].
Alongside improvements in agronomic approaches, methods of remote monitoring of agrocenoses are rapidly developing [Hasanli et al. 2026; Vesterdal et al. 2026]. Earth remote sensing systems provide the capability for operational assessment of crop condition, canopy photosynthetic activity, and the level of realization of crop production potential [Lunetta et al. 2010]. In vegetation spectral analysis, in addition to the classical NDVI, a number of other indicators are widely used, including EVI, SAVI, GNDVI, NDRE, and MSAVI [Tenreiro et al. 2021; Sapkota et al. 2025; Flynn et al. 2026; Jin et al. 2026], as well as water and pigment status indices such as NDWI, PRI, and CIred-edge [Matas-Granados et al. 2022; Allu, Mesapam 2025]. These indices allow for more detailed assessment of biomass accumulation, chlorophyll status, water supply, and photochemical activity of crops [Jamali et al. 2023].
At the same time, NDVI remains the most universal and methodologically stable indicator for agronomic research. Its key advantages include simplicity of calculation and interregional comparability [Balaghi et al. 2008; Ezzaher et al. 2026; Karuppiah et al. 2026], high sensitivity to changes in canopy density and photosynthetic activity [Guo et al. 2019], and the availability of long-term satellite archives. The spatiotemporal dynamics of NDVI reliably reflect the intensity of leaf area development, chlorophyll content, and the efficiency of the assimilatory apparatus [Shammi, Meng 2021], making it suitable for crop condition monitoring and yield forecasting model development [Roznik et al. 2022].
The integration of field experimental data with satellite observations opens new opportunities for quantitative analysis of the influence of agronomic factors on yield formation. The development of mathematical models combining remote sensing indicators and actual productivity enables yield forecasting [Ansarifar et al. 2021] while accounting for genotype and climatic characteristics [Beyer et al. 2023; Hu et al. 2024]. Such approaches are particularly important in the steppe zone, where the water regime is the dominant limiting factor [Pichura et al. 2022], and critical stages of organogenesis determine up to 60% of the future yield [Flagella et al. 2002].
Consideration of hybrid phenotypic plasticity is a necessary prerequisite for improving the accuracy of predictive assessments [Des Marais et al. 2013; Fu, Wang 2023]. The combination of genetic, physiological, agronomic, and remote sensing indicators forms the scientific basis for the development of adaptive management systems for the sunflower production process [Pichura et al. 2023].
Crop condition monitoring in this study was carried out using Sentinel-2 satellite data with an imaging frequency of approximately 5 days and a spatial resolution of 10 × 10 m [Tenreiro et al. 2021; Marino 2023; Ezzaher et al. 2026], ensuring a high level of analytical detail at the scale of commercial fields.
The objective of the study is to assess the impact of plant growth regulators on the yield performance of sunflower hybrids in the steppe zone of Ukraine and to identify the spatiotemporal patterns of productivity formation based on the integration of field experimental data and remote sensing vegetation indices in order to develop high-accuracy yield forecasting models.
2. MATERIALS AND METHODS
2.1. Study Area
In 2019–2021, a series of field experiments was conducted to investigate the growth, photosynthetic activity, and productivity of sunflower hybrids under the conditions of the steppe zone of Ukraine. The research was carried out at the experimental fields of the Mykolaiv State Agricultural Research Station of the Institute of Irrigated Agriculture of the National Academy of Agrarian Sciences of Ukraine. The crops were grown under rainfed conditions without supplemental irrigation, which made it possible to assess the realization of the crop production potential under natural contrast in water availability.
The area of the experimental plots was (Figure 1): 2019 – 1.9 ha; 2020 – 8.4 ha; 2021 – 0.75 ha. The variation in area was due to compliance with crop rotation requirements under relatively homogeneous soil and climatic conditions. Winter wheat served as the preceding crop for sunflower in all study years.
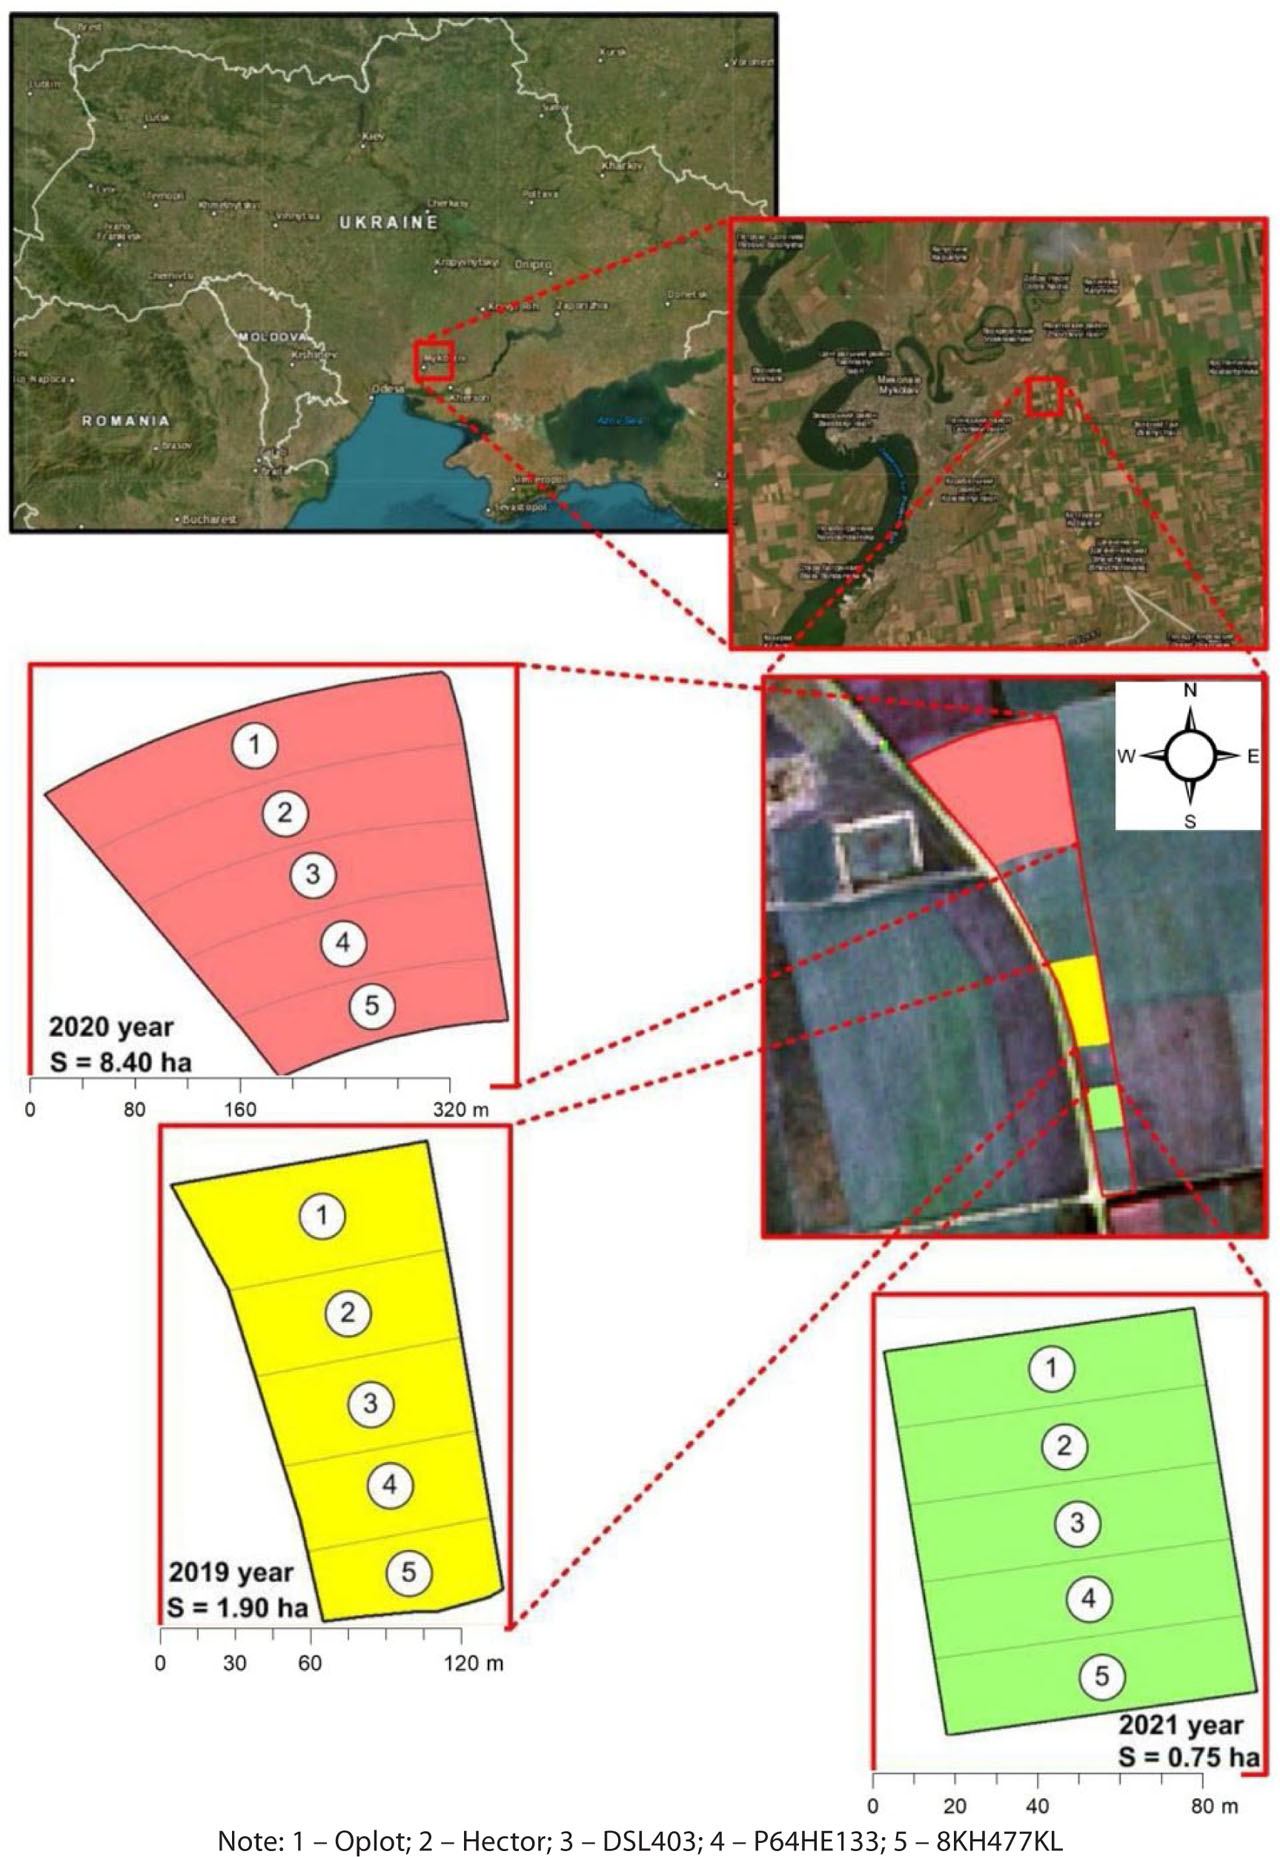
Figure 1.
Location of the study area and schematic diagram of the strip-plot arrangement of sunflower hybrid crops at the experimental fields of the Mykolaiv State Agricultural Research Station in 2019–2021
The coordinates of the experimental plot polygons:
2019 p.: [32.144704, 46.981965; 32.146507, 46.982228; 32.146850, 46.980398; 32.145799, 46.980267; 32.144704, 46.981965];
2020 p.: [32.140718, 46.985486; 32.145181, 46.986277; 32.145867, 46.983583; 32.143550, 46.983232; 32.140718, 46.985486];
2021 p.: [32.146121, 46.978993; 32.147172, 46.979110; 32.147472, 46.978027; 32.146442, 46.977924; 32.146121, 46.978993].
The experimental plots were established on southern chernozems characterized by a heavy loamy silty granular texture and low humus content. The organic matter content ranged from 2.7 to 3.1%, and the thickness of the humus horizon was 30–40 cm. The soil solution reaction was close to neutral (pH 6.5–6.8). Hydrolytic acidity ranged from 2.00 to 2.52 mg-eq/100 g of soil, and the sum of exchangeable bases was 32–35 mg-eq/100 g, corresponding to a base saturation degree of approximately 95.7%.
The content of nitrate nitrogen in the 0–20 cm layer averaged 30.0 mg/kg, available phosphorus was approximately 100 mg/kg, and exchangeable potassium was approximately 300.0 mg/kg, indicating sufficient soil macroelement availability to support high crop productivity.
Meteorological data (T, °C; P, mm) were obtained from the Mykolaiv meteorological station. Climatic normals were determined for the period 1970–2020. According to hydrothermal indicators, the study years were classified as follows: 2019 – moderately wet; 2020 – dry; 2021 – wet.
The contrast in temperature regime and the uneven distribution of precipitation resulted in different levels of water stress, which became the key environmental factor driving variability in canopy photosynthetic activity and hybrid yield performance.
2.2. Experimental Design and Field Methods
The field experiment was established using a strip-plot arrangement of hybrids with subdivision into subplots according to treatment variants. Within each year, the experimental field was divided into five adjacent strips, each corresponding to a specific sunflower hybrid: 1 – Oplot; 2 – Hector; 3 – DSL403; 4 – P64HE133; 5 – 8KH477KL.
Each hybrid strip was divided into three subplots according to foliar treatment variants: Control – water treatment; Architect™ – a chemical plant growth regulator with fungicidal properties (ID 30652554/SDS_CPA_UA/UK); Helafit Combi – a biological multifunctional product (registration UA A07743 dated 02.09.2019).
Architect™ is a combined chemical product with fungicidal and morphoregulatory action. Its active ingredients are pyraclostrobin (100 g/L) and mepiquat chloride (250 g/L). Pyraclostrobin belongs to the strobilurin class (QoI respiration inhibitors) and suppresses mitochondrial respiration in phytopathogenic fungi, providing protection against a complex of foliar diseases. In addition to its fungicidal effect, this compound exhibits a physiological effect of the AgCelence® type, increasing photosynthetic intensity, reducing oxidative stress, and prolonging canopy functionality. Mepiquat chloride is a plant growth regulator and an inhibitor of gibberellin biosynthesis. It limits excessive internode elongation, optimizes plant architectonics, enhances lodging resistance, and promotes assimilate redistribution toward reproductive organs. The combination of these two components ensures simultaneous plant protection and regulation of morphophysiological development.
Helafit Combi is a biological multifunctional plant growth regulator (biostimulant) with complex action. The product contains free L-amino acids of plant origin, a natural phytohormonal complex (auxins, cytokinins, gibberellins in physiologically low concentrations), micronutrients in chelated form (including boron, zinc, manganese, iron, copper, molybdenum), as well as vitamin and organic bioactive compounds. Amino acids perform osmoregulatory and anti-stress functions and participate in protein and enzyme synthesis. Phytohormones stimulate cell division, root system development, and reproductive organ formation. Micronutrients activate enzymatic systems, enhance photosynthetic activity, and improve fertilization processes. Owing to this composition, Helafit Combi increases plant adaptability to abiotic stresses (drought, temperature fluctuations), prolongs canopy activity, and promotes more intensive seed filling.
Foliar application of plant growth regulators was carried out at a rate of 1 L/ha at the stage of 6–8 true leaves of sunflower (BBCH 16-18) using a backpack boom sprayer in the morning hours (before 11:00 a.m.) under calm weather conditions to ensure uniform leaf surface coverage. Control subplots were treated with water only, following identical technological parameters.
Spraying was conducted under the following technical parameters:
– working pressure – 0.25–0.30 MPa;
– nozzle type – flat-fan slit nozzles (XR 110–03 or equivalent);
– mean droplet diameter – 200–300 μm (fine-to-medium spectrum);
– boom height above plants – approximately 0.5 m;
– operator movement speed – 3.5–4.0 km/h.
Meteorological conditions during application were monitored in situ. Treatments were performed under the following parameters:
– wind speed – not exceeding 3 m/s;
– air temperature – 18–24 °C;
– relative humidity – 60–75%;
– absence of precipitation for at least 6 hours after application.
Compliance with these conditions was critically important to ensure the biological effectiveness of the products, particularly the biological regulator Helafit Combi, whose activity depends on the temperature and moisture regime, working solution stability, and retention time on the leaf surface.
Replication of treatment variants within a single year was not provided for; comparisons among 2019, 2020, and 2021 were considered as experimental reproduction under contrasting hydrothermal conditions of the growing seasons (year as a block environmental factor).
The experimental structure included:
– Factor A (Ah – Hybrid) – 5 levels (sunflower hybrids of domestic and foreign breeding). Domestic: Hector and Oplot (Plant Production Institute named after V. Ya. Yuriev of NAAS). Foreign: DSL403 (Corteva), P64HE133 (Brevant), 8KH477KL (Dow Seeds).
– Factor B (Br – Regulator) – 3 levels (Control, Architect™, Helafit Combi).
– Factor C (Year) – 3 levels (2019, 2020, 2021).
– Response variable (Y) – Yield, t/ha.
Sowing of hybrids each year was performed in the same sequence under soil and climatic conditions typical for the steppe zone. The experimental design included first-order plots of 168 m2 and accounting plots of 120 m2. Sowing was carried out using a precision seeder UPS-8 manufactured by JSC “Elvorti” (Ukraine). Plant density was 48.7 thousand seeds/ha.
The main dates of field operations are presented in Table 1. Records and observations were conducted in accordance with generally accepted methodologies of agronomic research [Didora et al. 2013; Ermantraut et al. 2008], the recommendations of the Plant Production Institute named after V. Ya. Yuriev of NAAS, as well as the requirements of national standards: DSTU 7011:2009 “Sunflower Seeds. Technical Specifications” (DSTU 7011:2009) and DSTU 6068:2008 “Sunflower Seeds. Varietal and Sowing Qualities” (DSTU 6068:2008).
Table 1.
Main Timeline of the Experiments
| Year | Sowing Date | Harvest Date |
|---|---|---|
| 2019 | 24/04 | 26/08 |
| 2020 | 29/04 | 22/08 |
| 2021 | 10/05 | 12/09 |
Soil moisture at sowing and harvesting was determined using the oven-drying (thermostatic gravimetric) method [Papish 2001]. Yield was recorded by complete harvesting of seeds from each subplot with recalculation to t/ha at a standard moisture content of 8% and 100% purity in accordance with current regulatory requirements (DSTU 7011:2009; DSTU 6068:2008).
2.3. Methods of Satellite Image Interpretation and Spatial Analysis
The spatiotemporal dynamics of sunflower hybrid development were investigated by calculating the Normalized Difference Vegetation Index (NDVI) [Ding et al. 2022; Beyer et al. 2023] based on Sentinel-2 satellite data processed at a spatial resolution of 10 × 10 m per pixel.
The NDVI was calculated using the formula:
where: NIR is the reflectance of vegetation in the near-infrared range (Sentinel-2, Band 8); RED is the reflectance in the red spectral range (Band 4) [Lunetta et al. 2010; Tenreiro et al. 2021].NDVI values ranged from –1.0 to +1.0 [Balaghi et al. 2008]. Negative values corresponded to clouds, snow cover, or open water surfaces, whereas values close to zero (0.05–0.14) characterized bare soil or rocky surfaces [Matas-Granados et al. 2022]. During the sowing period in all study years, mean NDVI values were approximately 0.15.
During the period of active vegetation from the macrostage of inflorescence development (budding, BBCH 51-59) to the completion of the flowering macrostage (BBCH 61–69) NDVI values were used to assess sunflower crop condition according to the following classification [Guo et al. 2019; Shammi, Meng 2021]: ≤ 0.14 – bare soil or non-vegetated surfaces; 0.15–0.20 – sparse vegetation; 0.20–0.30 – suppressed vegetation; 0.30–0.40 – very poor condition; 0.40–0.55 – satisfactory condition; 0.55–0.70 – good condition; > 0.70 – very good crop condition.
Only cloud-free satellite images fully covering the boundaries of the experimental fields were used for analysis [Marino 2023]. Processing was performed at intervals of 10–16 days to capture NDVI values at key phenological stages of sunflower development [Jamali et al. 2023]: germination (BBCH 00-09), leaf development (BBCH 10-19), stem elongation (BBCH 30-39), inflorescence emergence (BBCH 51-59), flowering (BBCH 61-69), fruit development (BBCH 71-79), ripening (BBCH 81-89), senescence (BBCH 92-99).
Alignment of satellite data with the corresponding growth stages made it possible to track hybrid development dynamics, identify phenological shifts caused by weather variability, and classify growing seasons as dry, moderately moist, or wet [Pichura et al. 2022]. All satellite observations were synchronized with sowing and harvesting dates in 2019–2021, ensuring temporal consistency of the analysis.
To enhance the visual representation of the spatiotemporal NDVI dynamics and enable more detailed analysis of crop condition variability, Sentinel-2 data were processed using geostatistical methods in the ArcGIS 10.6 software environment (Geostatistical Analyst module). Interpolation was performed using Radial Basis Functions (RBF) [Kamińska and Grzywna 2014; Pichura et al. 2023] with a multiquadric kernel and an automatically optimized smoothness parameter.
The application of this approach made it possible to generate smoothed continuous NDVI distribution surfaces that accurately reproduced measured values at nodal points while estimating values in unsampled areas [Kamińska, Grzywna 2014]. Since RBF belongs to the class of exact interpolators, the calculated surface passes directly through the observed values, preserving extreme maxima and minima and ensuring spatial continuity in adjacent zones.
Interpolation was applied to enhance the analytical detail of spatial gradients of the vegetation index and to create a denser computational grid (0.5 × 0.5 m), which was used exclusively for geostatistical modeling and comparison with ground-based observations [Pichura et al. 2023]. This approach does not alter the original spatial resolution of the satellite data (10 m) but provides a smoothed representation of spatial variability.
As a result, the density of calculated (interpolated) points increased by approximately 20 times, which improved the reliability of integrating remote sensing and field data and enhanced the robustness of mathematical yield forecasting models [Ansarifar et al. 2021; Beyer et al. 2023].
Additionally, a composite seasonal indicator, NDVIyear, was generated as a weighted sum of NDVI values during critical phases of water consumption and nutrient uptake. Weighting coefficients were determined according to the contribution of each phase to productivity formation: NDVIBBCH16-19 − 0.2; NDVIBBCH61-67 − 0.6; NDVIBBCH79-80 − 0.2.
The calculation was performed using the formula:
where: NDVIBBCH16-19 corresponds to the stage of 6–9 true leaves; NDVIBBCH61-67 to the active flowering stage; NDVIBBCH79-81 to the stage of completion of seed filling and the onset of ripening.Satellite image processing, cartographic material generation, and spatiotemporal analyses were performed in the licensed ArcGIS 10.6 software environment (Environmental Systems Research Institute, USA), ensuring standardization of analytical procedures and high-quality visualization of results.
2.4. Statistical Analysis and Predictive Models
Statistical processing of the experimental data was performed in the Statistica 13 software environment (TIBCO Software Inc., USA) using methods of the General Linear Model (GLM), analysis of variance (ANOVA), and regression analysis [Riffenburgh 2006; Hayat et al. 2022].
Considering the strip-plot arrangement of treatments and the absence of replications within an individual year, the factor Year (2019–2021) was treated as a block factor reflecting contrasting hydrothermal conditions of the growing seasons [Park et al. 2005]. The effects of Hybrid, foliar treatment variant (Regulator), and Year, as well as the Hybrid × Regulator interaction, were evaluated within the framework of the analysis of variance model [Riffenburgh 2006]:
where: Yh,r,y – yield (t/ha); μ – the overall mean; Ah – the effect of Hybrid; Br – the effect of Regulator; Cy – the effect of Year (block factor); (AB)h,r – the Hybrid × Regulator interaction; ɛ – the random error term.The level of statistical significance was set at p ≤ 0.05. Tukey's HSD test was used for multiple comparisons of means [Riffenburgh 2006]. Additionally, regulator efficiency was evaluated using effect size indicators: absolute yield difference Δ (t/ha) and relative increase (%).
Regression Modeling Based on NDVI
To integrate field productivity indicators with remote sensing-based crop condition metrics, the relationship between vegetation indices (NDVI) and yield was assessed using multiple linear regression [Guo et al. 2019; Ansarifar et al. 2021]. The basic predictive model was expressed as follows:
where: Ŷ – predicted yield (t/ha); NDVIBBCH16-19 – NDVI value at the stage of 6–9 true leaves; NDVIBBCH61-67 – value at the active flowering stage; NDVIBBCH79-80 – value at the stage of completion of seed filling and the onset of ripening; β0 – intercept of the model; β1, β2, β3 – regression coefficients.Model performance was evaluated using the coefficient of determination (R2) [Riffenburgh 2006].
Validation of Forecasting and the R2test Indicator
To assess model transferability across contrasting years, a “leave-one-year-out” approach was applied [Wang et al. 2019]: the model was calibrated using data from two years, and testing was performed on the third independent year.
The coefficient of determination for the test dataset was calculated using the formula:
where: Yi – the observed yield; Ŷi – the predicted value; Ŷtest – the mean of the test dataset; ntest – the size of the test data sample.The R2test indicator may take negative values if the prediction error exceeds the natural variability of the test observations, indicating low interannual transferability of the model [Wang et al. 2019].
Forecast Accuracy Metrics
To evaluate the accuracy of the developed regression models for yield forecasting, standard statistical error metrics were used [Riffenburgh 2006; Hayat et al. 2022].
RMSE (Root Mean Square Error) characterizes the root mean square deviation of predicted yield values from observed values and is sensitive to large modeling errors:
MAE (Mean Absolute Error) represents the mean absolute deviation of the predicted values from the observed values:
MAPE (Mean Absolute Percentage Error) indicates the mean relative prediction error expressed as a percentage:
where: Yi – the actual yield, Ŷi – the predicted yield, n – the number of observations.Limitations of the Study. Considering the non-replicated strip-plot design, the absence of within-year replications limits the assessment of random variability in yield. Therefore, statistical conclusions were interpreted in conjunction with GLM analysis, effect size estimates, and the interannual consistency of trends under contrasting hydrothermal conditions.
3. RESULTS
3.1. Analysis of Climatic Conditions in the Study Area
The climate of the study region is characterized as semi-arid with a chronic deficit of atmospheric moisture, which is the determining environmental factor in the formation of agroecosystem productivity in the steppe zone. Over the long-term period 1970–2020, the mean air temperature of the growing season was 18.0 °C, with a standard deviation of 4.9 °C, a coefficient of variation of 27.3%, and a sum of mean monthly temperatures of 89.9 °C (Figure 2a). Interannual analysis revealed significant contrast in the thermal regime during the study years. In the dry year 2020, the mean temperature increased to 19.0 °C (SD 6.3 °C; CV 33.3%; sum 94.8 °C). The moderately wet year 2019 was characterized by an even higher temperature background of 20.4 °C (SD 5.5 °C; CV 27.0%; sum 102.0 °C), whereas in the wet year 2021 the temperature decreased to 18.4 °C (SD 6.6 °C; CV 35.8%; sum 92.2 °C).
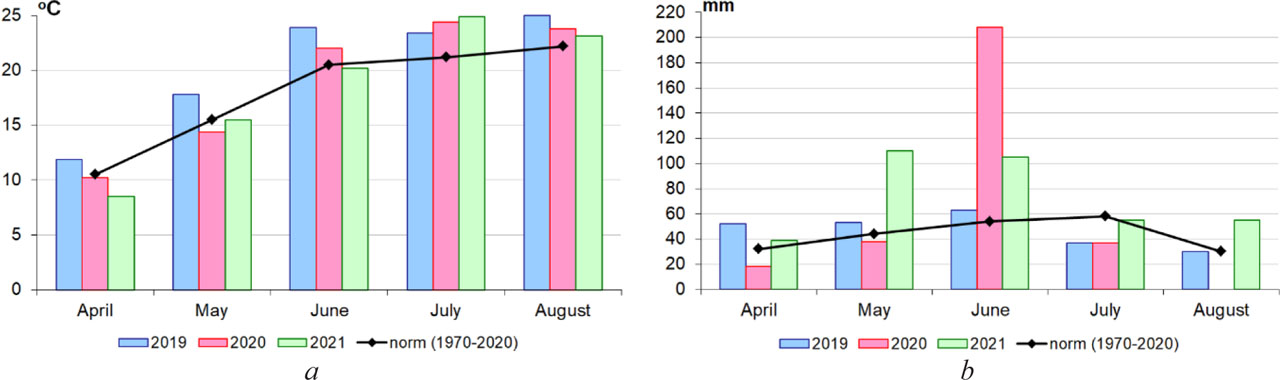
Figure 2.
Climatic conditions of the sunflower growing season in 2019–2021: a – mean monthly air temperature (°C); b – precipitation amount (mm)
The identified differences indicate instability of the thermal regime among years with different moisture conditions. Dry periods were accompanied by sharp temperature increases, whereas relatively lower temperatures were observed in wet years. Importantly, temperature fluctuations were asynchronous with precipitation dynamics, which intensified hydrothermal stress in plants. Temperature increases enhance transpiration and physical evaporation from the soil surface, leading to increased crop water consumption during critical stages of organogenesis.
Analysis of the precipitation regime demonstrated an increase in the frequency of extreme rainfall events over the past one and a half decades. In particular, in July 2020 (Figure 2b), a sharp increase in precipitation was recorded during the sunflower flowering period (BBCH 61-69), which was accompanied by a short-term increase in the vegetation index. However, such episodes did not ensure long-term improvement in crop water availability. This is confirmed by the high standard deviation of precipitation (84.1 mm) and the extremely high variability of its seasonal total (CV 139.7%) in 2020, indicating an atypical and uneven pattern of moisture distribution.
According to long-term data (1970–2020), the mean monthly precipitation during the growing season is 43.6 mm (SD 12.6 mm; CV 28.9%). In 2019, the indicators were close to the climatic norm (47.0 mm; SD 13.3 mm; CV 28.3%), whereas 2021 was characterized by excessive moisture supply – 72.8 mm (SD 32.4 mm; CV 44.5%).
The total precipitation during the growing season amounted to: 2019–235 mm; 2020–295 mm; 2021–364 mm, compared to the long-term norm of 218 mm. At the same time, in July 2020 more than 70% of the seasonal precipitation total occurred, indicating extremely uneven distribution and low efficiency of atmospheric moisture utilization by plants.
Sunflower water consumption during the growing season ranges from 500–600 mm, while the minimum crop requirement is met with 300–400 mm of precipitation. Under conditions of atmospheric moisture deficit, reserves of productive soil moisture play a significant role. Before sowing, they amounted to: 41 mm in the dry year 2020; 69 mm in the moderately wet year 2019; 89 mm in the wet year 2021.
Reduced soil moisture reserves at the beginning of the growing season limited initial plant development, whereas their sufficiency in 2021 contributed to the formation of high production potential.
Climatic analysis also showed that in the second half of 2019, the atmospheric moisture deficit reached 23.9% relative to the norm, while the temperature background exceeded it by 11.5%, leading to the development of thermal and water stress. In 2020, prolonged moisture deficit combined with high temperatures and uneven precipitation created the most extreme growing conditions. In contrast, in 2021 sufficient moisture supply during the budding–flowering stage (BBCH 51-69) minimized drought stress manifestations and ensured the highest realization of hybrid yield potential.
The hydrothermal regime of the study years was characterized by high contrast and instability, generating different levels of environmental stress for sunflower crops. The water regime acted as the dominant limiting factor of productivity, modifying the effects of temperature, intensity of photosynthetic processes, and the efficiency of agronomic practices. The identified climatic differences formed the environmental basis for further analysis of hybrid responses to technological cultivation factors, particularly the application of multifunctional plant growth regulators.
The established interannual contrast in hydrothermal conditions during the 2019–2021 growing seasons resulted in different levels of water and temperature stress, directly affecting the duration of canopy functioning, chlorophyll synthesis intensity, and the realization of the genetic yield potential of sunflower hybrids. The combination of deficit or excess atmospheric moisture with temperature anomalies determined the spatiotemporal variability of vegetation development.
Under such conditions, assessment of crop response based solely on meteorological indicators is insufficient, as it does not reflect the actual physiological state of agrocenoses. This necessitates the use of remote sensing indicators capable of integrally capturing the combined influence of climatic, edaphic, and technological factors on plant growth and development.
3.2. Assessment of Sunflower Hybrid Crop Condition
Sunflower productivity is formed under the influence of a complex interaction of factors, among which the leading roles are played by the genetic potential of the hybrid, its physiological characteristics, physicochemical soil properties, regional climatic conditions, and elements of varietal agronomic practices [Flagella et al. 2002; Ibrahim 2012; Fu, Wang 2023]. Integral indicators of plant development include the intensity of photosynthetic activity and the level of chlorophyll synthesis, which vary depending on macro- and micro-phenological stages of organogenesis [Des Marais et al. 2013].
In this study, the dynamics of photosynthetic activity of sunflower hybrids were assessed using the Normalized Difference Vegetation Index (NDVI), one of the most informative remote sensing indicators of agroecosystem productivity [Balaghi et al. 2008; Lunetta et al. 2010; Tenreiro et al. 2021]. During 2019–2021, NDVI values were calculated based on Sentinel-2 satellite imagery, enabling spatiotemporal monitoring of vegetation cover condition [Marino 2023; Jamali et al. 2023].
The methodological basis of the index lies in the spectral contrast between the absorption of electromagnetic energy by chlorophyll in the red range and its reflection in the near-infrared range [Lunetta et al. 2010; Matas-Granados et al. 2022]. For Sentinel-2, the central wavelengths are approximately 665 nm (Red) and 842 nm (NIR) [Tenreiro et al. 2021]. This ratio reflects canopy density, photosynthetic intensity, and the level of realization of crop production potential [Guo et al. 2019; Shammi, Meng 2021].
Further analysis was performed separately for years with different moisture regimes moderately wet (2019), dry (2020), and wet (2021) which made it possible to trace the spatiotemporal dynamics of crop condition and to identify patterns of hybrid response to contrasting hydrothermal conditions of the growing seasons.
3.3. Moderately Wet Year (2019)
Analysis of interpreted satellite images of the moderately wet year 2019 (Figure 3) at the beginning of the growing season (May 5, 12 days after sowing) indicated the formation of uniform sunflower hybrid emergence. The mean NDVI value was 0.26 ± 0.03 with low spatial variability – 8.1%, indicating uniform initial plant development.
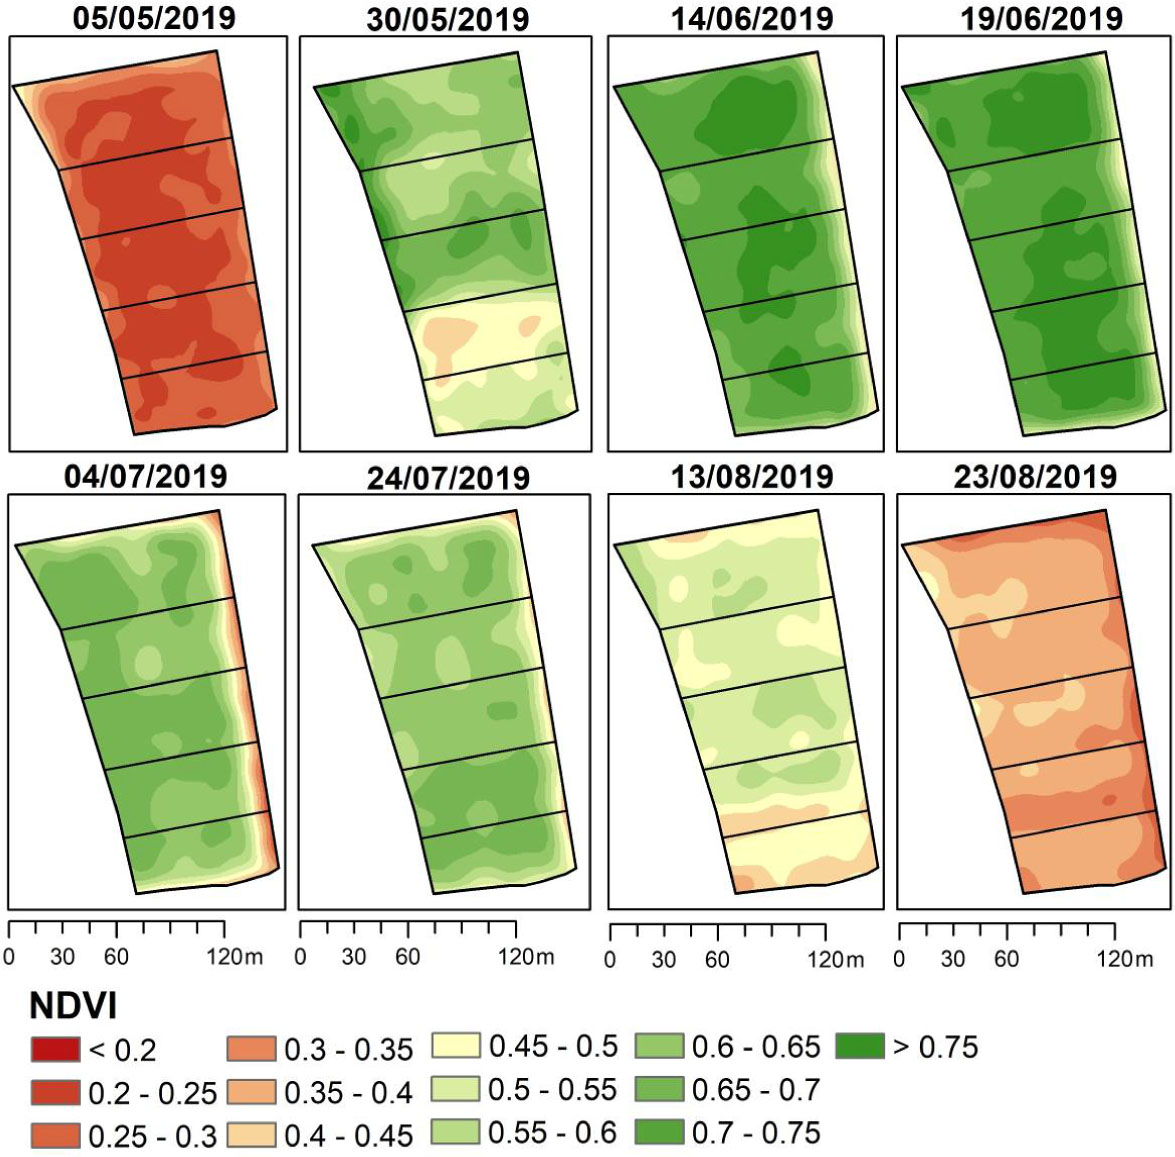
Figure 3.
Seasonal NDVI distribution of sunflower hybrids in the experimental field (2019)
After foliar application of multifunctional plant growth regulators (May 30, 37 days after sowing), a differentiated response of the hybrids was recorded. The most pronounced positive effect was observed in Oplot, Hector, and DSL403 (NDVI 0.54–0.80), whereas P64HE133 and 8KH477KL showed a weaker response (0.41–0.67).
During the late vegetative period and at the transition to flowering, all hybrids were in “good” or “very good” condition (NDVI ≥ 0.55). The mean index value reached 0.72 ± 0.06 with low spatial heterogeneity, reflecting the combined positive influence of adequate moisture supply and plant growth regulators.
In the second half of the growing season, the influence of climatic stressors intensified. Moisture deficit and elevated temperatures led to a decline in photosynthetic activity and shortening of the reproductive period. As of July 4, NDVI decreased to 0.63 ± 0.09, and spatial variability increased to 14.1%, indicating differentiation of production potential. During the senescence stage (August), NDVI declined to 0.30–0.37, reflecting the completion of canopy functioning and the end of the growing season.
3.4. Dry Year (2020)
The 2020 growing season was characterized by pronounced drought, which shortened the vegetation period and accelerated the progression of phenological stages (Figure 4). Already at the beginning of development, soil moisture deficit caused suppressed emergence and low photosynthetic activity.
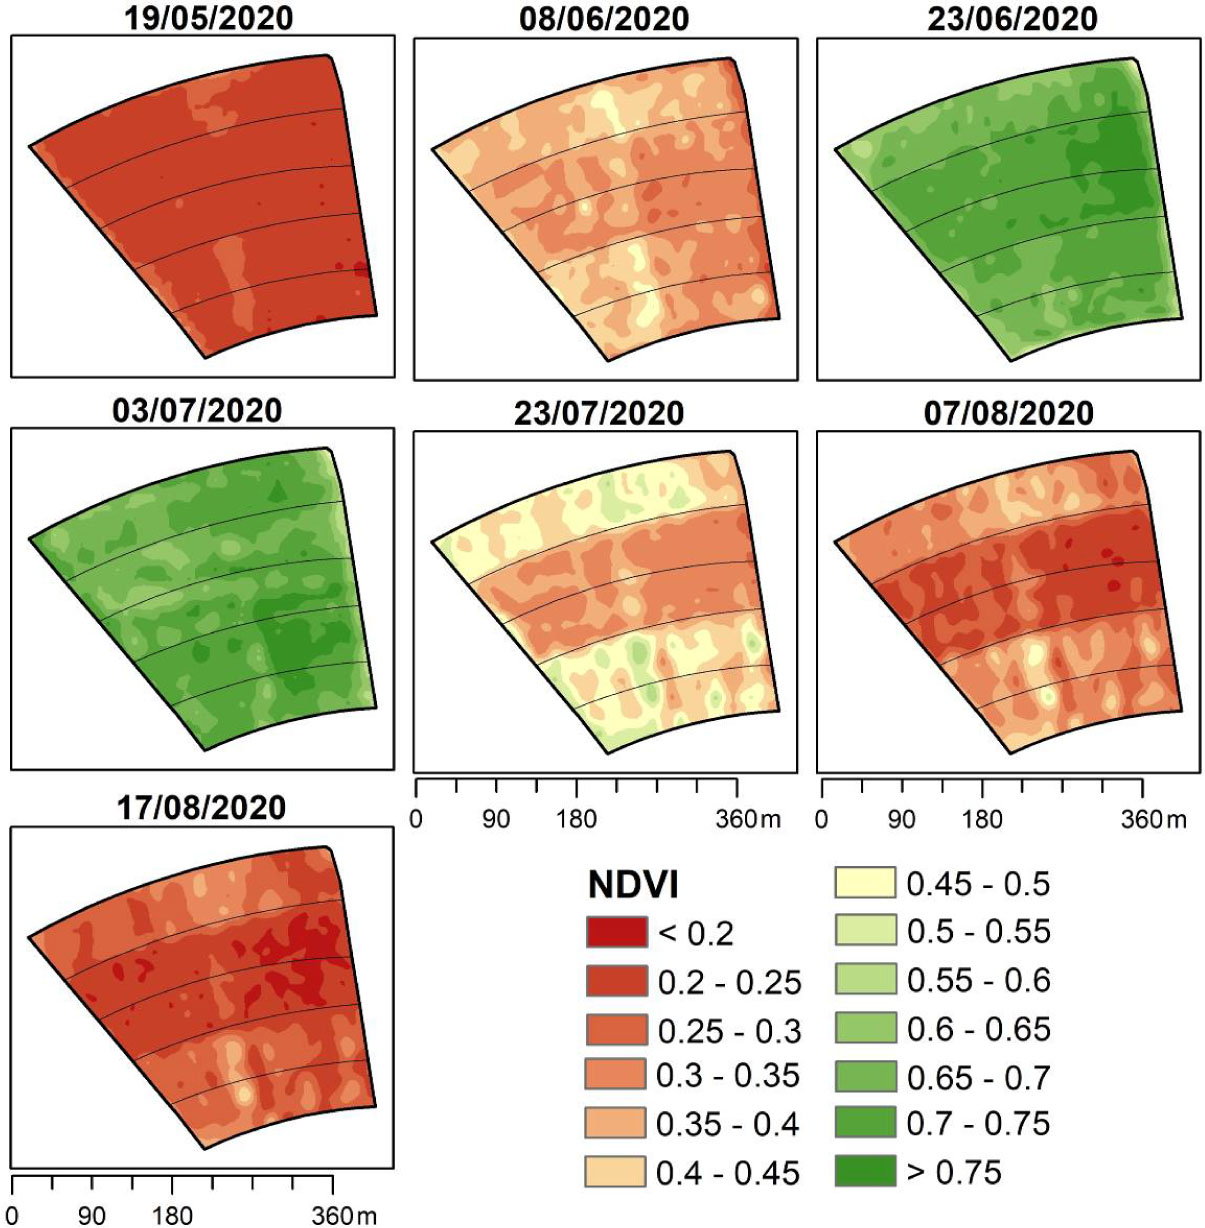
Figure 4.
Seasonal NDVI distribution of sunflower hybrids in the experimental field (2020)
As of May 19, NDVI was only 0.23 ± 0.02, reflecting critical water stress. In the first decade of June, the index increased to 0.36; however, development remained slowed.
Short-term heavy rainfall at the end of June temporarily stabilized crop condition: at the onset of flowering, NDVI increased to 0.70. However, this effect was short-lived. In the second half of the growing season, moisture deficit again reached a critical level, leading to accelerated ripening and plant senescence. By July 23, NDVI had declined to 0.41, and by August 7 to 0.30. High spatial variability (up to 12.2%) indicated heterogeneity of stress impact. In mid-August, NDVI reached a minimum of 0.25.
Under dry conditions, the hybrids Hector and DSL403 progressed more rapidly through phenological stages, confirming their lower tolerance to water deficit.
3.5. Wet Year (2021)
In contrast to the previous season, 2021 was characterized by a favorable water regime (Figure 5). Pre-sowing precipitation ensured sufficient soil moisture reserves, resulting in uniform emergence (NDVI = 0.25 ± 0.03).
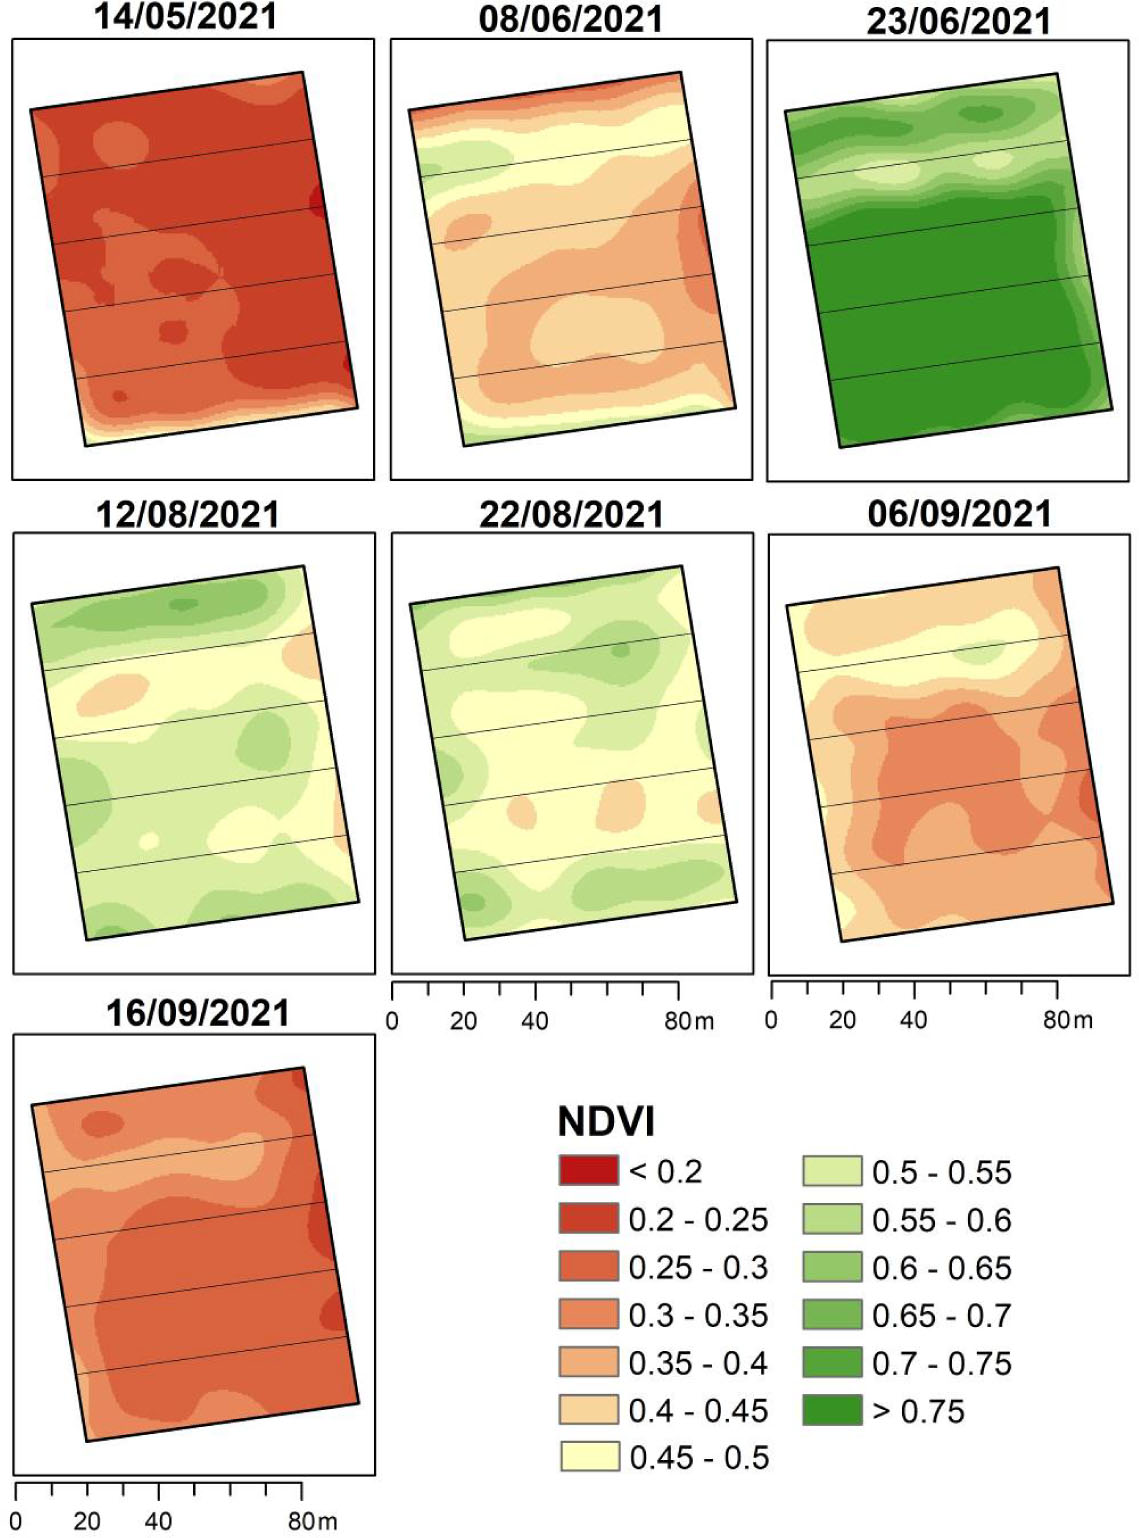
Figure 5.
Seasonal NDVI distribution of sunflower hybrids in the experimental field (2021)
After the application of plant growth regulators (June 8), genotype-specific differentiation in response became evident: the highest NDVI was recorded for Oplot (0.56), whereas DSL403 and P64HE133 showed lower values.
During the flowering stage, photosynthetic activity reached its maximum: NDVI averaged 0.75 ± 0.06, with peak values of 0.89–0.93. The duration of flowering (33 days) was 2.3 times longer than in previous years, indicating optimal moisture conditions. Elevated assimilatory apparatus activity was maintained during the fruit development and seed filling stages (NDVI ≈ 0.54), ensuring high productivity potential.
At the final stages of vegetation, NDVI gradually decreased to 0.32–0.39, reflecting natural plant senescence. Spatial variability at this stage was determined by heterogeneity of soil moisture reserves and differences in hybrid plasticity.
The obtained satellite monitoring results demonstrated a clear dependence of canopy photosynthetic activity dynamics on the hydrothermal regime of the years, genotype-specific hybrid characteristics, and technological cultivation factors. The spatiotemporal variability of NDVI reflected both the level of realization of crop production potential and the degree of climatic stress manifestation during critical stages of organogenesis.
This created an analytical basis for further quantitative comparison of remote sensing-based crop condition indicators with actual yield performance and for transitioning to statistical modeling of the “NDVI– productivity” relationship, which is considered in the subsequent subsections of the Results and Discussion.
3.6. Analysis of Sunflower Hybrid Productivity
The results of field experiments combined with satellite monitoring of crop condition confirmed the role of multifunctional plant growth regulators in improving growth conditions and stabilizing sunflower hybrid productivity under contrasting hydrothermal conditions of 2019–2021. Experimental data (Table 2) demonstrated that the hybrids Oplot and P64HE133 exhibited the most pronounced response to foliar treatments, showing increased adaptability to weather stress and forming higher yield compared to the control. Within the studied dataset, yield increase depending on the moisture regime amounted to: in the dry year – 0.10–0.34 t/ha; in the moderately wet year – 0.38–0.86 t/ha; in the wet year – 0.26–0.87 t/ha.
Table 2.
Yield of Sunflower Hybrids Depending on Factors A (Hybrid), B (Plant Growth Regulator), and C (Study Year), (t/ha)
| Hybrid (A) | Regulator (B) | 2019 | 2020 | 2021 | Mean |
|---|---|---|---|---|---|
| Oplot | Control | 2.82 | 1.98 | 2.88 | 2.56 |
| Architect™ | 3.07 | 2.01 | 3.12 | 2.73 | |
| Helafit Combi | 3.10 | 2.04 | 3.11 | 2.75 | |
| Hector | Control | 1.92 | 1.54 | 2.04 | 1.83 |
| Architect™ | 2.14 | 1.68 | 2.23 | 2.02 | |
| Helafit Combi | 2.10 | 1.72 | 2.22 | 2.01 | |
| DSL403 | Control | 2.44 | 1.83 | 2.54 | 2.27 |
| Architect™ | 2.55 | 1.88 | 2.86 | 2.43 | |
| Helafit Combi | 2.60 | 1.93 | 2.90 | 2.48 | |
| P64HE133 | Control | 2.71 | 1.90 | 2.92 | 2.51 |
| Architect™ | 2.88 | 1.95 | 3.05 | 2.63 | |
| Helafit Combi | 2.89 | 2.02 | 3.10 | 2.67 | |
| 8KH477KL | Control | 2.22 | 1.68 | 2.41 | 2.10 |
| Architect™ | 2.37 | 1.71 | 2.96 | 2.35 | |
| Helafit Combi | 2.37 | 1.74 | 3.09 | 2.40 |
In contrast, the hybrid Hector was characterized by limited ecological plasticity and a noticeable decline in productivity under unfavorable growing conditions. The hybrids DSL403 and 8KH477KL occupied an intermediate position: in the dry year, their yield was 18.1–34.5% lower than in the moderately wet year, whereas under sufficient moisture supply it increased by 0.3–30.4%, indicating their heightened sensitivity to the water regime.
Generalization of the results showed that foliar application of both plant growth regulators ensured a stable positive effect for all hybrids (Figure 6). The highest average yield over 2019–2021 was formed by the hybrid Oplot, reaching 2.75 t/ha with the application of the biological product Helafit Combi. Comparative evaluation of the two regulators, the chemical Architect™ and the biological Helafit Combi, demonstrated their superiority over the control in all years. Architect™ increased yield by 1.5–9.1% in the dry year, by 4.5–11.5% in the moderately wet year, and by 4.5–22.8% in the wet year. Helafit Combi showed slightly higher efficiency: +3.0–11.7%, +6.6–9.9%, and +6.2–28.2%, respectively. Thus, under sufficient moisture supply, the biological regulator provided a more pronounced stimulatory effect, particularly in wet years.
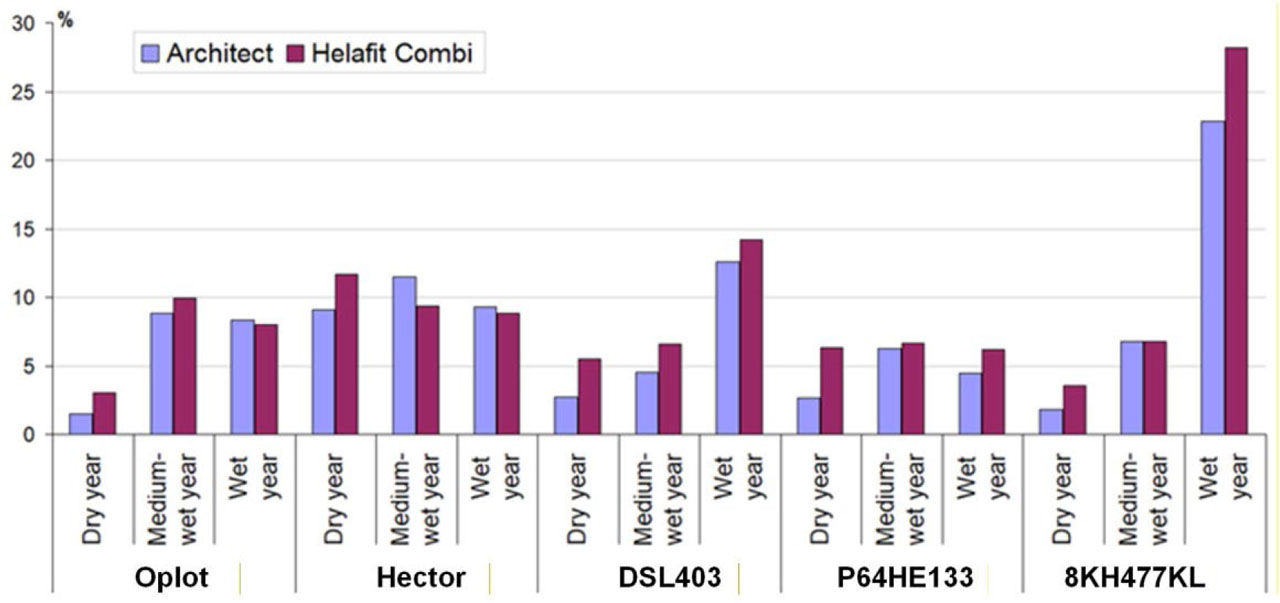
Figure 6.
Effect of multifunctional plant growth regulators on the productivity increase of sunflower hybrids in the steppe zone
Statistical generalization within the General Linear Model (GLM) framework confirmed the significant influence of the factors Year, Hybrid, and Regulator on sunflower yield (Table 3). Analysis of variance revealed a statistically significant effect of year (p < 0.001), hybrid (p < 0.001), and plant growth regulator (p = 0.003), with the largest proportion of variance explained by the Year factor, reflecting the contrasting hydrothermal conditions of the seasons. The Hybrid × Regulator interaction was statistically non-significant (p > 0.05), indicating relative stability in the direction of regulator effects regardless of genotype. Considering the non-replicated strip-plot design, statistical conclusions were interpreted in conjunction with effect size indicators and the interannual consistency of productivity trends.
Table 3.
Results of Analysis of Variance (GLM) of the Effects of Year, Hybrid, and Plant Growth Regulator on Sunflower Yield under a Non-Replicated Strip-Plot Field Experiment
| Source of variation | df | SS | MS | F | p |
|---|---|---|---|---|---|
| Year | 2 | 6.9618 | 3.4809 | 131.2198 | < 0.0001 |
| Hybrid | 4 | 2.9755 | 0.7439 | 28.0416 | < 0.0001 |
| Regulator | 2 | 0.3722 | 0.1861 | 7.0150 | 0.0034 |
| Hybrid × Regulator | 8 | 0.0219 | 0.0027 | 0.1033 | 0.9988 |
| Error | 28 | 0.7428 | 0.0265 | – | – |
For quantitative interpretation of the least significant differences between mean yield values, LSD0.05 was additionally calculated using the pooled residual variance of the GLM (MSerror = 0.0265; df = 28). The critical values for the main effects and their interaction are presented in Table 4 and were used to verify the significance of differences.
Table 4.
Least Significant Difference (LSD0.05), (t/ha)
| Source of variation | n | LSD0.05, t/ha |
|---|---|---|
| Factor A (Hybrid) | 9 | 0.157 |
| Factor B (Regulator) | 15 | 0.122 |
| Factor C (Year) | 15 | 0.122 |
| Interaction A×B | 3 | 0.272 |
Multiple comparisons of means (Tukey HSD, p ≤ 0.05) showed that both regulators provided statistically higher yield compared to the control, whereas the difference between Architect™ and Helafit Combi was statistically non-significant (Table 5).
Table 5.
Multiple Comparison of Mean Yield Values by Regulator Factor (Tukey HSD, p ≤ 0.05)
| Regulator | Yield, t/ha (mean) | Δ to Control, t/ha | Δ, % | Tukey group |
|---|---|---|---|---|
| Control | 2.33 | — | — | a |
| Architect™ | 2.51 | +0.18 | +7.7 | b |
| Helafit Combi | 2.55 | +0.22 | +9.4 | b |
Effect size assessment confirmed the practical significance of foliar treatments: yield increase ranged from 0.12 to 0.30 t/ha or 4.8–14.3% (Table 6). The hybrid 8KH477KL demonstrated the highest sensitivity to the regulators, whereas P64HE133 showed the lowest response.
Table 6.
Effect of Foliar Application of Plant Growth Regulators on Sunflower Yield (Average for 2019–2021)
| Hybrid | Control | Architect™ | Helafit Combi | ΔA, t/ha | ΔA, % | ΔH, t/ha | ΔH, % |
|---|---|---|---|---|---|---|---|
| Oplot | 2.56 | 2.73 | 2.75 | +0.17 | +6.6 | +0.19 | +7.4 |
| Hector | 1.83 | 2.02 | 2.01 | +0.19 | +10.4 | +0.18 | +9.8 |
| DSL403 | 2.27 | 2.43 | 2.48 | +0.16 | +7.0 | +0.21 | +9.3 |
| P64HE133 | 2.51 | 2.63 | 2.67 | +0.12 | +4.8 | +0.16 | +6.4 |
| 8KH477KL | 2.10 | 2.35 | 2.40 | +0.25 | +11.9 | +0.30 | +14.3 |
On average, in most cases the biological product Helafit Combi provided a greater yield increase compared to Architect™, confirming the potential of biostimulants as a tool for stabilizing productivity under conditions of climatic variability.
The observed genotype-specific differences in response to plant growth regulators and contrasting hydrothermal conditions require physiological interpretation. Therefore, the following subsection is devoted to the critical stages of water and nutrient uptake, during which the main contribution to yield is formed and which are most sensitive to moisture deficit or excess.
3.7. Characterization of Critical Stages of Water and Nutrient Uptake in Sunflower Yield Formation
Sunflower develops a deep and branched root system capable of extracting moisture from soil profiles at depths of 2–4 m, which is of decisive importance under conditions of atmospheric and soil drought. At the same time, crop water demand is phase-specific. During the period from emergence (BBCH 09) to the formation of 9 true leaves (BBCH 19), plants consume approximately 20% of the seasonal water requirement. Despite relatively moderate water consumption, this stage is critical for leaf area formation and the establishment of reproductive potential.
The most critical periods with respect to water supply are stem elongation (BBCH 30-39), inflorescence emergence (BBCH 51-59), and flowering (BBCH 61-69), when total water consumption reaches approximately 60% of the seasonal norm. It is during this time that head diameter, number of florets, and potential seed productivity are determined. During fruit development (BBCH 71-79), the remaining approximately 20% of water is utilized, and an important reserve of water supply is the accumulation of productive soil moisture during the autumn–winter period preceding sowing.
Estimated water consumption per 1 t of yield amounted to 927 ± 80 m3/ha in the dry year, 1106 ± 163 m3/ha in the moderately wet year, and 1540 ± 232 m3/ha in the wet year. Moisture deficit at the beginning of the growing season reduces leaf area and the number of florets per head, thereby limiting potential yield. Water shortage at the end of the growing season accelerates leaf senescence, shortens the seed filling period, and reduces oil content.
Nutrient uptake also exhibits clear phenological differentiation. During BBCH 09-61, plants absorb approximately 60% of the seasonal nitrogen requirement, up to 80% of phosphorus, and up to 90% of potassium. The BBCH 16-19 stage is one of the most effective periods for foliar and soil fertilization: toward the end of this phase, vertical stem growth slows, while root penetration into deeper soil horizons intensifies, especially under drying of the upper soil layer.
During BBCH 63-79, plants absorb approximately 40% of nitrogen, 20% of phosphorus, and about 10% of potassium. The fruit development macrostage (BBCH 71-79) is decisive for seed mass and oil content formation. Soil moisture deficit at this time may cause significant yield losses. After completion of seed filling (BBCH 81-89), remobilization of nutrients occurs along with a gradual decline in metabolic activity. A significant portion of nutrients remains in vegetative organs and returns to the soil with plant residues.
On average, the formation of 1 t of sunflower seed and the corresponding vegetative biomass requires 55 ± 5 kg N, 22 ± 3 kg P, and 110 ± 10 kg K. Approximately 90% of nutrients are absorbed by the root system and only up to 10% through the leaf surface. At the same time, leaves determine photosynthetic productivity and, consequently, the realization of production potential.
The established phase-specific patterns of water consumption and nutrient uptake substantiate the feasibility of using remote sensing-based crop condition indicators precisely during critical stages of organogenesis. Since photosynthetic intensity and canopy development are directly reflected in NDVI values, the following subsection is devoted to the spatiotemporal differentiation of NDVI and its relationship with yield under contrasting years.
3.8. Spatiotemporal Differentiation of NDVI and Yield of Sunflower Hybrids
Monitoring of NDVI during critical stages of water and nutrient uptake enabled the generation of integrated cartograms reflecting the spatial distribution of the vegetation index throughout the 2019, 2020, and 2021 seasons. The aggregated indicator NDVIyear was calculated by integrating raster layers of three key stages: BBCH 16-19, BBCH 61-67, and BBCH 79-81. Considering the phase-specific significance, weighting coefficients of 0.2–0.6–0.2 were assigned to each layer, reflecting the maximum contribution of the flowering stage to yield formation according to Equation 2.
Calculation of integral NDVIyear values in the Raster Calculator environment revealed clear spatial heterogeneity of the index, consistent with the geographical variability of hybrid yield (Figure 7). In the moderately wet year 2019, NDVIyear values ranged from 0.57 to 0.69; in the dry year 2020, they decreased to 0.48–0.59; whereas in the wet year 2021, they varied within a broader range of 0.49–0.71. This confirms that the integral NDVI reflects the intensity of canopy photosynthetic activity, which is determined by soil moisture reserves and the level of mineral nutrition.
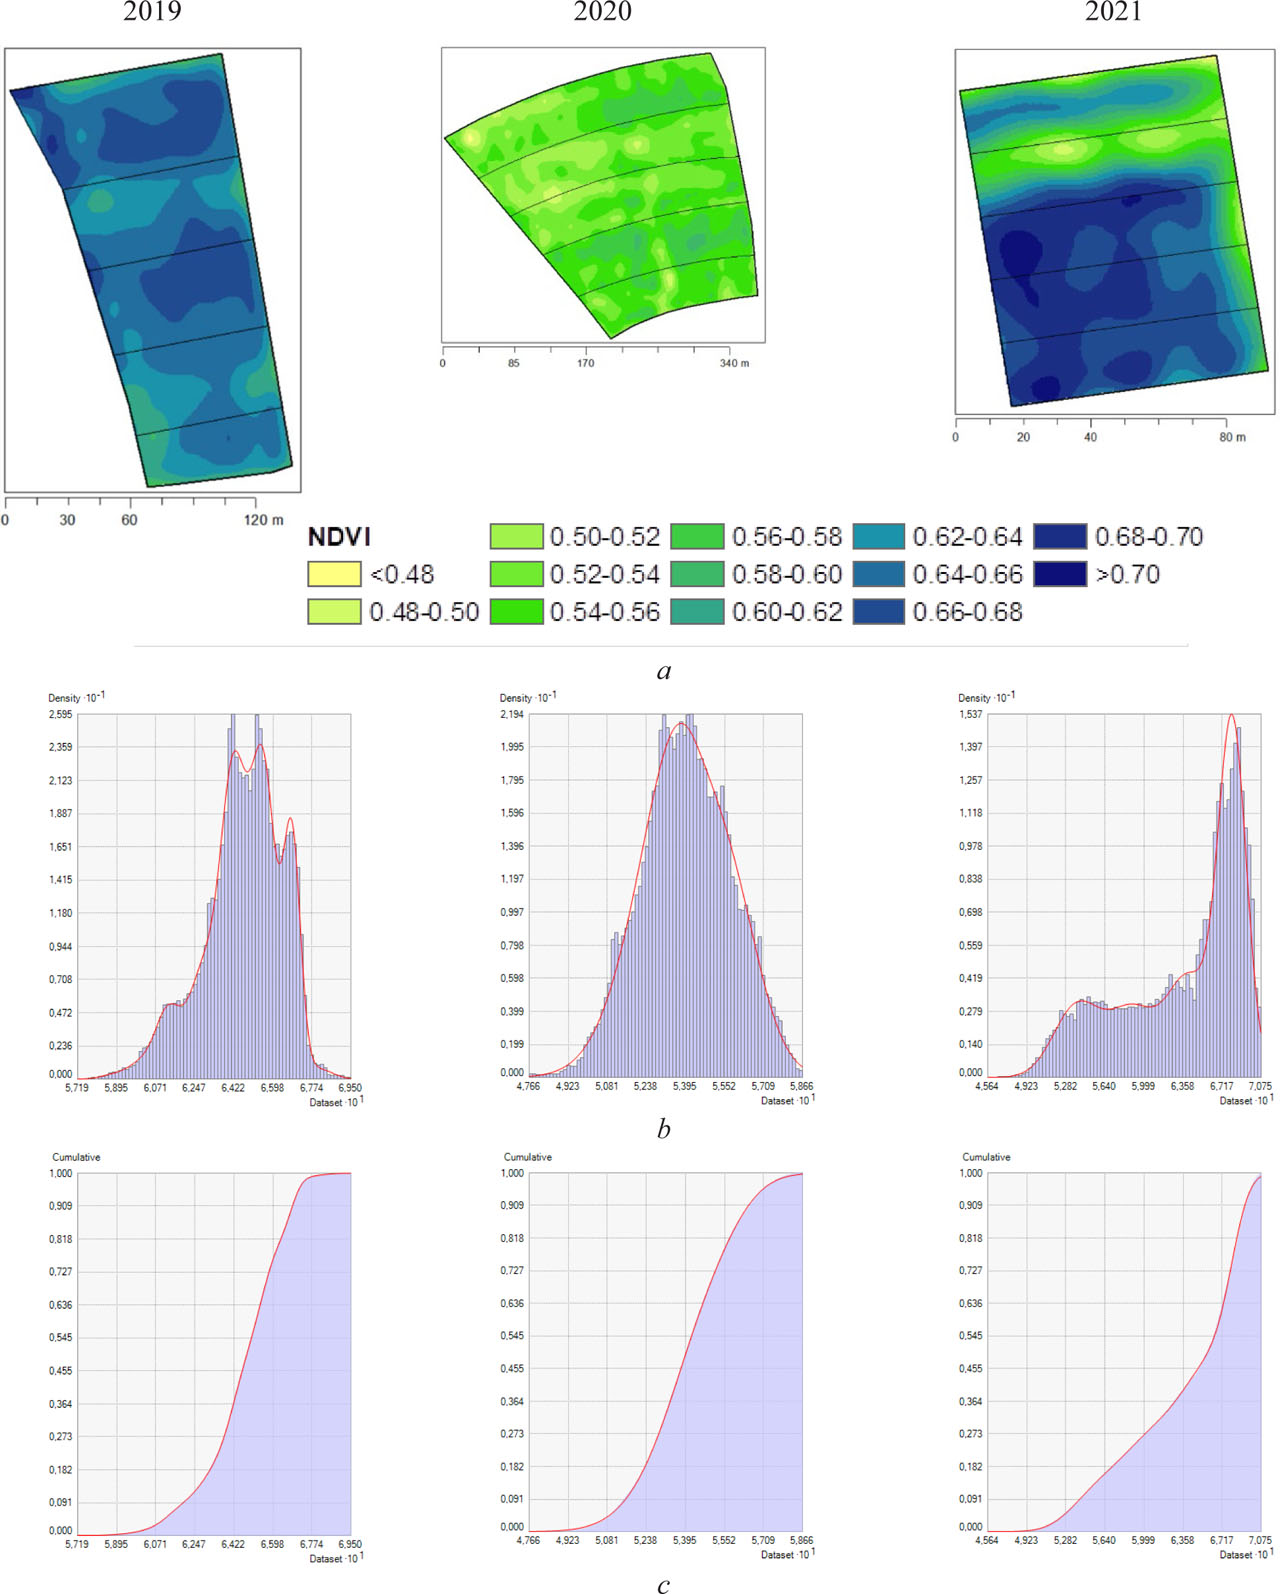
Figure 7.
Spatial differentiation of the generalised values of the NDVI for sunflower hybrids from 2019 to 2021: a – cartograms; b – histogram; c – cumulative curve
Since the vegetation index does not account for genotype-specific characteristics, raster values were normalized relative to the mean index of the respective year in order to refine the relationship between NDVIyear and actual yield performance.
where: NDVIiyear – vegetation index value for a specific research plot of a given hybrid, Aver(NDVIiyear) – average vegetation index value for the research plot in a given year, Aver(CYi) – average productivity of the respective hybrid on the research plot.This made it possible to compare the normalized values with the mean yield of the hybrids and to generate cartograms of spatial yield differentiation (Figure 8). According to the calculations, the average productivity levels were as follows: Oplot – 3.0; 2.01; 3.04 t/ha; Hector – 2.05; 1.65; 2.16; DSL403 – 2.53; 1.88; 2.77; P64HE133 – 2.83; 1.96; 3.02; 8KH477KL – 2.32; 1.71; 2.82 for 2019, 2020, and 2021, respectively.
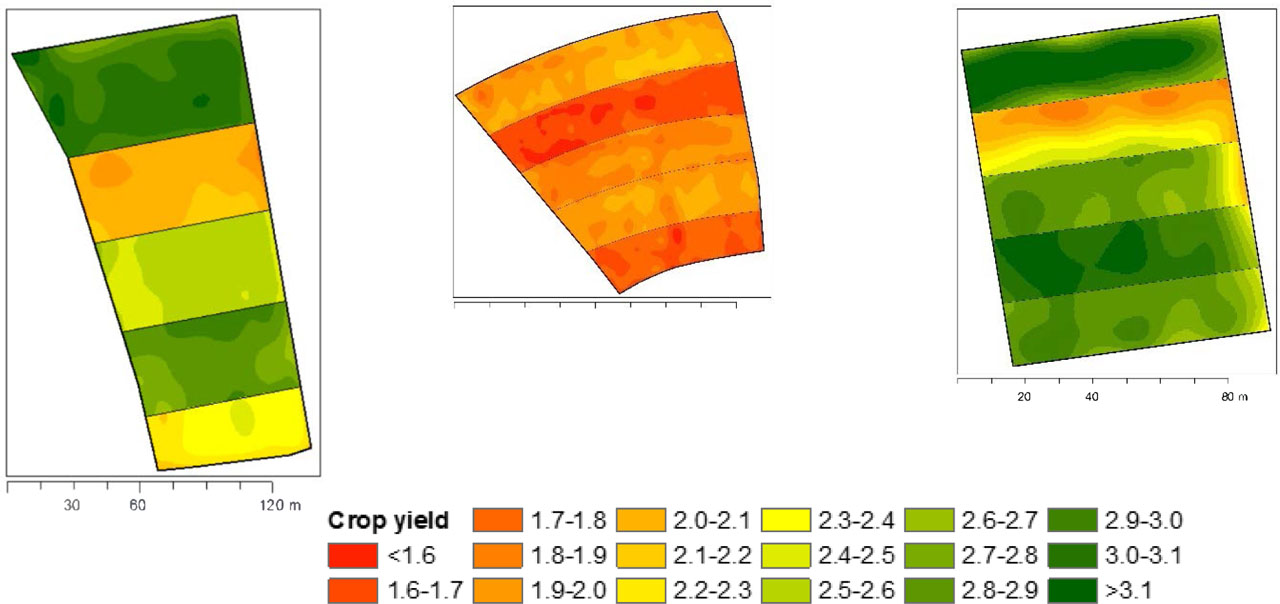
Figure 8.
Cartograms of distribution of the crop yields of sunflower hybrids in 2019–2021
Cartograms and frequency distributions (Figure 9) confirmed that in the moderately wet year 2019, yield ranged from 1.86 to 3.18 t/ha with clear inter-hybrid differences: the lowest values were characteristic of Hector and 8KH477KL, intermediate values of DSL403, and the highest values of Oplot and P64HE133. In the dry year 2020, the cluster structure was preserved, but the overall yield level was minimal, and the distributions demonstrated the formation of two distinct clusters (low-productive and medium-productive), reflecting the dominant influence of water stress. In the wet year 2021, productivity increased and, simultaneously, spatiotemporal variability intensified: Oplot and P64HE133 provided the maximum yields, whereas Hector remained the least productive.
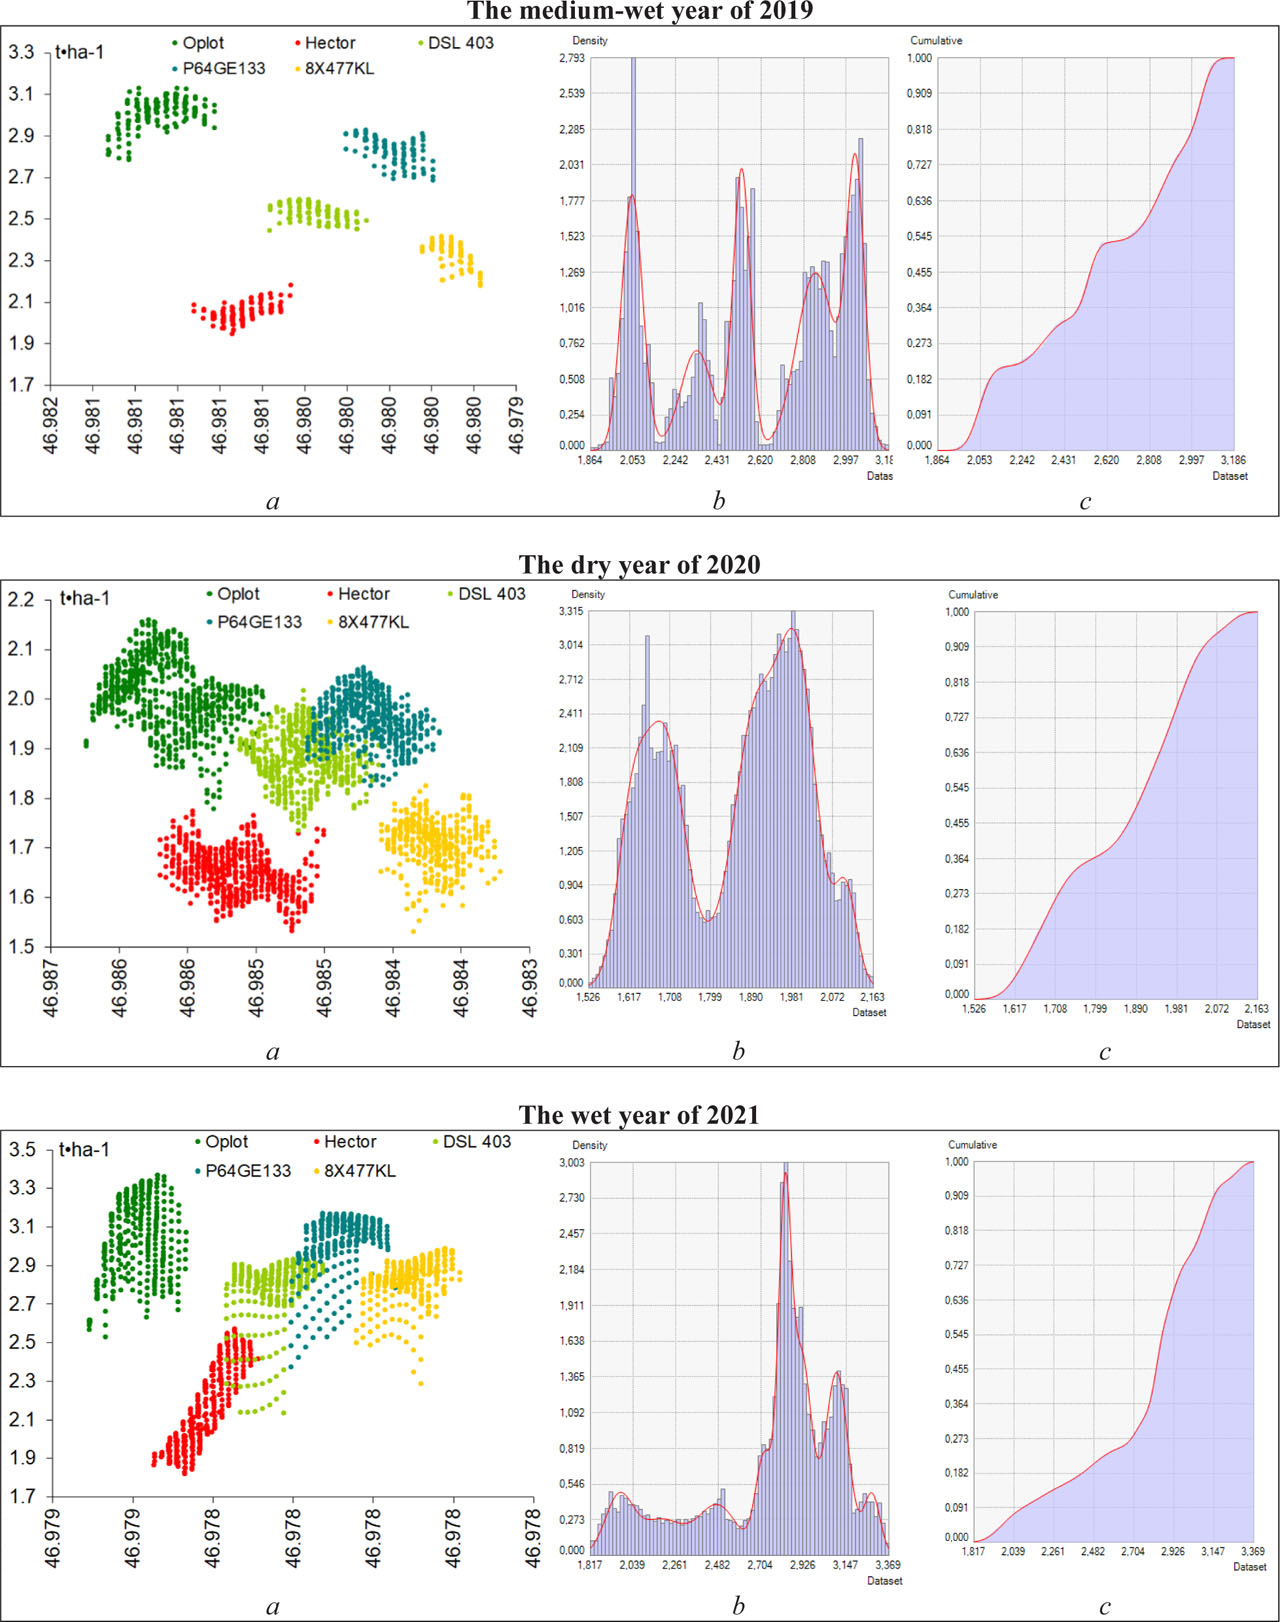
Figure 9.
Spatial differentiation of sunflower hybrid productivity in 2019–2021: a – graph of spatial differentiation; b – histogram; c – cumulative curve
Additionally, the spatial yield distribution in 2019–2021 formed clearly separated clusters by hybrid, reflecting the combination of genotype-specific differences and heterogeneity of conditions within the experimental strip. In 2019, the latitudinal yield gradient for most hybrids was moderate (approximately 0.08–0.15 t/ha), whereas in 2021, the hybrid Hector exhibited a sharply pronounced gradient (up to ≈0.8 t/ha), indicating increased sensitivity of this genotype to local environmental heterogeneity under conditions of sufficient moisture supply.
The results of spatial modeling demonstrated that NDVIyear reflects both interannual and within-field variability of yield; however, its influence is realized in interaction with genotype-specific characteristics and the hydrothermal conditions of the season. To quantitatively differentiate the contributions of the genotype factor (Hybrid), year (Year), and phase-specific NDVI values to yield formation, a three-way analysis of variance (Three-way ANOVA) was performed as the next step.
3.9. Three-way ANOVA of sunflower yield explained by Hybrid, Year and NDVI phase indices
For statistical interpretation of the relationship between sunflower productivity, genotype-specific characteristics of hybrids, contrasting hydrothermal conditions, and crop condition at key phenological stages, a three-way analysis of variance was performed (Table 7). The model included the following factors: Hybrid (A), Year (C) and NDVIphase (D) (BBCH 16-19; 61-67; 79-81).
Table 7.
Three-way ANOVA results for sunflower yield explained by Hybrid, Year and NDVIphase indices (GLM)
| Source of variation | df | SS | MS | F | p | η2 | Partial η2 |
|---|---|---|---|---|---|---|---|
| Hybrid (A) | 4 | 2.98 | 0.745 | 28.04 | <0.0001 | 0.19 | 0.31 |
| Year (C) | 2 | 6.96 | 3.481 | 131.22 | <0.0001 | 0.44 | 0.67 |
| NDVI phase (D) | 2 | 1.84 | 0.920 | 34.67 | <0.0001 | 0.12 | 0.29 |
| A × C | 8 | 0.64 | 0.080 | 3.02 | 0.011 | 0.04 | 0.09 |
| A × D | 8 | 0.51 | 0.064 | 2.41 | 0.031 | 0.03 | 0.07 |
| C × D | 4 | 0.73 | 0.182 | 6.87 | 0.0003 | 0.05 | 0.14 |
| A × C × D | 16 | 0.58 | 0.036 | 1.36 | 0.148 | 0.04 | 0.06 |
| Error | 210 | 5.57 | 0.0265 | – | – | – | – |
| Total | 254 | 19.81 | – | – | – | 1.00 | – |
The results showed that all three main effects were statistically significant (p < 0.001), although their explanatory contributions differed. The largest proportion of variance was explained by the Year factor (η2 = 0.44; partial η2 = 0.67), reflecting the determining role of the water regime in the realization of production potential. The second strongest effect was Hybrid (η2 = 0.19), describing genotype-specific productivity and adaptability. The NDVIphase factor was also significant (η2 = 0.12), indicating phase-specific informativeness of NDVI with respect to final yield.
Significant interactions were observed for Hybrid × Year (p = 0.011), Year × NDVIphase (p = 0.0003), and Hybrid × NDVIphase (p = 0.031), confirming that: 1 – hybrids respond differently to contrasting weather conditions; 2 – the role of phenological stages varies between years; 3 – individual genotypes exhibit different phase-specific sensitivity. The three-way interaction Hybrid × Year × NDVIphase was weaker (p = 0.148), indicating predominance of main effects and two-factor interactions in explaining yield variation.
Consistent with crop physiology, NDVI at the BBCH 61-67 stage had the strongest diagnostic relevance for yield, whereas the index at BBCH 16-19 had a moderate effect, and at BBCH 79-81 the weakest, although still statistically significant. These results provided the statistical basis for developing regression models to forecast yield based on phase-specific NDVI values.
3.10. Relationship Between Yield and NDVI at Key Developmental Stages of Sunflower Hybrids
To quantitatively assess the relationship between satellite-based crop condition indicators and actual productivity, yield was predicted using a three-phase NDVI model (Equation 4). The estimated Ordinary Least Squares (OLS) equations demonstrated substantial interannual variability in the strength of the NDVI–yield relationship. In 2019, the model exhibited low explanatory power (R2 = 0.139; RMSE = 0.114 t/ha; MAPE = 3.30%), indicating a significant contribution of additional factors (spatial heterogeneity, technological and microclimatic effects):
In the dry year 2020, explanatory power increased to a moderate level (R2 = 0.400; RMSE = 0.061 t/ha; MAPE = 2.43%), indicating that under conditions of water deficit, NDVI indices at early and mid-phenological stages more accurately reflected growth limitations that were subsequently translated into yield:
In 2021, the relationship was the strongest (R2 = 0.629; RMSE = 0.086 t/ha; MAPE = 2.32%), with NDVI at the flowering stage (BBCH 61-67) serving as the key predictor:
Testing model transferability across years using the leave-one-year-out approach revealed a sharp decline in prediction accuracy on the test datasets (R2test < 0 in all years; increased RMSE and MAPE – 2019: RMSE = 0.177 t/ha, MAPE = 5.42%, R2test = −1.07; 2020: RMSE = 0.197 t/ha, MAPE = 10.15%, R2test = −9.35; 2021: RMSE = 0.681 t/ha, MAPE = 22.67%, R2test = −39.75), confirming the interannual instability of a “universal” NDVI–yield relationship under contrasting moisture regimes. This substantiates the feasibility of situational forecasting — through year-specific models or explicit inclusion of Year (moisture regime) as a block factor.
At the same time, aggregation of data across all hybrids may mask genotype-specific mechanisms of yield formation, particularly differences in sensitivity to water stress and duration of canopy functioning. Therefore, the next step involved modeling yield separately for each hybrid using the combined 2019–2021 dataset in order to determine the genotype-specific structure of phase-based yield determination.
3.11. Genotype-Specific Yield Modeling Based on Phase-Specific NDVI Indices
Given the interannual instability of universal models, the next step involved the development of genotype-specific regression relationships that account for the biological characteristics of hybrids and the phase-specific formation of yield components. The models were estimated using the combined 2019–2021 dataset separately for each hybrid according to Equation 4.
The obtained parameters demonstrated high explanatory power for all genotypes (Table 8), and error metrics (RMSE, MAE, MAPE) confirmed the practical suitability of phase-specific NDVI as yield predictors within individual hybrids. The structure of the coefficients revealed substantial genotype-specific differences: for P64HE133 and 8KH477KL, early-phase determination (BBCH 16-19) was dominant; for DSL403 and Oplot, the role of the late phase (BBCH 79-80) was enhanced; whereas Hector exhibited a combined response and lower model consistency, corresponding to its reduced ecological plasticity.
Table 8.
Parameters of OLS Models for Forecasting Yield of Sunflower Hybrids Based on Phase-Specific NDVI Indices (Combined Data for 2019–2021)
| Hybrid | β 0 | β1 NDVI16-19 | β2 NDVI61-67 | β3 NDVI79-80 | R2 | RMSE | MAE | MAPE, % |
|---|---|---|---|---|---|---|---|---|
| 8KH477KL | −1.960 | 16.780 | 7.098 | −0.583 | 0.979 | 0.078 | 0.062 | 2.81 |
| DSL403 | −1.363 | 1.454 | 6.067 | 9.598 | 0.972 | 0.072 | 0.052 | 2.33 |
| Hector | −0.609 | 14.556 | 4.232 | −2.925 | 0.919 | 0.076 | 0.051 | 2.60 |
| Oplot | −0.106 | 9.787 | 0.822 | 16.552 | 0.952 | 0.113 | 0.092 | 3.90 |
| P64HE133 | −1.547 | 18.034 | 5.034 | 6.533 | 0.978 | 0.076 | 0.056 | 2.44 |
At the same time, aggregation of the combined dataset using the hybrid Oplot as a reference made it possible to construct an integrated universal relationship between NDVI and yield (Figure 10). Despite a high overall level of approximation (r2 = 0.952), year-specific disaggregation revealed substantial variability in predictive reliability: from weak in 2020 (r2 = 0.309) to high in 2021 (r2 = 0.835), reflecting modification of the “NDVI–yield” relationship under the influence of the hydrothermal regime.
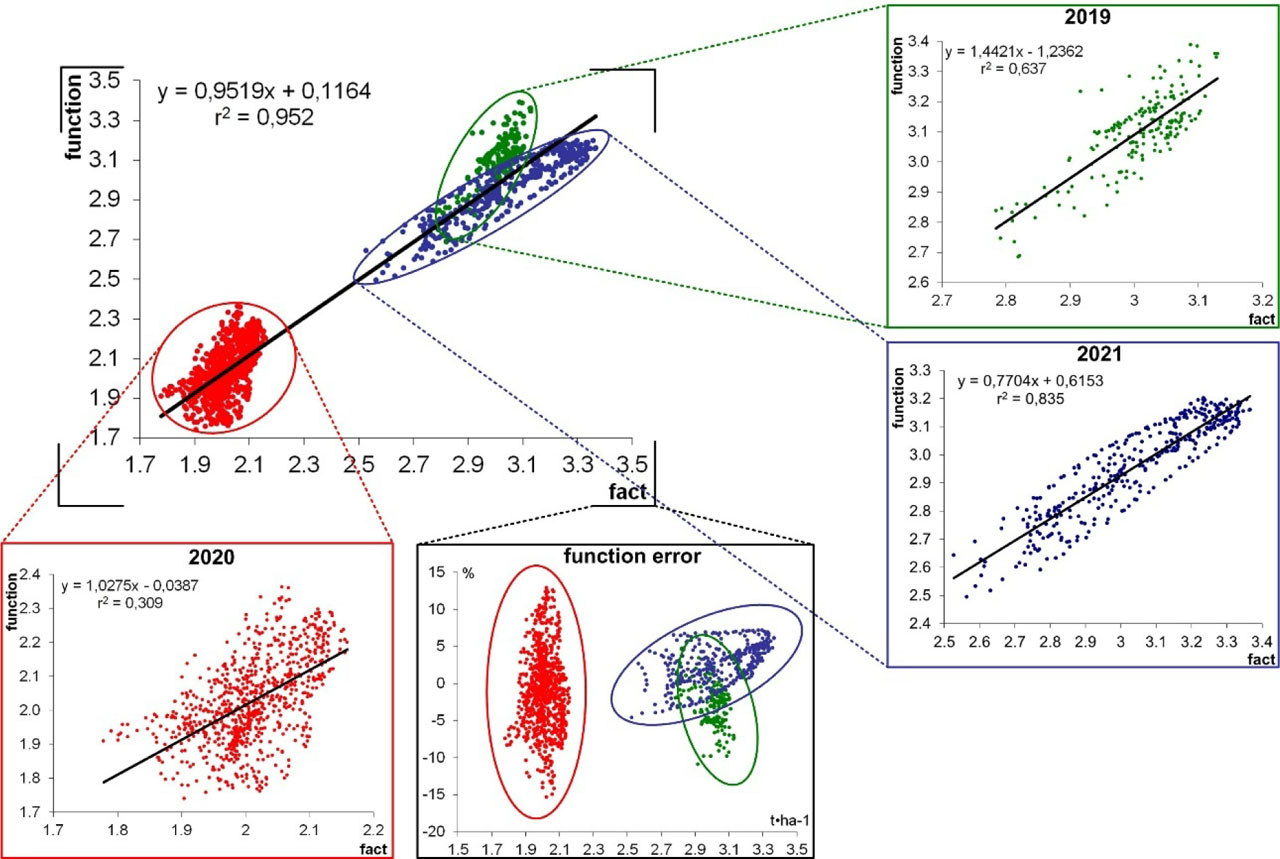
Figure 10.
Level of approximation of the universal yield forecasting model for the sunflower hybrid Oplot based on data from 2019–2021
These results led to the need for a multilevel approach in which parameterization is performed not only by genotype but also by year-type moisture regime (dry-moderately wet-wet). The following subsection is devoted to this approach.
3.12. Differentiated Predictive Yield Models Considering Year-Type Moisture Regime (2019–2021)
For situational yield forecasting, an integrated remote sensing predictor was constructed as a generalized indicator of seasonal vegetation activity with weights assigned to critical phases of water and nutrient uptake according to Equation 2. Subsequently, for each year-type moisture regime (2019 – moderately wet; 2020 – dry; 2021 – wet) and for each hybrid, linear predictive relationships were estimated:
where: Ŷh,year is the predicted yield (t/ha), ah,year is the intercept, and bh,year is the sensitivity coefficient of yield to the integrated NDVIyear. index.The obtained models demonstrated systematic interannual variability of the parameter b, reflecting changes in the functional relationship “crop condition based on NDVI–productivity” depending on the hydrothermal regime of the season. In the dry year 2020, reduced explanatory power was observed for some hybrids (particularly 8KH477KL and P64HE133), whereas in the wet year 2021, higher regression consistency and more stable parameter estimates were recorded for most genotypes (Table 9).
Table 9.
Parameters of OLS Models for Forecasting Yield of Sunflower Hybrids Based on the Integrated NDVIyear Index (Differentiated by Year-Type Moisture Regime, 2019–2021)
| Year | Hybrid | n | a | b | R2 | RMSE | MAE | MAPE, % |
|---|---|---|---|---|---|---|---|---|
| 2019 | 8KH477KL | 74 | 0.402 | 6.346 | 0.973 | 0.010 | 0.008 | 0.34 |
| DSL403 | 126 | 0.506 | 6.535 | 0.832 | 0.016 | 0.013 | 0.50 | |
| Hector | 127 | 0.281 | 5.838 | 0.857 | 0.016 | 0.012 | 0.58 | |
| Oplot | 183 | 0.402 | 8.415 | 0.832 | 0.030 | 0.023 | 0.76 | |
| P64HE133 | 112 | 0.450 | 7.816 | 0.931 | 0.017 | 0.014 | 0.50 | |
| 2020 | 8KH477KL | 417 | 0.430 | 4.645 | 0.712 | 0.025 | 0.020 | 1.19 |
| DSL403 | 618 | 0.310 | 5.614 | 0.859 | 0.019 | 0.014 | 0.72 | |
| Hector | 698 | 0.299 | 4.905 | 0.848 | 0.017 | 0.012 | 0.73 | |
| Oplot | 818 | 0.257 | 6.430 | 0.899 | 0.022 | 0.018 | 0.87 | |
| P64HE133 | 578 | 0.434 | 5.377 | 0.689 | 0.027 | 0.021 | 1.08 | |
| 2021 | 8KH477KL | 363 | 0.705 | 6.544 | 0.833 | 0.043 | 0.035 | 1.26 |
| DSL403 | 364 | 0.219 | 7.791 | 0.978 | 0.023 | 0.013 | 0.45 | |
| Hector | 363 | 0.518 | 5.853 | 0.986 | 0.024 | 0.017 | 0.78 | |
| Oplot | 361 | 0.345 | 9.943 | 0.969 | 0.035 | 0.028 | 0.94 | |
| P64HE133 | 364 | 0.166 | 8.679 | 0.966 | 0.026 | 0.015 | 0.51 |
Overall, R2 values ranged from 0.689 to 0.986, while error metrics remained low (RMSE ≤ 0.043 t/ha; MAPE predominantly < 1.3%), confirming the high predictive suitability of the integrated NDVIyear index in year-specific models. Thus, the year-type moisture regime acts as a key modifier of the relationship between integrated NDVI and yield, and the differentiated approach provides a more accurate interpretation of remote sensing-based productivity indicators in dry, moderately wet, and wet seasons.
The transition from universal to genotype- and year-specific models not only increases the reliability of remote yield forecasting for sunflower but also establishes a basis for practical implementation of such equations in operational agromonitoring systems (Geographic Information System/Remote Sensing), differentiated crop management, and adaptive optimization of agronomic technologies.
The obtained results demonstrate that sunflower productivity in the steppe zone is formed as a consequence of the interaction among three key components: the hydrothermal regime of the year, genotype-specific hybrid plasticity, and the phase-specific dynamics of canopy photosynthetic activity with the effect of plant growth regulator application.
4. DISCUSSION
The results of the integrated field, remote sensing, and statistical analysis provide a comprehensive understanding of the mechanisms underlying yield formation in sunflower hybrids under climatic variability in the steppe zone and confirm the feasibility of integrating satellite monitoring into yield assessment and forecasting systems. Such synergy of field-based, remote sensing, and modeling approaches is regarded by contemporary researchers as one of the most promising directions for the digitalization of agricultural production and the development of precision farming [Guo et al. 2019; Hu et al. 2024; Allu, Mesapam 2025; Vesterdal et al. 2026].
Climatic analysis demonstrated that the water regime is the primary limiting factor of sunflower productivity, whereas temperature plays a modifying role. Despite interannual differences in temperature background, it was the deficit or excess of atmospheric and soil moisture that determined photosynthetic intensity, duration of canopy functioning, and the degree of realization of hybrid genetic potential. Similar patterns have been identified for oilseed crops in arid European agro-landscapes [Flagella et al. 2002] and for field crops in general under conditions of climatic transformation [Egerer et al. 2023]. The sensitivity of vegetation to hydrothermal variability has also been confirmed through spatiotemporal analysis of NDVI dynamics [Karuppiah et al. 2026]. The dry year 2020 was characterized not only by a low total amount of precipitation but also by its extremely uneven distribution, resulting in severe water stress and weak productive response even to short-term heavy rainfall events. In contrast, in the wet year 2021, stable moisture supply during critical phenological stages led to prolonged photosynthetic activity and maximum realization of yield potential. Thus, not only the absolute amount of precipitation but also its synchronization with phases of reproductive organ formation was decisive, fully consistent with the concept of “critical growth windows” in crop science [Sadras et al. 2015].
Remote monitoring using NDVI confirmed the high informativeness of this index for assessing the actual physiological condition of crops. The spatiotemporal dynamics of NDVI adequately reflected initial plant development conditions, hybrid responses to drought or optimal hydrothermal regimes, and the effectiveness of technological interventions. Similar findings have been reported in studies of cereal and industrial crops, where NDVI demonstrates a strong relationship with biomass and yield [Balaghi et al. 2008; Lunetta et al. 2010; Roznik et al. 2022]. At the same time, recent research emphasizes that the informativeness of spectral indices depends on phenological stage, canopy structure, and pigment composition [Jin et al. 2026]. This supports the feasibility of a phase-oriented approach to NDVI interpretation and the use of integrated seasonal indicators. Additionally, the application of advanced vegetation segmentation algorithms based on Sentinel-2 data enhances the accuracy of crop delineation and spatial condition analysis [Ezzaher et al. 2026].
A clearly expressed genotype-specific response of hybrids to contrasting moisture conditions was identified. The hybrids Oplot and P64HE133 exhibited high ecological plasticity and consistently formed higher yields across years, whereas Hector proved more sensitive to drought stress. DSL403 and 8KH477KL occupied intermediate positions. Such differentiation corresponds to the concept of genotype × environment interaction widely described in crop physiology [Des Marais et al. 2013; Fu, Wang 2023]. The obtained results are also consistent with modern genotype-specific yield modeling approaches, where predictive accuracy improves when genetic differentiation of responses is taken into account [Ansarifar et al. 2021; Sapkota et al. 2025].
Foliar application of multifunctional plant growth regulators generally had a positive effect on productivity; however, its efficiency significantly depended on the hydrothermal regime. Under sufficient moisture supply, regulators enhanced photosynthetic activity and prolonged canopy functioning, in agreement with studies on stimulation of assimilatory processes [Domaratskiy 2021; Domaratskiy et al. 2022]. Under drought conditions, their effect was limited, which can be explained by physiological constraints of metabolism under water deficit. Comparative analysis indicated higher efficiency of Helafit Combi relative to Architect™, which may be associated with the biostimulant mechanism of biological products and their ability to activate adaptive plant responses under stress conditions [Fu, Wang 2023; Egerer et al. 2023].
Phenological analysis confirmed the leading role of the inflorescence emergence and flowering stages in yield determination. These stages correspond to maximum water and nutrient uptake, consistent with classical concepts of critical yield formation periods [Flagella et al. 2002; Sadras et al. 2015]. The high diagnostic value of NDVI at the flowering stage has also been confirmed in satellite-based crop productivity studies [Guo et al. 2019; Jin et al. 2026].
Spatial analysis showed that the integrated NDVI_year index adequately reflects within-field yield variability. Similar patterns have been reported in high-resolution yield mapping and data fusion studies [Marino 2023; Allu, Mesapam 2025]. In years with severe water stress, spatial heterogeneity was partially smoothed, whereas under favorable moisture conditions it intensified.
Three-way ANOVA quantitatively confirmed the dominant role of the year of cultivation as an integrated hydrothermal factor, consistent with long-term crop productivity models [Park et al. 2005]. Regression analysis of the NDVI–yield relationship demonstrated that its strength varies among years, which is also observed in modern satellite-based and machine learning yield models [Ansarifar et al. 2021; Beyer et al. 2023; Sapkota et al. 2025]. The highest explanatory power of the models was observed in the wet year, confirming greater stability of spectral-production relationships under optimal moisture conditions.
The transition to genotype-specific models substantially improved forecasting accuracy, reflecting the existence of different yield formation strategies and corresponding to contemporary approaches in adaptive precision agriculture [Hu et al. 2024; Hasanli et al. 2026].
In summary, the water regime acts as the key driver of sunflower yield variation, NDVI serves as a reliable integral productivity indicator, and its informativeness has a pronounced phase-specific and genotype-dependent character. Integration of field experiments, Sentinel-2 satellite data, advanced spectral analysis algorithms, and multilevel statistical modeling provides a robust basis for situational yield forecasting and adaptive management of the sunflower production process under conditions of climatic variability.
5. CONCLUSIONS
The conducted study enabled a comprehensive assessment of the patterns of yield formation in sunflower hybrids under climatic variability in the steppe zone of Ukraine based on the integration of field experiments, satellite monitoring, and statistical modeling. It was established that the hydrothermal regime of the study years was characterized by significant contrast, generating different levels of environmental stress for the crops. The water factor acted as the dominant limiter of yield, whereas the temperature regime modified transpiration intensity, photosynthesis, and the duration of canopy functioning. The most unfavorable conditions occurred in the dry year 2020, while in the wet year 2021 optimal prerequisites were formed for prolonged photosynthetic activity and maximum realization of the genetic potential of the hybrids.
Satellite monitoring based on Sentinel-2 data confirmed the high informativeness of the Normalized Difference Vegetation Index (NDVI) as an integral indicator of crop condition. The spatiotemporal dynamics of the index adequately reflected plant responses to the water regime, temperature anomalies, and agronomic practices. NDVI demonstrated the highest explanatory power with respect to yield during the flowering stage (BBCH 61-67), which is biologically consistent with the leading role of this period in the formation of head productivity components.
A pronounced genotype-specific differentiation in yield formation was identified. The hybrids Oplot and P64HE133 exhibited high ecological plasticity and stable productivity under different moisture conditions; DSL403 and 8KH477KL occupied intermediate positions; Hector showed increased sensitivity to drought stress. The effectiveness of multifunctional plant growth regulators depended on hydrothermal conditions during the growing season. Under sufficient moisture supply, foliar treatments enhanced photosynthetic activity and prolonged canopy functioning, with the biological regulator Helafit Combi demonstrating higher efficiency compared to the chemical product Architect™.
Phase-specific analysis of water and nutrient uptake showed that the critical periods of yield formation are inflorescence emergence and flowering, during which the main productivity components are determined. Spatial modeling confirmed that integral NDVIyear values reliably reflect within-field and interannual yield variability, forming distinct productivity clusters according to genotype and moisture conditions.
The results of the three-way analysis of variance indicated that the largest proportion of yield variation is explained by the Year factor, integrating the hydrothermal regime of the season. The Hybrid and NDVIphase factors and their interactions were also significant, confirming the multifactorial nature of sunflower productivity formation.
Regression modeling showed that universal “NDVI–yield” relationships have limited interannual transferability. In contrast, genotype-specific models demonstrated high accuracy (R2 above 0.90) and revealed different yield formation strategies – early-phase, late-phase, and combined. Further differentiation of models by year-type moisture regime increased their predictive suitability even more (R2 up to 0.98; minimal prediction errors), confirming the feasibility of a situational approach to remote yield forecasting.
The integration of NDVI-based satellite indicators, GIS/RS technologies, and statistical modeling provides a robust toolkit for assessing and forecasting sunflower yield. The highest reliability is achieved through the combination of genotype- and year-specific model parameterization with consideration of the phase-specific dynamics of crop development, forming a scientific basis for adaptive management of agrocenoses under conditions of climatic variability.