
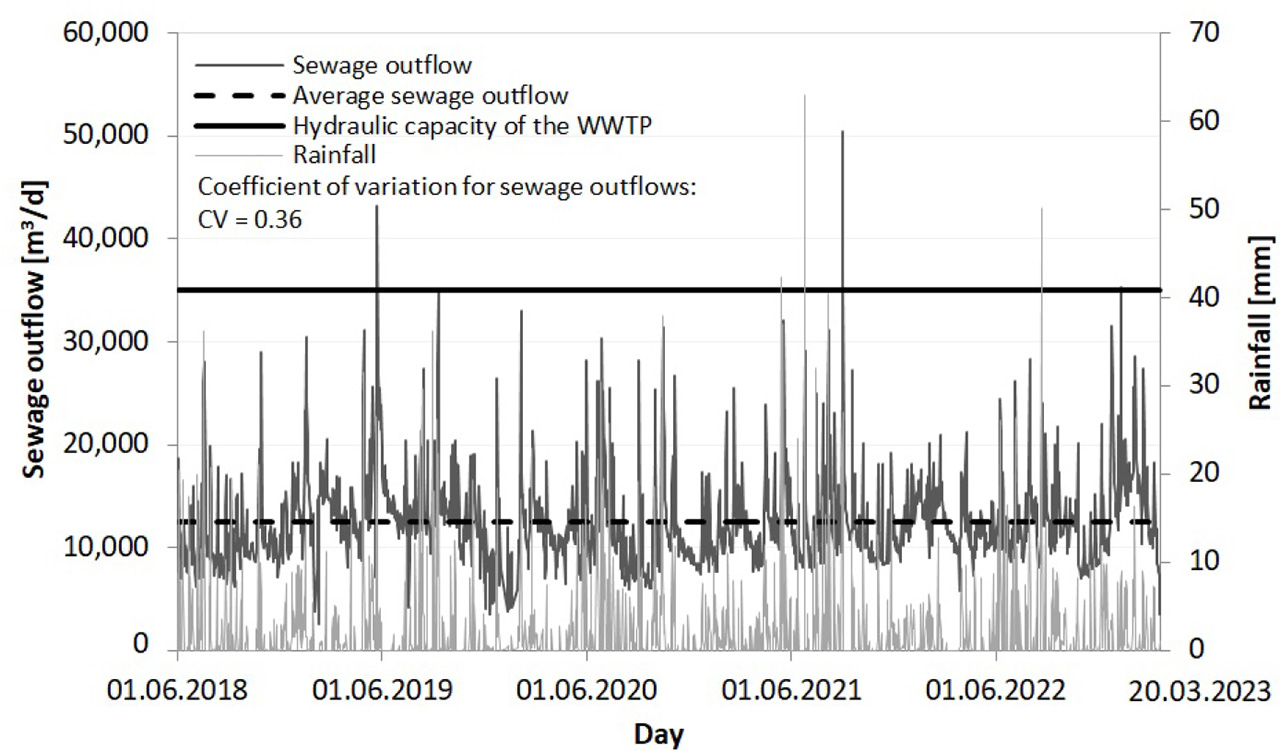
Figure 1.
Daily sewage outflows from the WWTP and daily rainfalls in the period 2018–2023
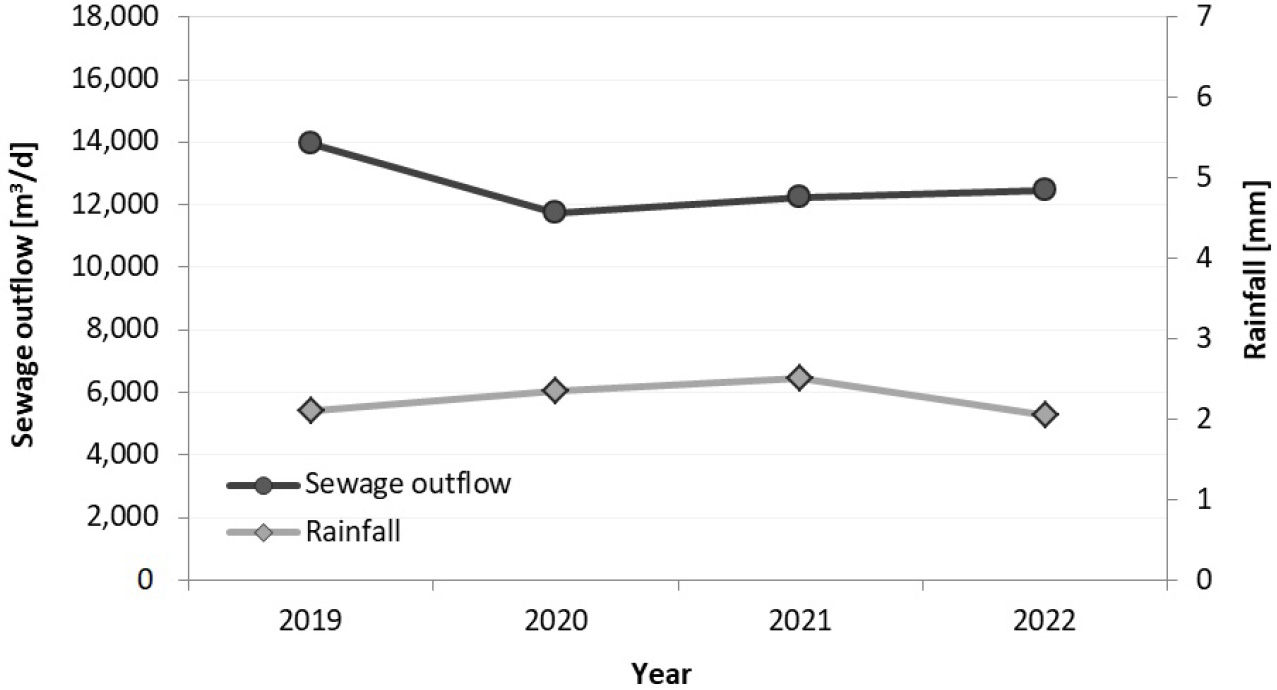
Figure 2.
Average daily sewage outflows from the WWTP and average daily rainfalls in particular years of the period 2019–2022
Table 1.
Descriptive statistics for daily sewage outflows in particular years during the period 2019–2022
| Parameter | Year | ||||
|---|---|---|---|---|---|
| 2019 | 2020 | 2021 | 2022 | ||
| Min | [m3/d] | 2,520 | 3,820 | 7,630 | 5,760 |
| Max | 43,150 | 32,970 | 50,440 | 31,590 | |
| Avg | 13,969 | 11,716 | 12,250 | 12,438 | |
| S | 4,783 | 4,626 | 4,520 | 3,572 | |
| CV | [−] | 0.34 | 0.39 | 0.37 | 0.29 |
[i] where: Min = minimum, Max = maximum, Avg = average, S = standard deviation, and CV = coefficient of variation
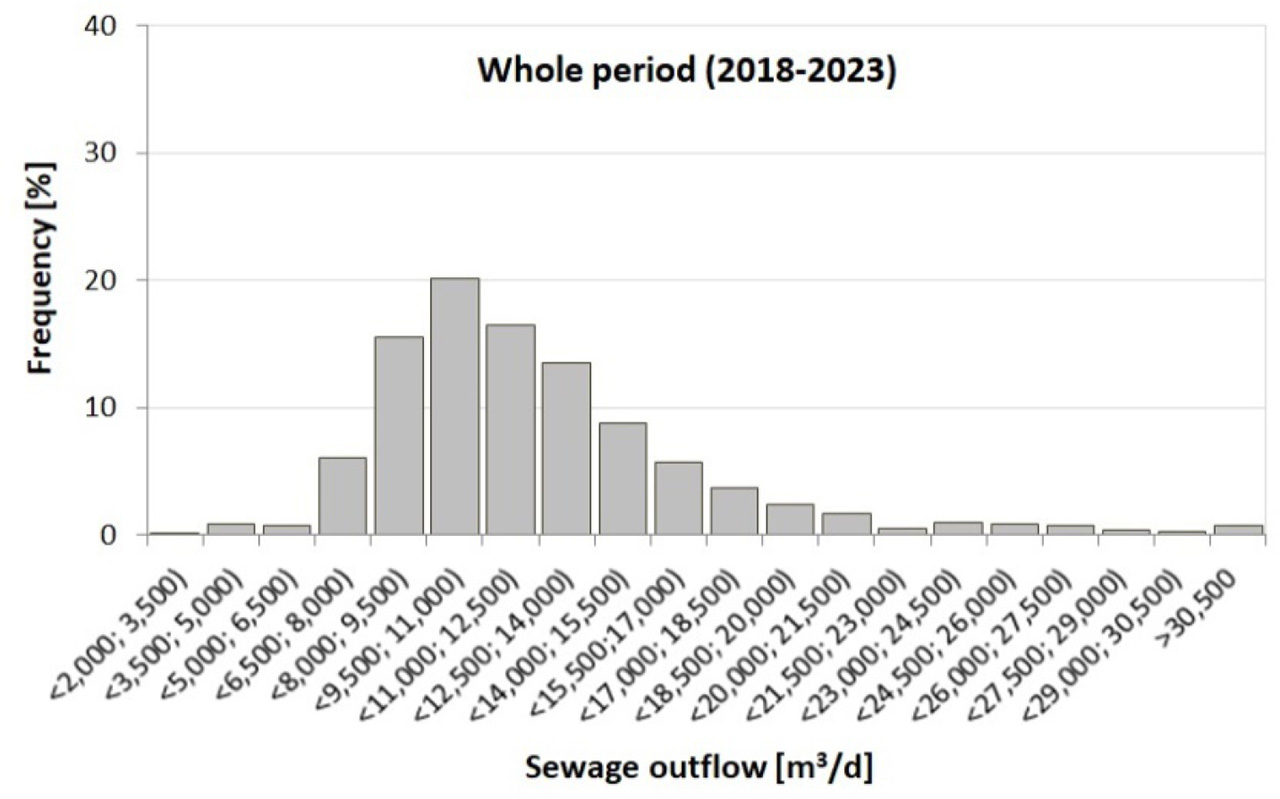
Figure 3.
Frequency of daily sewage outflows at specific magnitudes from the WWTP in the period 2018–2023
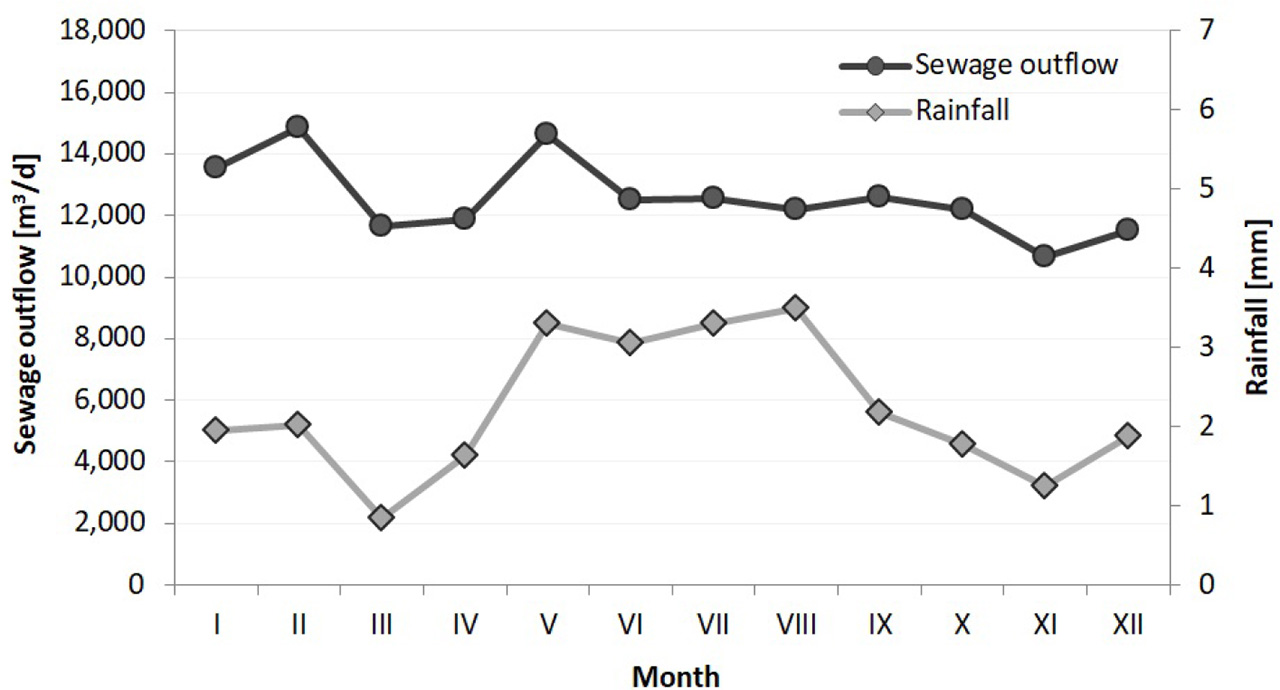
Figure 4.
Average daily sewage outflows from the WWTP and average daily rainfalls in specific months during the period 2018–2023
Table 2.
Descriptive statistics for daily sewage outflows in particular months of the period 2018–2023
| Parameter | Month | ||||||||||||
|---|---|---|---|---|---|---|---|---|---|---|---|---|---|
| I | II | III | IV | V | VI | VII | VIII | IX | X | XI | XII | ||
| Min | [m3/d] | 3,750 | 2,520 | 3,550 | 6,470 | 6,870 | 7,010 | 4,240 | 5,870 | 6,050 | 7,050 | 6,600 | 3,540 |
| Max | 35,260 | 32,970 | 18,430 | 31,090 | 43,150 | 30,320 | 28,370 | 50,440 | 35,430 | 31,350 | 26,670 | 31,590 | |
| Avg | 13,546 | 14,856 | 11,631 | 11,890 | 14,635 | 12,525 | 12,543 | 12,185 | 12,603 | 12,184 | 10,658 | 11,505 | |
| S | 4,591 | 4,232 | 2,332 | 3,725 | 5,768 | 4,263 | 4,343 | 5,403 | 4,925 | 4,047 | 2,916 | 4,318 | |
| CV | [−] | 0.34 | 0.28 | 0.20 | 0.31 | 0.39 | 0.34 | 0.35 | 0.44 | 0.39 | 0.33 | 0.27 | 0.38 |
[i] where: Min = minimum, Max = maximum, Avg = average, S = standard deviation, and CV = coefficient of variation
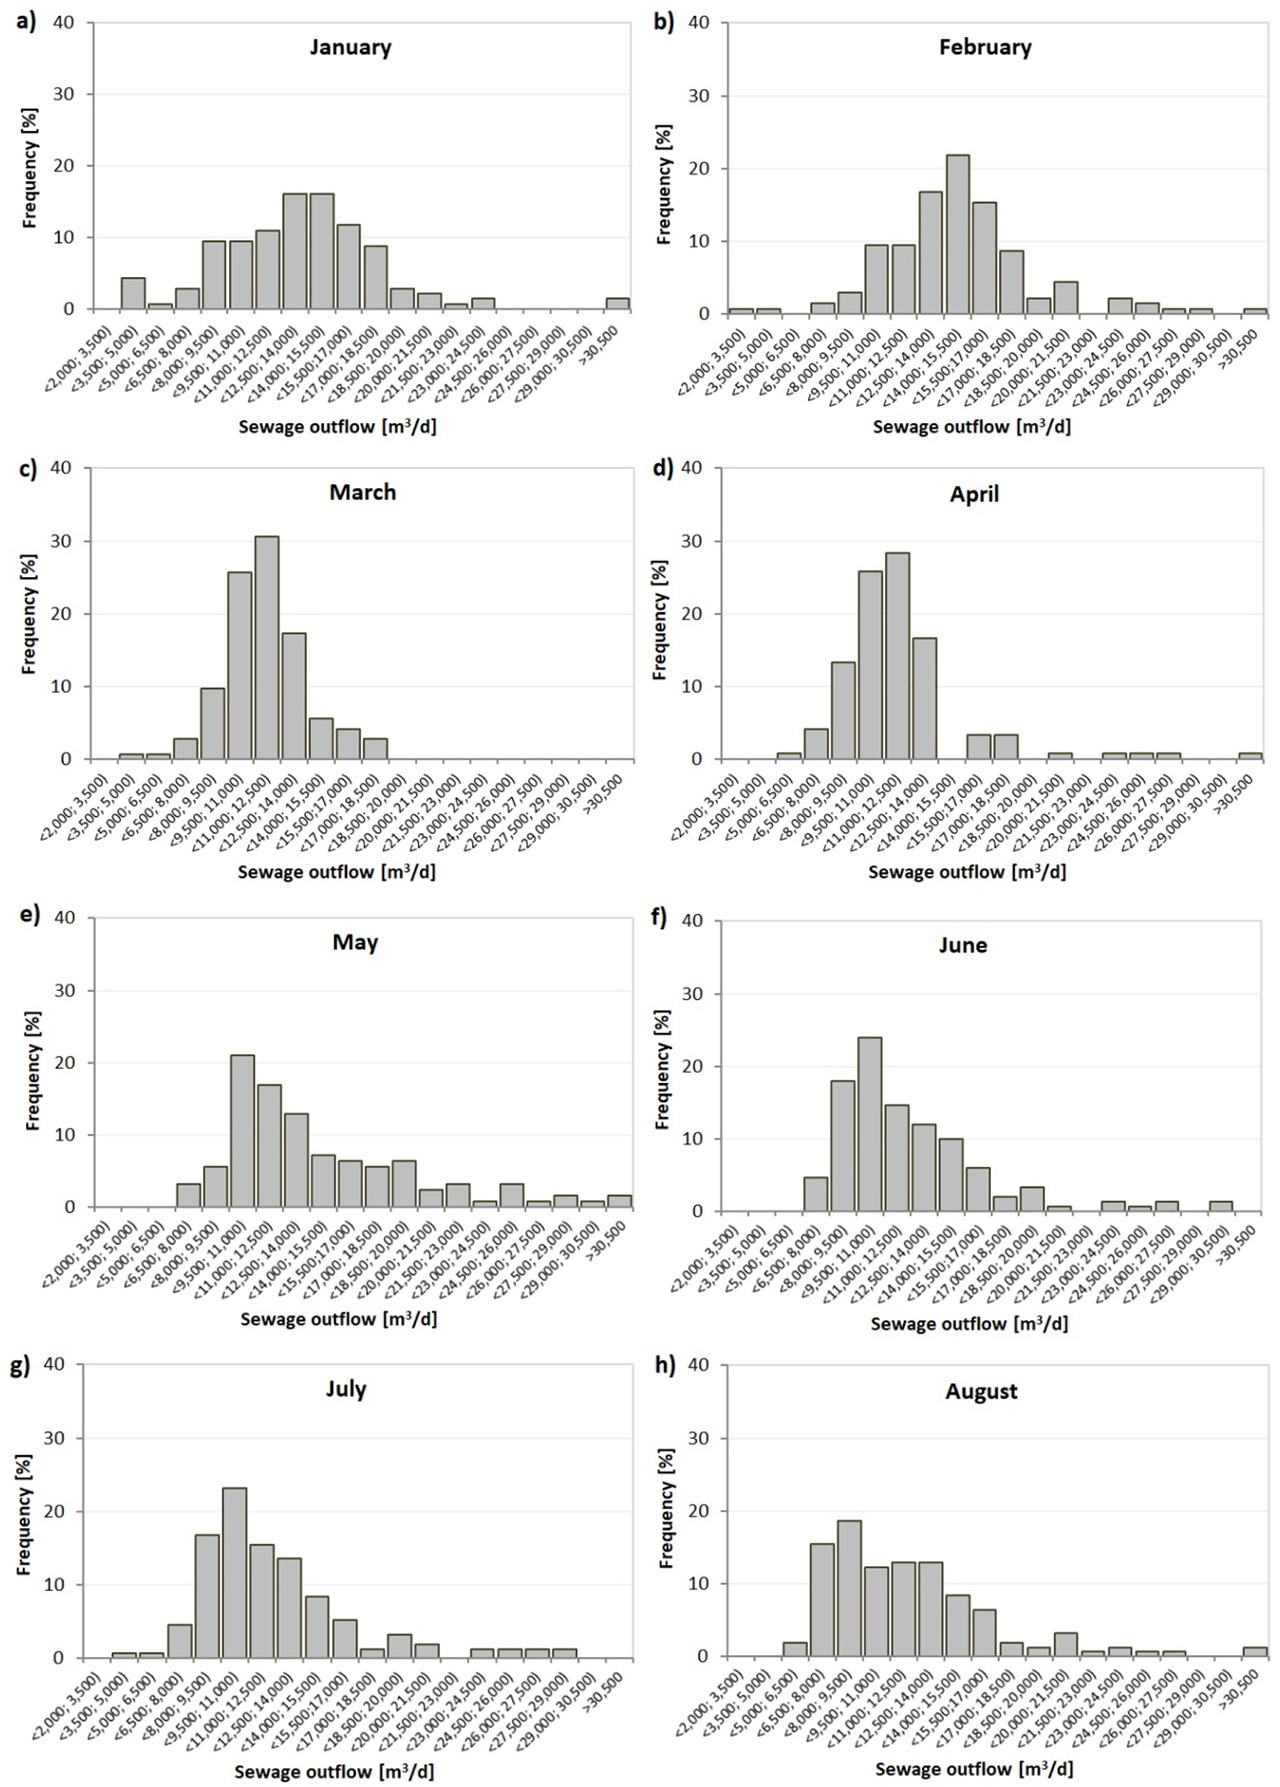
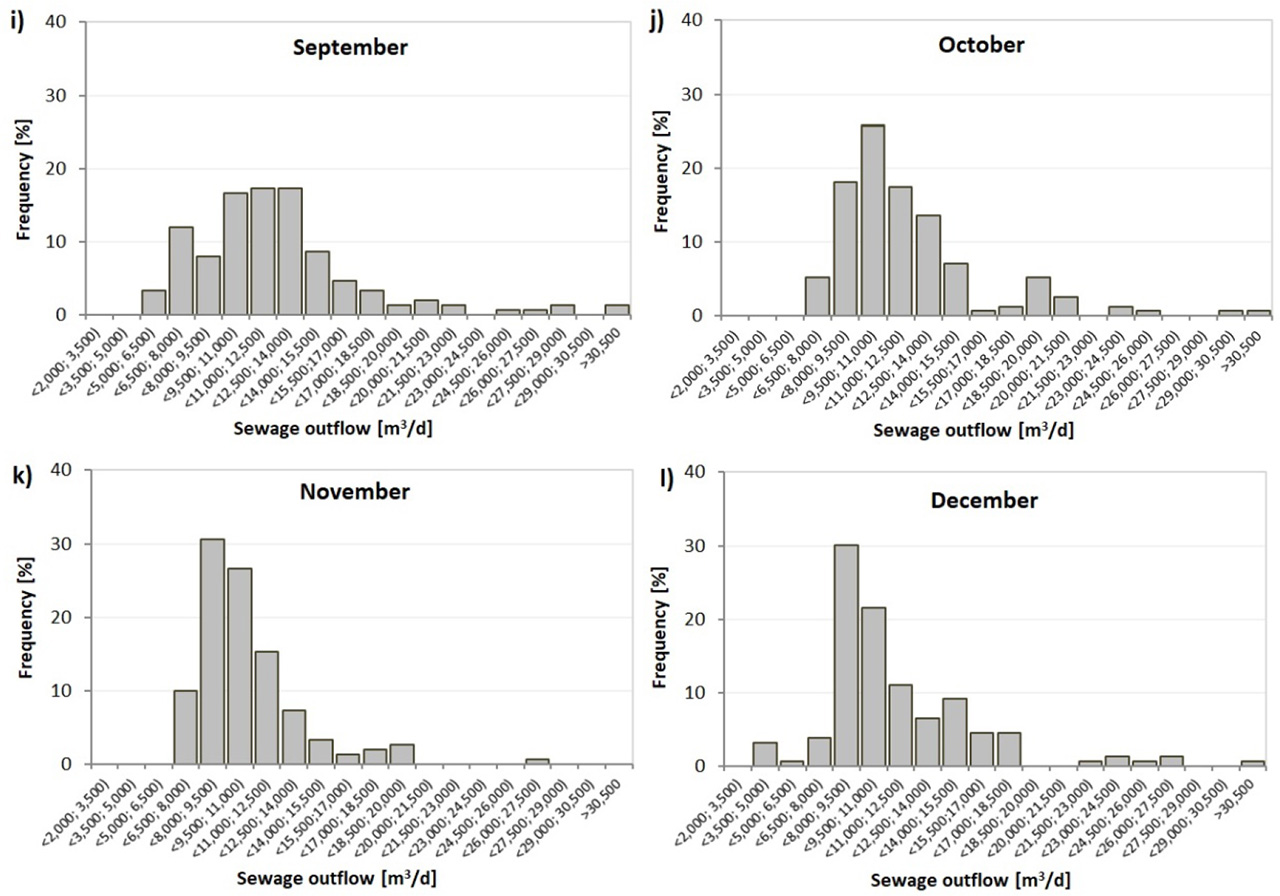
Figure 5.
Frequency of daily sewage outflows at specific magnitudes from the WWTP in specific months during the period 2018–2023
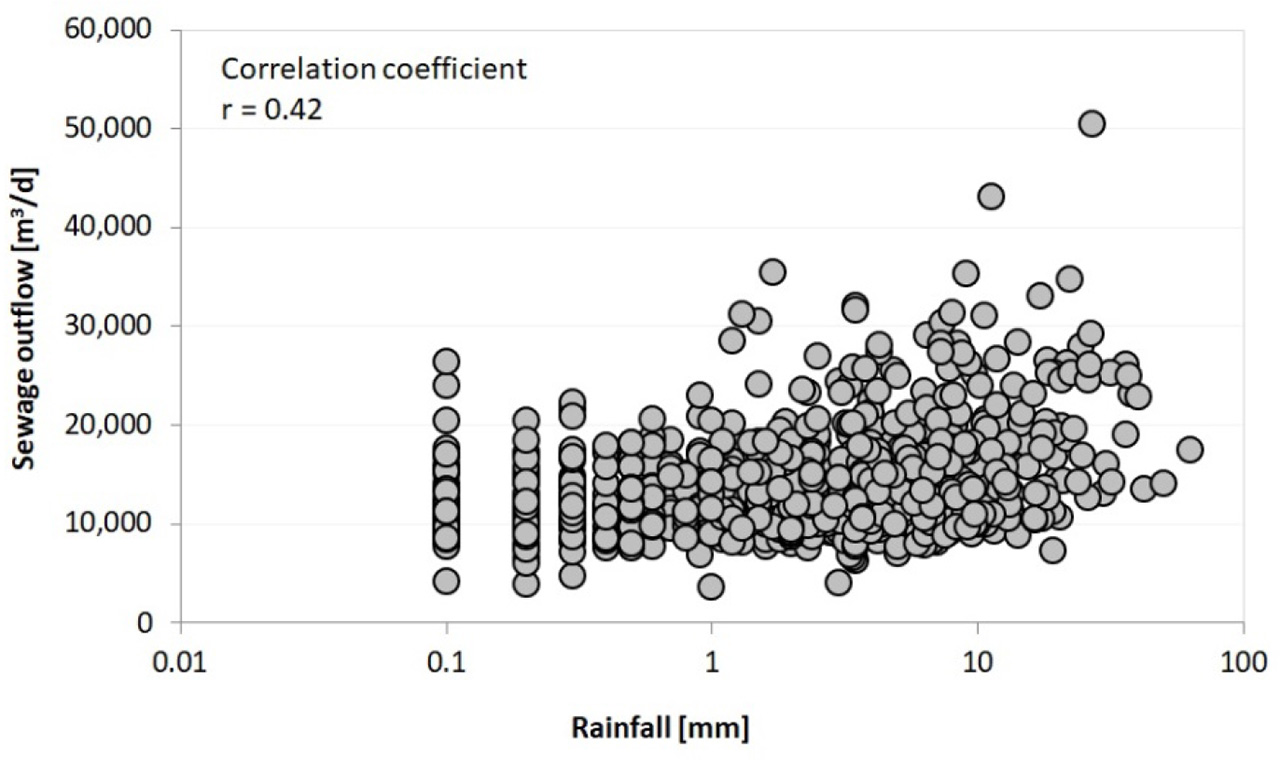
Figure 6.
Dependence between daily rainfalls and daily sewage outflows from the WWTP in the period 2018–2023
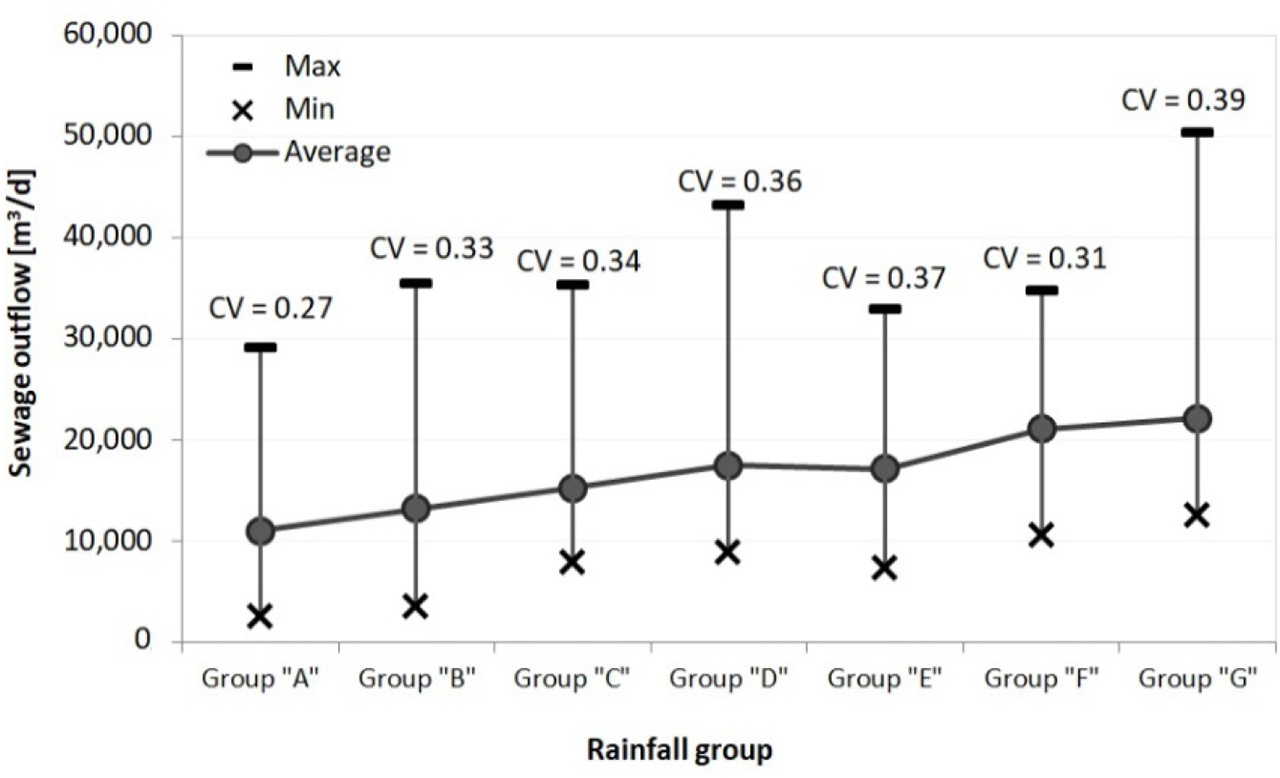
Figure 7.
Dependence of daily sewage outflows from the WWTP on rainfall intensities