
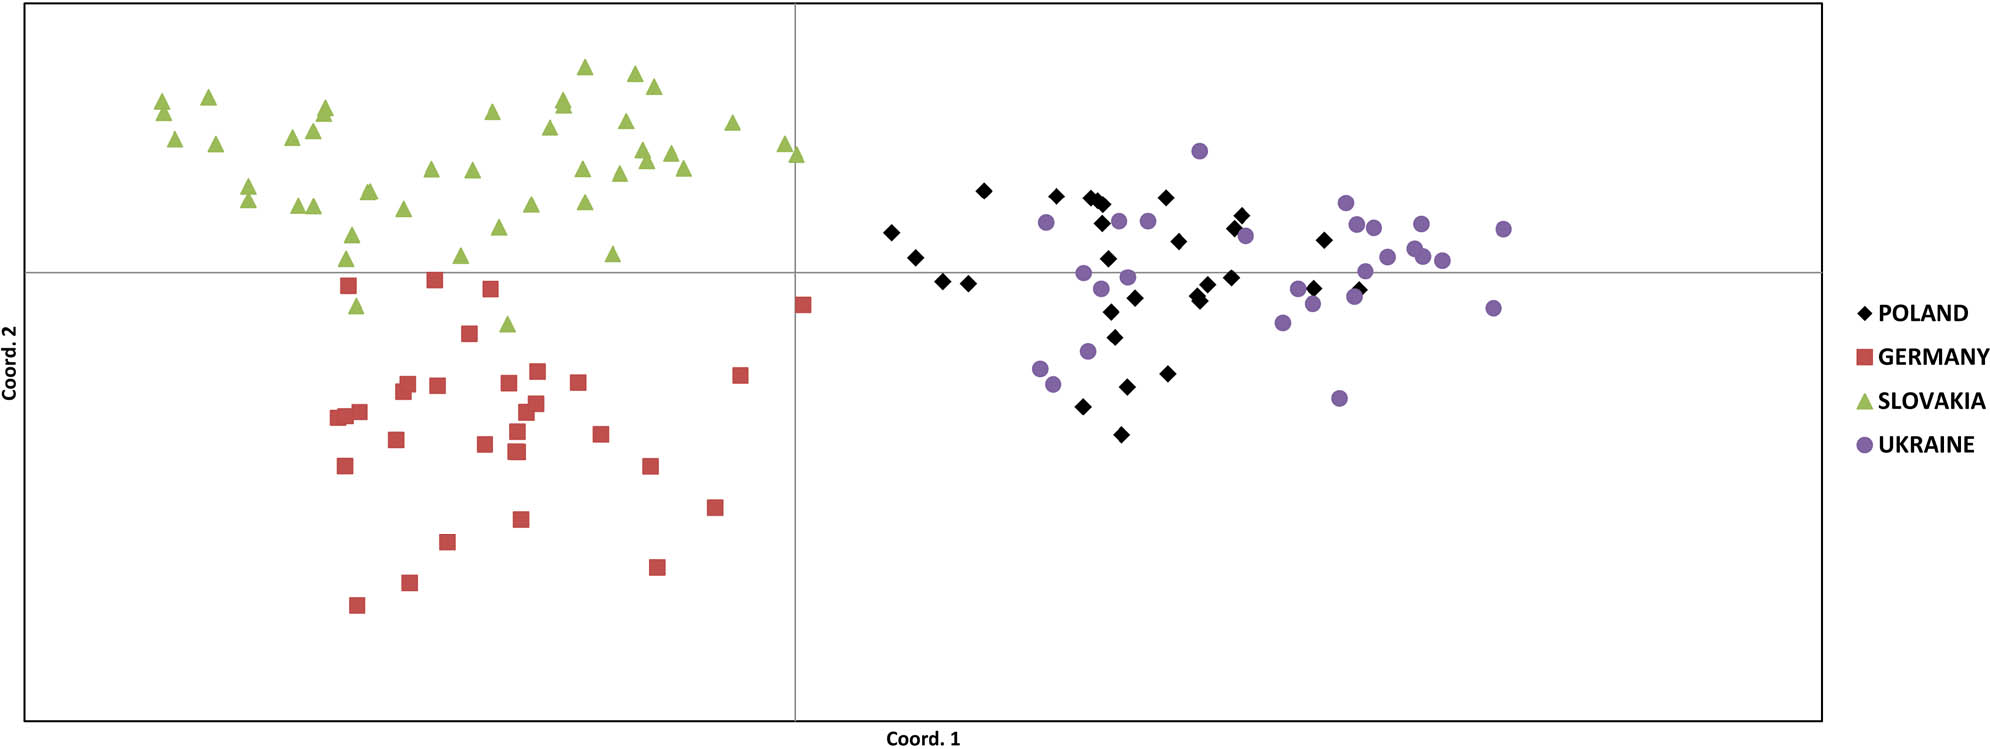
Figure 1
Scatter plot of Principal Coordinates Analysis (PCoA) based on individual pairwise genetic distances for the studied broodstocks of the European huchen
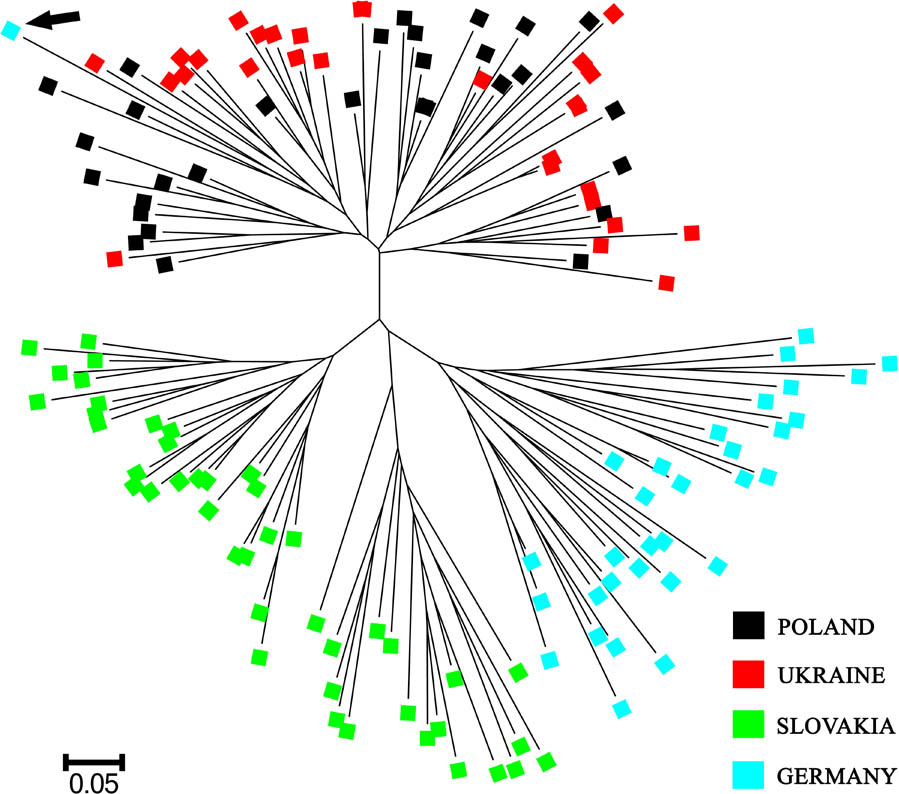
Figure 2
Unrooted neighbor-joining tree of individuals based on allele sharing distances (DAS). The arrow indicates one individual that was included in a cluster not matching its origin.
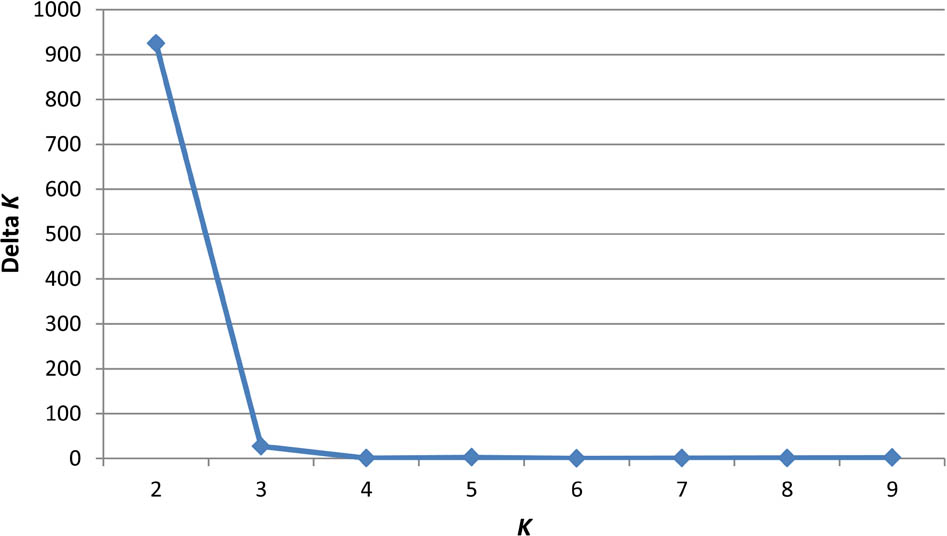
Figure 3
Plot of the rate of change in the log probability of data between successive K values (ΔK). The most likely number of genetic clusters was determined for the studied European huchen broodstocks based on the ΔK method.
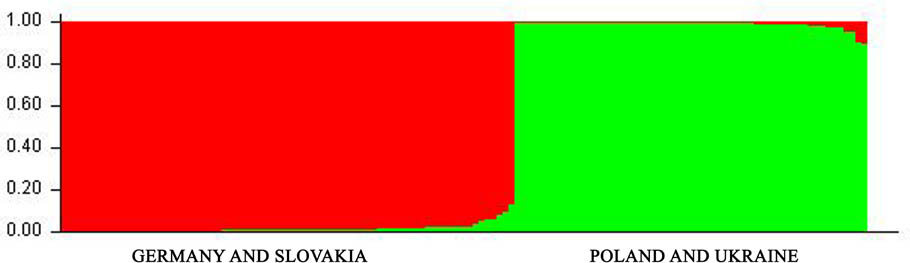
Figure 4
Structure plot of individuals sorted by admixture coefficients (q) for putative K = 2. Each vertical bar denotes one individual.
Table 1
Results of assignment tests for four examined European huchen broodstocks
| Broodstock | Leave one method | Individual assignment | ||
|---|---|---|---|---|
| N | % correct | LM | AVG | |
| Poland | 30 | 73.3 | 31.0 | 0.8255 |
| Germany | 32 | 100.0 | 0.0 | 0.9998 |
| Slovakia | 44 | 100.0 | 0.0 | 0.9999 |
| Ukraine | 29 | 69.0 | 26.7 | 0.9242 |
[i] N – number of individuals, % correct – ratio of correct assignments to baseline broodstocks in the leave-one-out test, LM – largest misidentification in each broodstock, AVG – average probabilities for all specimens in the mixture set belonging to each predefined broodstock.