
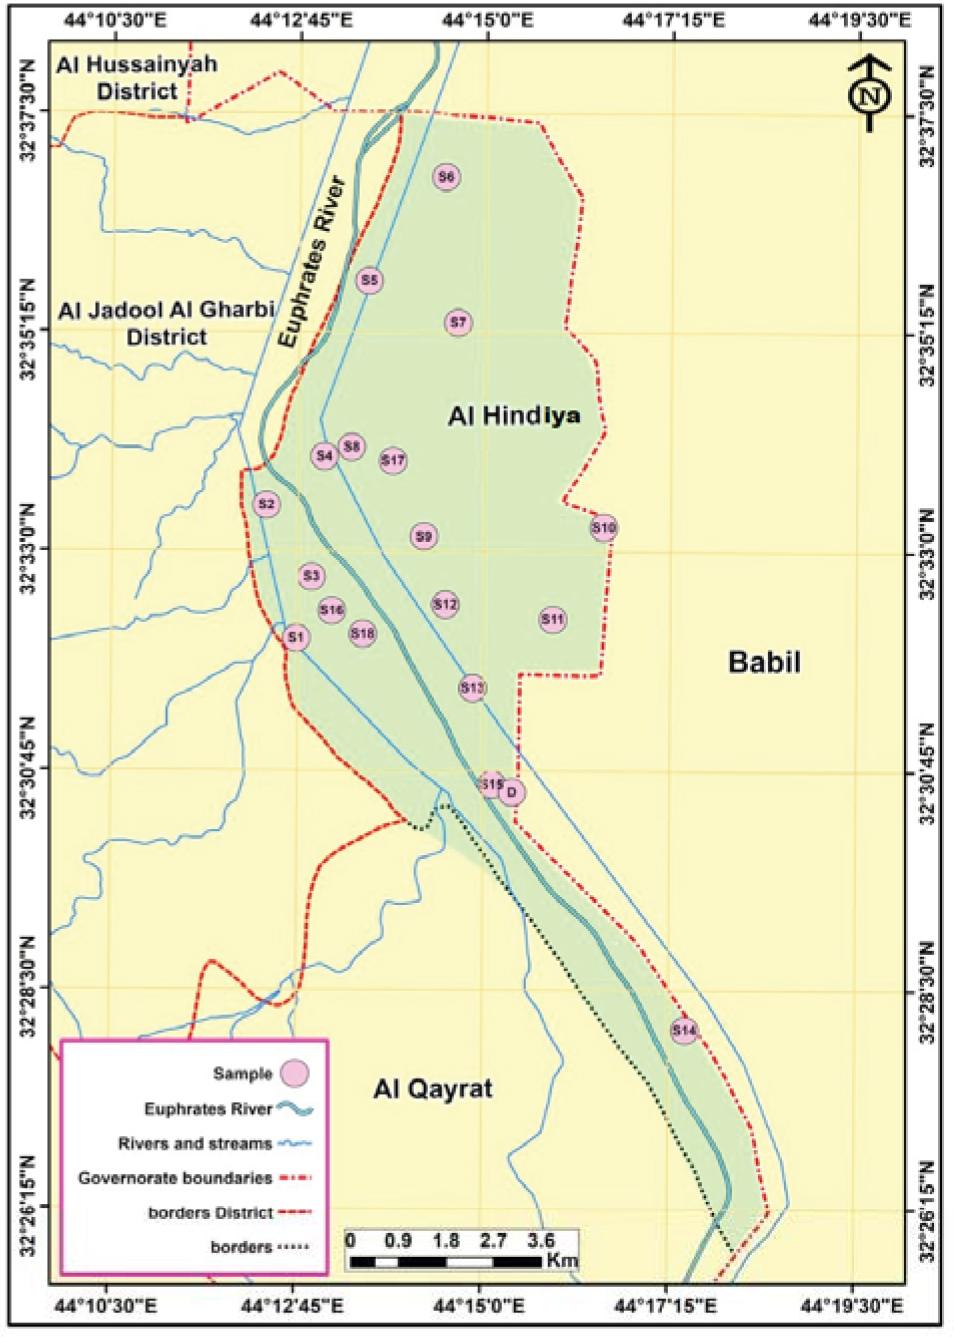
Fig. 1.
Activity concentrations of soil and corresponding H in some countries
| Country | Activity concentrations (Bq/kg) | H (mSv/y) | ||
|---|---|---|---|---|
| 40K | 226Ra | 232Th | ||
| Abha, Saudi Arabia [27] | 217.3 | 39.3 | 31.5 | 57.3 |
| Kuwait [28] | 385 | – | 15 | 40.7 |
| Syria [29] | 336 | 26 | 24 | 52 |
| Dehloran, Iran [30] | 205.3 | 292 | – | – |
| Ganos fault, Turkey [31] | 445 | 35 | 27 | – |
| Guangdong, China [17] | 535.8 | 75.1 | 101.0 | 147.2 |
| Spain [32] | 578 | 39 | 41 | 49 |
| Present work | 395 | 22.2 | 11.02 | 41 |
| World average [22] | 400 | 35 | 30 | 70 |
Activity concentrations and annual effective dose rate for soil samples
| Sample name | Activity concentration (Bq/kg) | H (mSv/y) | ||
|---|---|---|---|---|
| 40K | 226Ra | 232Th | ||
| S1 | 396 | 26.2 | 13.1 | 44.8 |
| S2 | 410 | 19.9 | 12.3 | 41.3 |
| S3 | 430 | 22.5 | 8.5 | 41.0 |
| S4 | 372 | 22.1 | 11.9 | 40.3 |
| S5 | 344 | 18.9 | 9.8 | 35.5 |
| S6 | 334 | 19.0 | 9.2 | 34.6 |
| S7 | 388 | 20.4 | 12.4 | 40.6 |
| S8 | 363 | 20.5 | 12.4 | 39.4 |
| S9 | 388 | 23.0 | 12.7 | 42.3 |
| S10 | 361 | 21.4 | 10.4 | 38.3 |
| S11 | 329 | 20.0 | 10.8 | 36.1 |
| S12 | 413 | 20.2 | 8.2 | 38.6 |
| S13 | 389 | 24.5 | 10.5 | 41.5 |
| S14 | 411 | 20.2 | 8.3 | 38.6 |
| S15 | 416 | 23.1 | 11.7 | 43.0 |
| S16 | 488 | 25.6 | 12.2 | 48.5 |
| S17 | 498 | 24.8 | 12.3 | 48.6 |
| S18 | 380 | 28.2 | 11.7 | 44.1 |
| Mean | 395 | 22.2 | 11.02 | 40.95 |