Fig. 1.
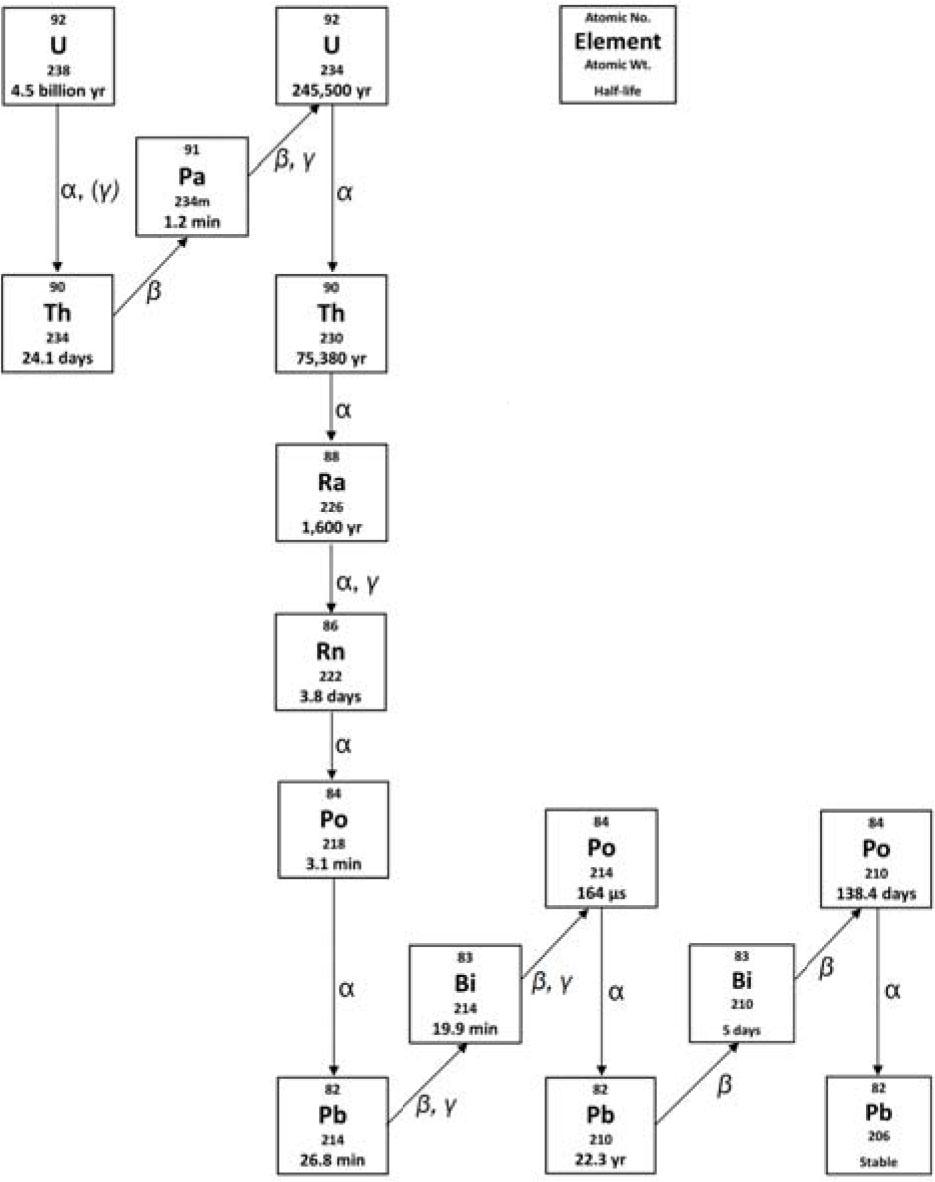
Fig. 2.
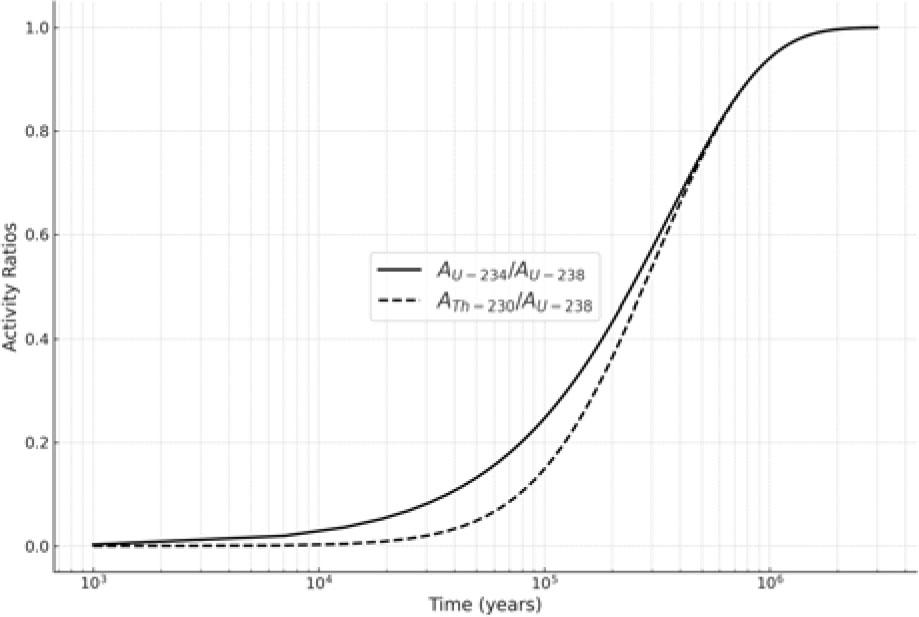
Fig. 3.
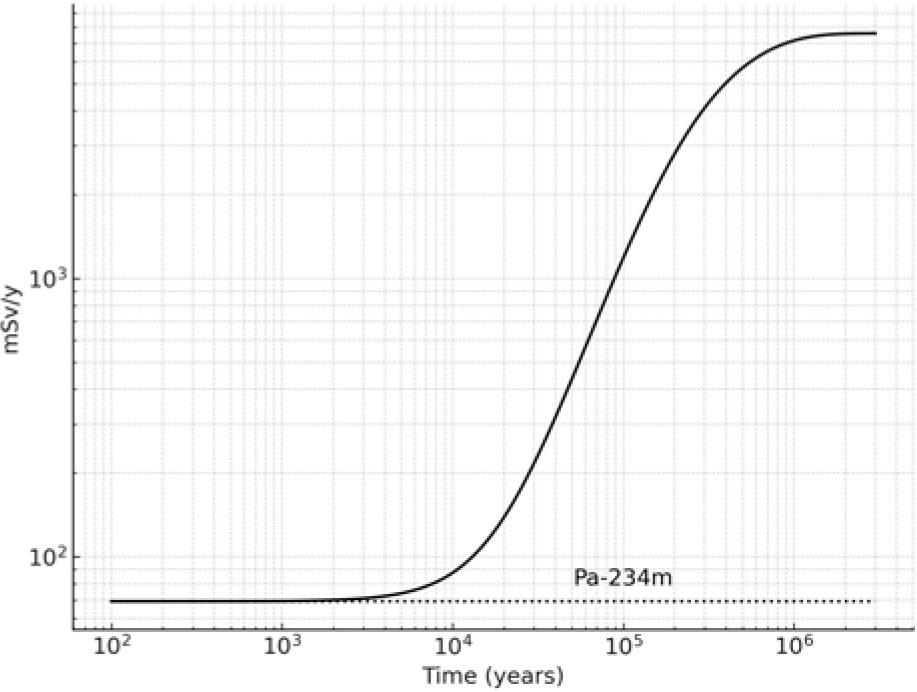
Fig. 4.
Estimated global-tailings U-238 and other relevant parameters
| Parameter | Value |
|---|---|
| Global tons of ore or tailings | 3 billion tons ore or tailings |
| Reference uranium content in ore | 0.15% (1.5 kg uranium/ton) |
| Fraction of U-238 in natural uranium | 99.3% |
| U-238 content per ton of ore | 1.4895 kg |
| Recovered U-238 per ton of ore | 1.2 kg |
| Unrecovered U-238 per ton of ore/tailing | 0.2895 kg |
| Conditioned U-238 | 3.6 million tons |
| Tailings U-238 | 868 500 tons |
| Recovery efficiency from ore | 80.6% |
Humanity's U-238 inventory in metric tons and curies as of 2022
| Category | Stock type | Metric tons | Activity (Curies) | Percentage of total-mined (%) |
|---|---|---|---|---|
| Conditioned U-238 by stock | LEU | 18 252 | 6 156 | 0.41 |
| Reprocessed uranium | 127 000 | 42 799 | 2.84 | |
| Spent nuclear fuel | 363 000 | 122 631 | 8.4 | |
| DU | 3 100 000 | 1 044 700 | 69.24 | |
| Total conditioned U-238 | 3 608 252 | 1 216 286 | 80.6 | |
| Tailings U-238 | Mill-tailings | 868 500 | 292 700 | 19.4 |
| Humanity's U-238 | Total-mined | 4 476 752 | 1 507 984 | 100 |
Global mill tailings estimates by source, date, and key concerns
| References | Global mill tailings estimate | Annual production estimate | Major regions affected | Key concerns |
|---|---|---|---|---|
| IAEA [17] | Over 900 million cubic meters | Not specified | North America, Europe, Africa | Radon emissions, groundwater contamination, soil erosion |
| Sutherland [15] | Over 1 billion metric tons in the year 2000 (sic) | Over 200 million metric tons annually | United States, Canada, former Soviet Union areas | Radon release, groundwater contamination from in situ leaching |
| NEA [18] | Over 1 billion metric tons | Not specified | North America, Europe, Central Asia | Long-term containment, groundwater protection |
| NEA/IAEA Red Book [34] | Over 1 billion metric tons | Not specified | North America, Europe, Central Asia | Radon emissions, erosion, groundwater contamination |
Observed gamma doses from uncovered mill-tailings
| Location | Gamma dose rate observed | Key findings |
|---|---|---|
| Bellezane site, France [38] | Above 10 μSv/h in certain areas | Gamma radiation levels vary by depth and exposure; higher values observed in specific areas emphasize the need for location-specific radiation mitigation strategies. |
| Tuyuk-Suu, Kyrgyzstan [39] | 10 μSv/h and higher in tailings | Highlights potential for elevated gamma exposure in legacy uranium processing regions, underscoring radiological risks in abandoned sites. |
| Former uranium mining sites, Portugal [40] | Frequently exceeded 10 μSv/h, peaks at 20 μSv/h | Persistent gamma dose rates on tailings surfaces present significant radiological hazards, necessitating ongoing monitoring and potential intervention. |
| Pridnieprovsky Chemical Plant, Ukraine [41] | Up to 10 μSv/h in tailings and buildings | High gamma exposure levels detected in tailing areas and nearby structures suggest the need for targeted remediation in legacy milling sites. |
| Granitic uranium deposit, China [42] | Average of 17.79 μSv/h | Technologically elevated gamma dose rates in a natural uranium-rich area high-light the potential for occupational and environmental exposure risks. |
| Uranium mining legacy sites, Portugal [43] | 7.5–9.5 μSv/h on tailings piles | Gamma radiation from tailings poses long-term environmental and health risks, indicating the persistent impact of historical uranium mining. |
Intensity-weighted gamma energy per decay and equilibrium contribution
| Isotope | Intensity-weighted gamma energy per decay (keV) | Contribution at equilibrium (%) |
|---|---|---|
| Pa-234m | 8.41 | 0.91 |
| Ra-226 | 6.10 | 0.66 |
| Pb-214 | 189.29 | 20.49 |
| Bi-214 | 1076.40 | 77.94 |