Studying the elemental composition of coins is a crucial aspect in archaeology. It provides valuable insights into mining and metallurgy practices, minting techniques, and the economic and political conditions of a particular region at a specific period. Traditional physicochemical analysis, however, often involves destructive procedures. To address this, nondestructive methods of atomic spectroscopy have been employed, enabling the determination of elemental composition without causing damage to the sample. Therefore, they can be used on archaeological artifacts. A wide range of spectroscopic approaches, including wavelength-dispersive X-ray fluorescence (WD-XRF) spectrometry, energy-dispersive X-ray fluorescence (ED-XRF) method, scanning electron microscope with energy-dispersive X-ray spectrometry (SEM-EDS), and particle-induced X-ray emission (PIXE) technique, have been extensively used in numismatic research [1,2,3]. These techniques differ in the method of exciting atoms in the sample. However, they all rely on the spectroscopy of emitted X-ray photons from the target material. XRF employs X-ray photons as the excitation source; SEM-EDS uses electrons; and PIXE uses a high-energy proton beam. The interaction between the probe and the sample provides distinct information and depth resolution of the target material. When using different methods, we may not always obtain the same results, but the interpretation of results can harmonize the overall outcome. These methods are systematically applied in research on archaeological artifacts aimed at identifying the technological processes used in ancient times. One of the most common applications of spectroscopic methods is the elemental analysis of coins from around the world. In the work by Parreira et al. [4], the authors analyzed Ag and billon coins from the Museu Histórico Nacional do Rio de Janeiro (MHN). These coins were minted during the Brazil Colônia period, under Dutch occupation, and in Portuguese mints during the reigns of Fernando I (1367–1383) and João I (1383–1433). They employed a portable X-ray fluorescence system (pXRF) for this purpose. The results indicate that despite the transfer of the royal mint from Bahia to Rio de Janeiro in 1698 and to Pernambuco in 1700, there was no change in the composition of coins minted in Brazil. However, it was observed that after the return of the royal mint to Rio de Janeiro in 1702, there was an increase in the Au content of the coins. The results obtained for the Ag coins minted in Portugal in the 14th and 15th centuries confirmed the assumption that a greater monetary debasement occurred during the reign of João I than during the reign of his predecessor, Fernando I.
The XRF technique was employed to verify the composition of these coins minted in Italy from the late 12th to the 14th centuries [5]. The analysis revealed the use of native Au for minting Florentine coins, ruling out the possibility of recycling Au from other sources. Conversely, the variation in the composition of Tari and Augustali Au coins suggests the utilization of Islamic and North African Au. The study may shed light on the sudden proliferation of Au coins in Italy in the first half of the 13th century, allowing for hypotheses about the origin of the Au used for coinage that dominated economic trade thereafter. In the study by Lei et al. [6], the composition of Kangxi coins from the Qing Empire was examined using SEM-EDS. Based on the results, three groups were identified. Group 1 represents coins minted in the Yunnan Province with a high Ag content, as well as some special coins minted, for example, on the occasion of Emperor Kangxi's birthday. By contrast, Groups 2 and 3 represent coins minted before and after 1684. The differences in composition between mints were hardly noticeable, except for coins marked with the mint mark “Yun”. According to Buccolieri et al. [7], a thorough analysis was conducted on ancient Ag coins from the Greek colony of Taras, minted between the 5th and 3rd centuries BC. Their examinations, involving X-ray microanalysis, SEM-EDS, and XRF analyses, revealed that these coins had a corrosion layer of no more than 25 μm thick, and the surface Ag enrichment was <1% in weight. This implies a considerable decline in the Ag content, from approximately 97% in the older coins to about 80% in those from the 3rd Evans period (300–270 BC), which aligns with significant social shifts during that era.
Cross denars are early Piast coins that are commonly found in Polish hoards. The minting of denars was inspired by German and Czech coins. These coins were composed of Ag–Cu alloys with Ag as the main component [8].
The reason for using this alloy for coin production was the easy availability of these raw materials [9, 10]. Previous research [11] suggested that these were Ag coins with some Cu content. However, this study aims to investigate cross denars further, as indications suggest that these coins might have a hidden Cu core beneath the Ag (or Ag–Cu) surface [9].
This raises the question of whether these coins were counterfeit or intentionally designed for mass production. The biggest challenge is examining these coins without damaging them, as traditional X-ray spectroscopy methods do not allow signal penetration to the core. Previous studies on Roman denarii demonstrated the presence of a core different from the surface composition, which could be observed only when the coins were broken to examine them in cross-section [12,13,14,15].
Similar research on Polish medieval coins involved SEM-EDS, ED-XRF, micro X-ray fluorescence (μXRF), and microparticle-induced X-ray emission (μ-PIXE) measurements, which suggested the presence of a core in extraordinary Ag coins discovered in Polish territories.
This research reveals significant variations in the composition of cross denars, challenging the previously held belief that they were homogeneous Ag–Cu alloys. The study employs advanced, nondestructive spectroscopic techniques to uncover these differences, highlighting the need for further research in the minting history and technology of Poland in the Early Middle Ages and reconsidering the effectiveness of noninvasive X-ray techniques for archaeological examinations.
The cross denars analyzed in this work were found by detectorists, originate from Polish lands, and are part of a private collection. Their authenticity was confirmed by numismatists from the District Museum of the Kalisz Region.
For reference, coin A weighs 0.78 g, with a radius of 6.37 mm and a thickness of 0.3 mm. On the contrary, coin B weighs 1.00 g, has a radius of 7.20 mm, and a thickness of 0.3 mm. In the study, a Mettler Toledo scale was used, and the thickness and radius were measured with a caliper. To perform the analyses, an invasive approach was adopted by cutting the coins and examining the surface of the cuts. The first coin, referred to as coin A, belongs to Type VI (with a cross on the obverse) of Variant CNP 858 according to Gumowski [16]. This coin is dated to 1085–1095 and was issued in Poland. Notably, there is an extensive corrosion pit on the surface of coin A, visible even to the naked eye, as shown in Fig. 1.
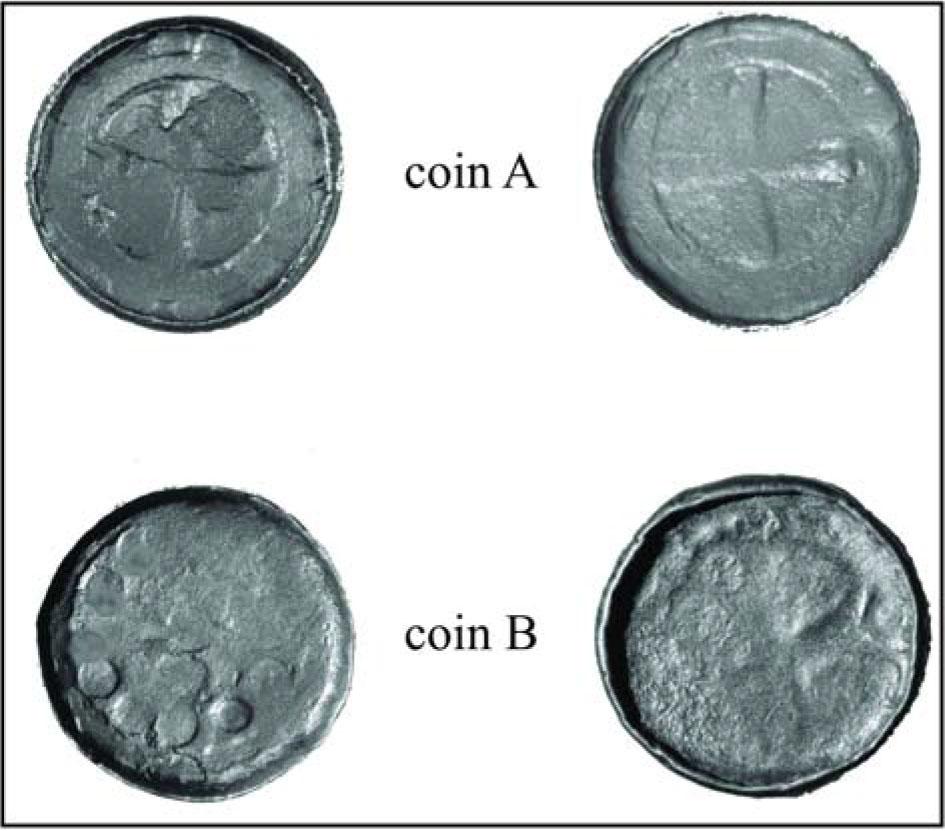
Photo of cross denars: the top image represents coin A and the bottom image represents coin B. In both cases, there is the obverse on the left side of the figure, and the reverse on the right side.
The second coin, labeled as coin B (Fig. 1), belongs to Type VII (with a crosier on the obverse) of a variant close to CNP 986 (according to Gumowski). It dates to 1090–1100 and was issued in either Saxony or Poland. Unlike coin A, there are no corrosion pits on the surface of coin B, and the morphology of the die is considerably worn out, suggesting a technological difference from coin A, as can be seen in Fig. 1.
The elemental composition of early medieval Polish coins, known as cross denars (denary krzyżowe, krzyżówki), was assessed using ED-XRF and SEM-EDS analyses for the surface, along with additional cross-sectional analyses with micrometer resolution (optical microscopy, SEM-EDS, μXRF, PIXE, and μ-PIXE).
The study was started by microscopic observations made on sections using a NIKON Eclipse LV150 metallographic microscope equipped with a Nikon Digital Sight DsFi1 microscope camera. The microscope was employed for detailed examination of medieval coins, providing high-resolution imaging of surface features and microstructural details. Its versatile magnification range and advanced optical system enabled precise analysis of the coin's surface and cross-sectional layers, which is crucial for understanding their composition and manufacturing techniques.
The SEM-EDS analyses were conducted using a Hitachi S3400N Scanning Electron Microscope (tungsten electron gun with thermoemission, accelerating voltage: 0.3–30 kV, high and low vacuum capability [6–270 Pa], and resolution: 3 nm). The observations were carried out by means of secondary electron (SE) and backscattered electron (BSE) detectors with a 20 kV accelerating voltage at a pressure of 50 Pa. Elemental composition of the samples was determined by the use of the EDS technique. The EDS spectra were measured using a HITACHI microscope equipped with an NORAN 986B1SPS EDS analyzer with an acceleration voltage of 10 kV. The measurements were performed in a vacuum chamber using a 20 keV electron beam, with a measuring time of 120 s. The EDS investigations were performed in a semiquantitative, surface, and standardless mode.
For the analysis, the electron range in the coin matrix, approximated as an Ag–Cu alloy with 90% Ag and 10% Cu, was calculated to be 2.53 μm using the MCNP code [17]. This indicates that the method is surface-sensitive only, providing information from a shallow depth. To identify the composition of the core, the cross-section of the coin was also studied using the same SEM-EDS technique.
The ED-XRF measurements were conducted using a custom-designed X-ray source, developed at the National Centre for Nuclear Research (NCBJ) in Świerk [18, 19]. For the ED-XRF measurement, the entire area of the coin was examined simultaneously, providing an average elemental composition. During the measurements, the source operated at 50 kV with an electron current of 30 μA, and the acquisition time was set to 300 s. The fluorescence spectra of the coin were registered using an Amptek silicon drift detector (SDD), offering an energy resolution of 149 eV at the Mn Kα line. The distances between the X-ray source and the measured coin (SC) and between the coin and the detector (CD) were set to 230 mm and 240 mm, respectively. The incident angle of the X-ray beam was 90°, while the detector angle was 45°. The spectra were recorded using an Amptek ADMCA multichannel analyzer. The ED-XRF spectra were analyzed using the XRS-FP software (X-ray Fluorescence–Energy-Dispersive Spectrometry–Fundamental Parameter program). The conversion of elemental peak intensities to elemental concentration was performed using a built-in database in the XRF-FP software (http://www.crossroadsscientific.com). In processing the spectra, the background signal was subtracted from the spectra, which allowed us to determine the measured intensities of the peaks more accurately. The peak intensities were determined by integration of the counts in a defined region of interest (ROI). As it is not possible to separate the pattern lines, the summed line intensities were considered (Kα = Kα1 + Kα2, Kβ = Kβ1 + Kβ3). The overlapping of the peaks was corrected by Gaussian deconvolution.
In μ-XRF measurements, which were carried out in the Faculty of Foundry Engineering at the AGH University of Krakow, an ED-XRF Spectro Midex LD spectrometer was used. This setup utilized a molybdenum X-ray tube and an SDD detector, with a 150 eV resolution at 5.9 keV, and when combined with a collimator it produced an X-ray beam of 0.25 mm in diameter. The analytical conditions used for ED XRF were 44.6 kV, 5.9 mA, and 300 s of live time. The analysis was carried out in a standardless mode using the fundamental parameter program (FP+) to correct matrix effects.
The PIXE and μ-PIXE measurements were performed at the Microanalytic Centre of the Jožef Stefan Institute in Ljubljana using a 2.0 MV tandem accelerator. Initial measurements were performed at the in-air beamline according to the techniques presented by Šmit et al. [20] and Šmit and Šemrov [21]. However, as we wanted to inspect the inhomogeneous interior of the coins, their cross-sections were analyzed at the microbeam line, which is equipped with intrinsic germanium and SDD detectors. PIXE mapping was performed in vacuum by a 3 MeV proton beam. The proton incident angle was 0° while the X-ray detector was positioned at 45° with respect to the beam. The acquired spectra were analyzed using the GeoPIXE II software [22], with normalization based on the RBS signal from the chopper intersection at the entrance of the measuring chamber [23].
We examined the cross denars surface and cross-section. For identifying possible morphological differences resulting from manufacturing technology, corrosion, or conservation processes, transverse cuts of the coins were etched. Microscopic images of the cross-sections of coin A, which are remarkable for the presence of corrosion pits, can be found in Fig. 2a.
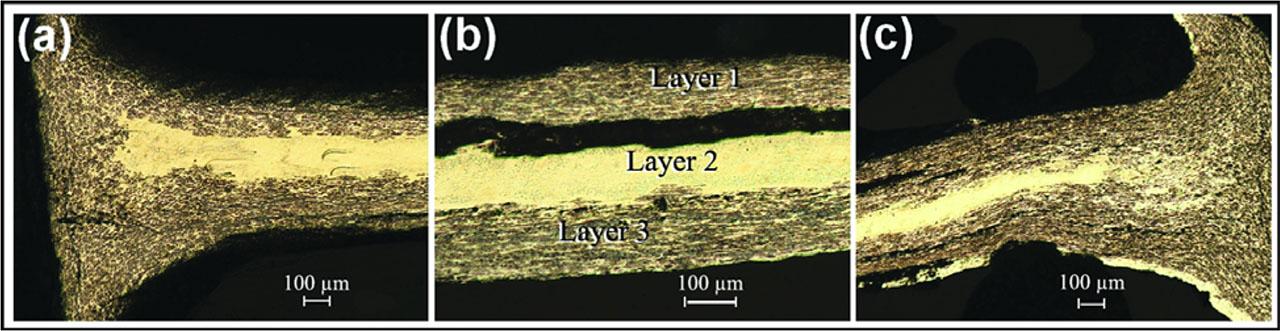
Microscopic photo (magnification: (a) 50×, (b) 100×, and (c) 50×) of coin A (cross-section).
Optical microscopic examinations demonstrated a layered structure and the presence of a core in coin A. Between the core and Ag overlays, there is an empty space (black zone in Fig. 2b) that indicates that these coins were made by hammering (plating) of Ag sheets, forming an overlay onto the central part, that is, core. As there are no traces of exfoliation on the edge of the coins, it can be inferred that the overlays were melted and shaped in this spot, thus forming folded edges. To identify differences in elemental composition due to alloy morphology and measurement technique, macro-ED-XRF (2.1 cm diameter beam) and μ-XRF microanalyses were used. Variables included surface and cross-section examinations.
The composition of cross denars was determined using different techniques of X-ray spectrometry. The ED-XRF results refer to the surface measurement. Figure 3 represents the comparison of XRF “macro” spectra for the surfaces of both coins (A and B).
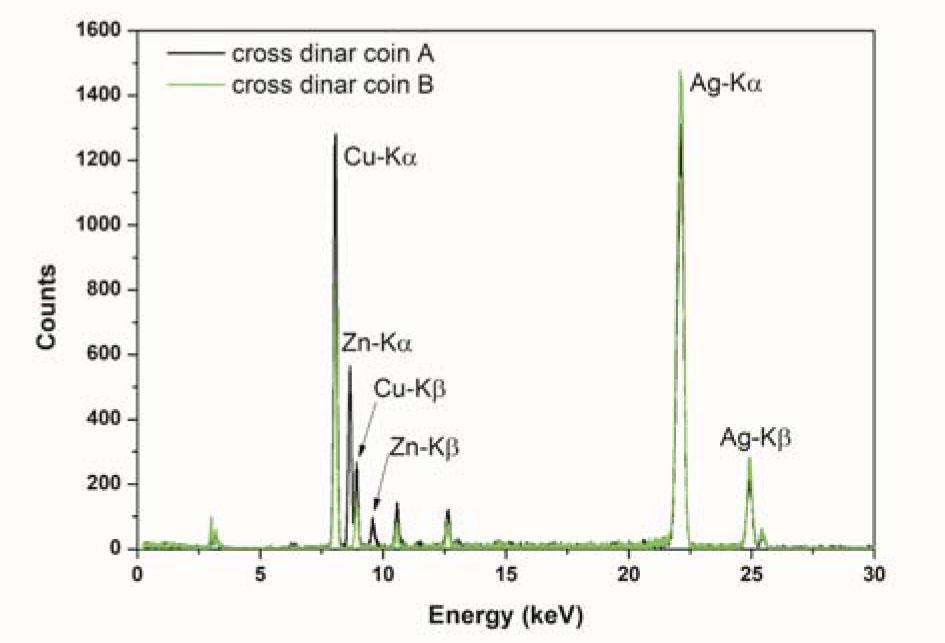
ED-XRF spectra of the surfaces of the cross denars coins A and B.
The spectra for coin A (black line) and coin B (green line) exhibit several peaks corresponding to the characteristic X-ray energies of various elements present in the coins. Coin A and coin B show similar patterns with peaks at the same energy levels, indicating that both coins are composed of similar elements. However, the intensity of the peaks varies between the two coins. For coin A, notable peaks include Cu-Kα at 8.04 keV and Cu-Kβ at 8.9 keV. Zn peaks appear at 8.6 keV for Zn-Kα and 9.6 keV for Zn-Kβ, and prominent Ag peaks are observed at 21.4 keV for Ag-Kα and 24.9 keV for Ag-Kβ. For coin B, the Cu-Kα and Cu-Kβ peaks are less intense, suggesting a lower Cu content compared to coin A. Zn peaks are not visible. Ag peaks (Ag-Kα and Ag-Kβ) show slightly higher intensities, suggesting a higher Ag content. The differences in peak intensities, particularly the presence of Zn in coin A and its absence in coin B, suggest that coin A may have a Cu–Zn core beneath a surface layer of Ag–Cu.
SEM images of the coin cross-section, combined with SEM-EDS, reveal an 80 μm thick Ag-enrichment on the surface of the coin. The cross-section of coin B is shown in Fig. 4.
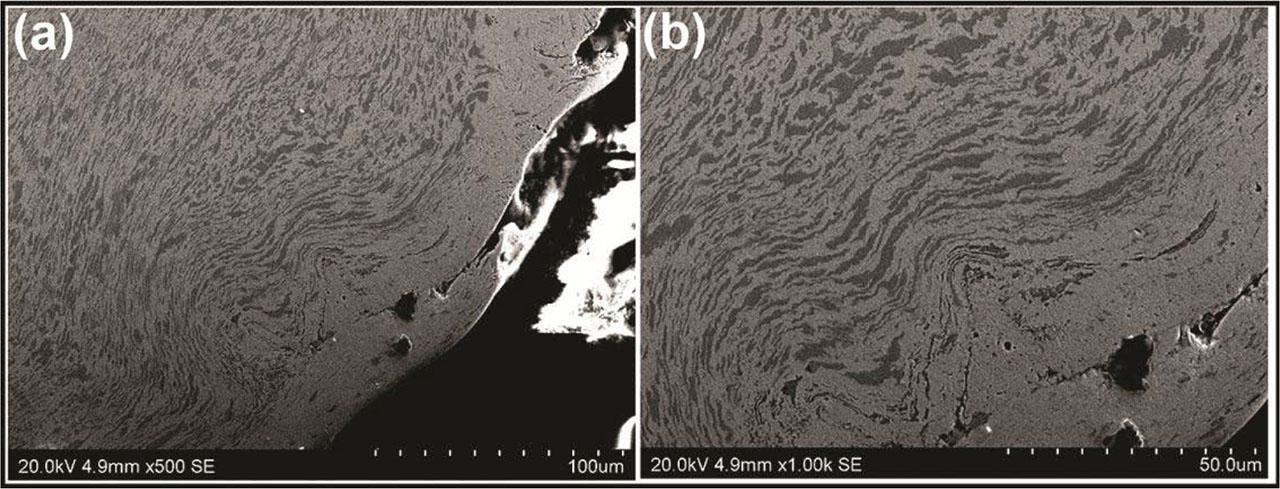
SEM image obtained with SE of coin B.
This enrichment, known as “Ag enrichment” [24,25,26,27,28,29], may result from the application of chemical reagents in the conservation process of coins. On the contrary, it may also have been caused by intentional technological baths, for instance, in wine acid, which was already known in the Middle Ages (for the virtual increase in the Ag content and to improve the visual quality). The contents of Ag and Cu (determined by the use of EDS) in the enriched zone (up to a depth of ~25 μm), which is devoid of large Cu precipitates, are as follows (in wt%): Ag – 91.69 ± 1.17 and Cu – 3.98 ± 0.37. In subsurface microzones at the depth of more than 25 μm, one can clearly see a binary arrangement and Cu precipitates in the Ag–Cu crystallization phase. In the areas of these precipitates, the content of Cu (wt%) is 88.9 ± 1.35 and of Ag is 11.1 ± 0.53.
A detailed image of coin A obtained with back-scattered electrons is shown in Fig. 5. Analogously to the coreless coin B, we can isolate an Ag-enriched overlay up to a depth of ca. 100 μm (see Figs. 5b–5d). Figure 5a demonstrates the presence of the core.
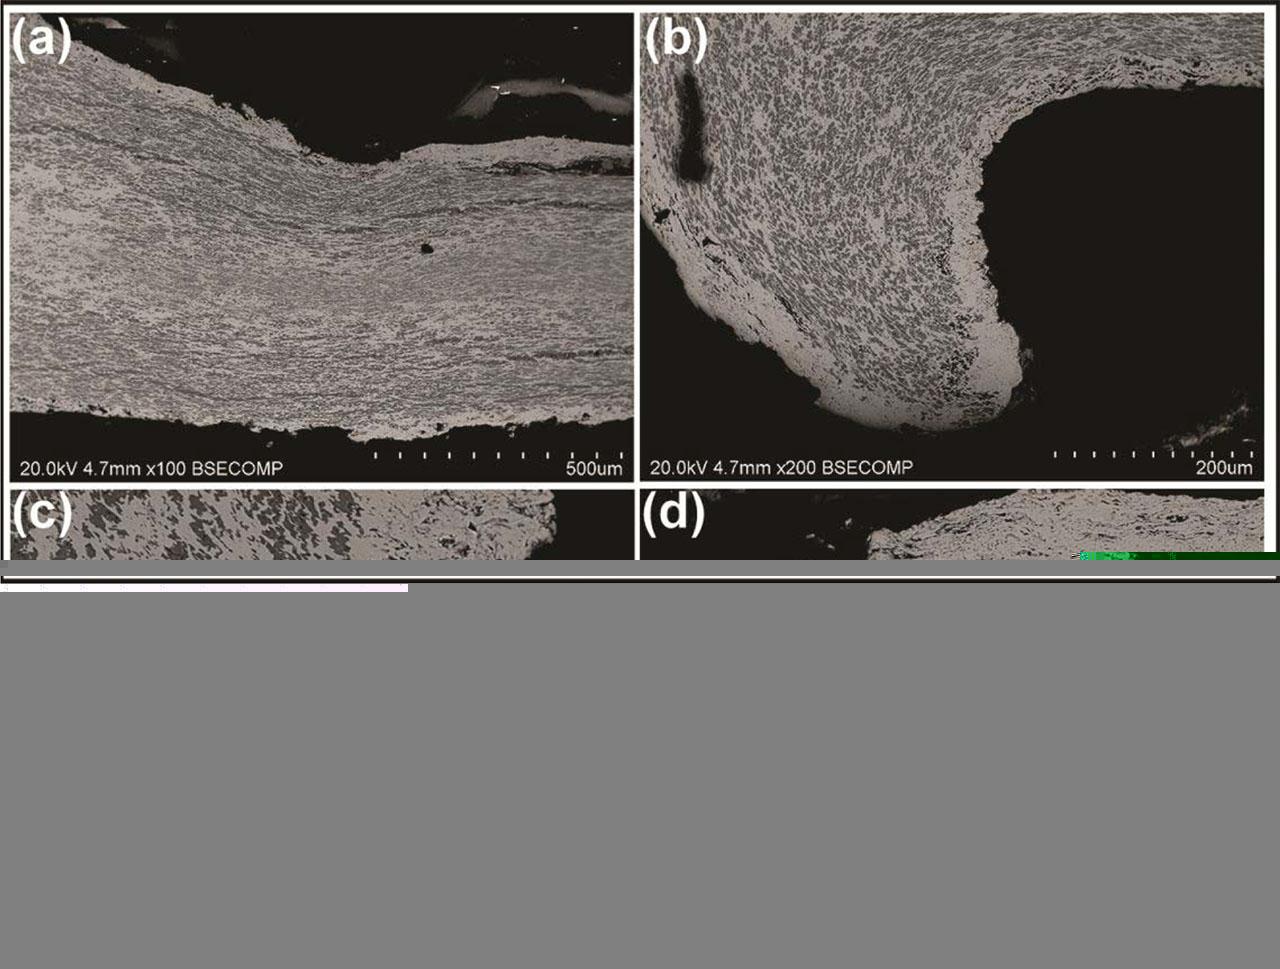
Image of coin A obtained in SEM with back-scattered electrons.
Figure 5 shows a multielemental composition of the alloy with intercrystalline inclusions. The SEM-EDS microanalysis demonstrated that we were chiefly dealing here with an Ag/Cu/Zn arrangement. Additionally, between the Ag enrichment phase and the core, there is a zone of the Ag overlay, which demonstrates traits of diffusion of core components into the core, that is, a Zn-enriched microzone. As suggested by Chabrzyk and Młodecka [30], the presence of Zn may also be a result of using sphalerite (ZnS) deposits, which co-occur with galena for Ag smelting. However, we assume that the Zn alloy contents are limited to ~2%, while the microanalyses of coin A demonstrated the presence of contents reaching 16.43%.
For comparison, a set of museum coins from a similar period was analyzed. Using SEM-EDS and ED-XRF, the surfaces of denars of type CNP851-860/848, denars of type CNP813, and denars of Sieciech were examined.
Figure 6 illustrates the elemental composition of the surfaces of two cross denar coins, labeled as coin A and coin B, alongside the measurements from 14 other coins from the same period. These additional coins, represented by open squares, are housed in a museum and could only be analyzed on their surfaces due to preservation concerns. Since these coins could only be analyzed on their surfaces, the data reflect their surface compositions, which are dominated by Ag with minor contributions from Cu and Zn. Coin A and coin B are represented by blue dots. The composition suggests that coin A has a predominantly Ag surface with minor amounts of Cu and Zn. The higher position of coin B toward the Ag vertex compared to coin A signifies an even purer Ag surface with minimal Cu and Zn contents.
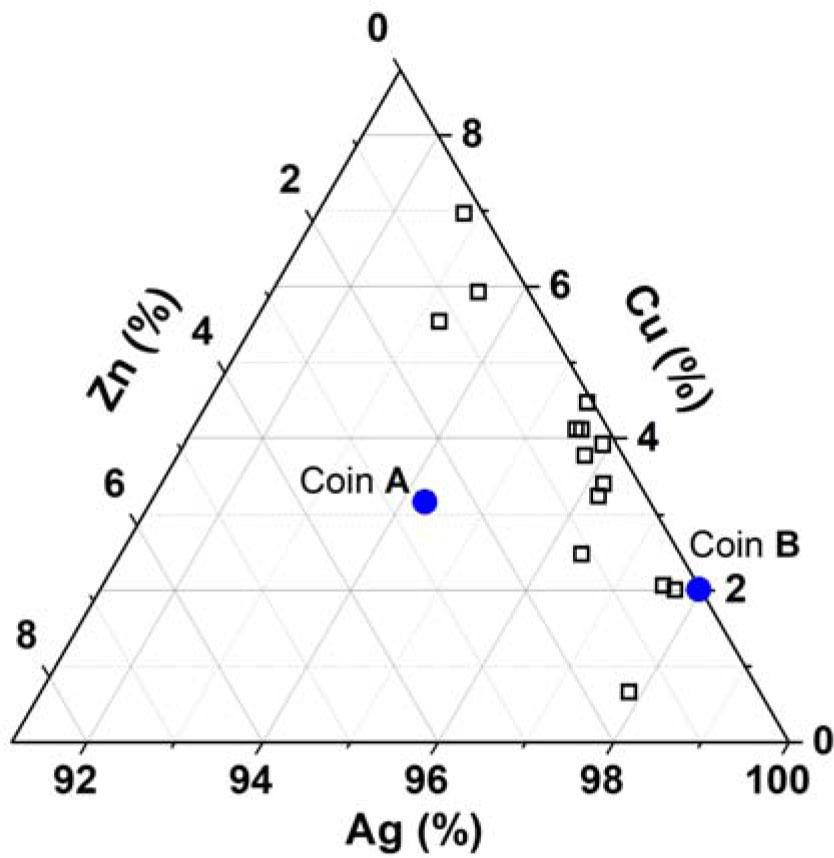
Comparison of elemental composition of early medieval coins.
To obtain a more detailed distribution of elements in the cross-section, we performed μ-PIXE measurements. This technique allows us to produce elemental maps (see Fig. 7).
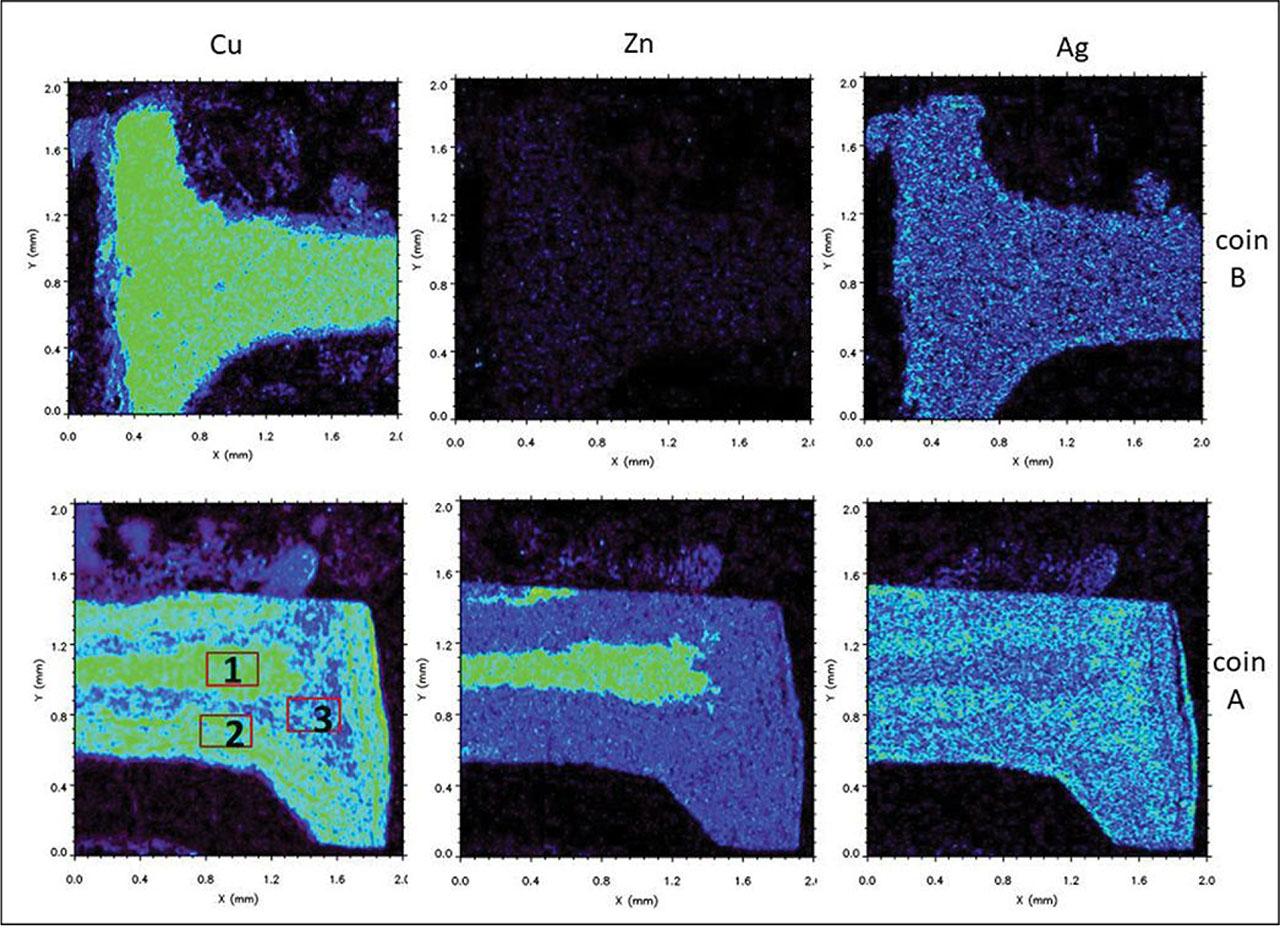
Elemental maps of Cu, Zn, and Ag obtained with the μ-PIXE technique on both samples of cross dinars. Red empty squares represent areas of detailed analysis.
Figure 7 presents elemental maps of Cu, Zn, and Ag obtained using the μ-PIXE technique for two samples of cross denars. These maps visually depict the distribution of these elements on the surface and within the core of the coins. For coin B, the Cu map shows a concentration of Cu throughout the entire area of the coin. On the contrary, the Zn map shows negligible amounts of Zn. The Ag map reveals a more dispersed distribution of Ag. In the case of coin A, the Cu map shows a distinct horizontal band of Cu running through the middle section, indicating a substantial presence of Cu in this area. The Zn map for coin A highlights a distinct area with higher Zn concentration within the same band where Cu is present. This image clearly indicates the presence of a Cu–Zn core inside the coin. The Ag map shows a broad distribution of Ag on the coin's surface. In the images, areas marked with red empty squares are regions designated for detailed analysis. These areas correspond to regions of interest where the elemental composition was examined more closely. For coin A, three such areas were identified, suggesting a thorough investigation of specific regions where variations in elemental composition are expected or where notable features were detected.
The analysis of the microzones in coin A demonstrates changing elemental composition for the given zones. Table 1 offers a list of results of the elemental composition for coin A, and Table 2 for coin B (surface). Table 1 presents the elemental composition of a sample measured using various analytical techniques, highlighting the percentages of Ag, Cu, and Zn in different regions and layers. The ED-XRF surface analysis shows a high Ag content on the surface, with Cu and Zn as minor components. The μ-XRF analysis provides more detailed insight into different layers of the sample. In Layer 1, there is a significant Cu presence compared to the surface. Layer 2 suggests even higher concentrations of Cu and Zn deeper within the sample. Layer 3 indicates a return to higher Ag content and lower Cu and Zn levels. SEM-EDS surface analysis shows a composition similar to the ED-XRF surface data. However, the SEM-EDS cross-sectional analysis reveals more variability. Points 1 and 2 have compositions consistent with surface measurements. Points 3–6, however, show significant deviations, with Point 3 indicating a Cu–Zn-rich region and other points showing varying levels of Ag, Cu, and Zn. The average composition from SEM-EDS cross-sectional analysis indicates an overall higher Cu content in the cross-section compared to the surface. The μ-PIXE cross-sectional analysis shows variability across different areas, with some regions displaying a balance of Ag and Cu, while others have a higher Ag content. Notably, the analysis reveals the presence of a distinct Cu–Zn-rich core inside the sample, indicating a layered structure with a Cu–Zn center surrounded by an Ag-rich outer layer.
Results obtained from different analytical techniques performed on coin A (surface and cross-section)
| Analytical technique | Ag (%) | Cu (%) | Zn (%) |
|---|---|---|---|
| ED-XRF (surface) | 94.63 | 2.77 | 2.59 |
| μ-XRF Layer 1 | 64.69 | 29.91 | 5.41 |
| μ-XRF Layer 2 | 53.15 | 31.90 | 14.95 |
| μ-XRF Layer 3 | 73.81 | 20.37 | 5.82 |
| SEM-EDS (surface) | 94.25 | 3.20 | 2.55 |
| SEM-EDS (cross-section) Point 1 | 92.06 | 4.13 | 3.29 |
| SEM-EDS (cross-section) Point 2 | 91.69 | 3.98 | 4.33 |
| SEM-EDS (cross-section) Point 3 | 8.23 | 77.40 | 13.57 |
| SEM-EDS (cross-section) Point 4 | 11.10 | 88.90 | <LLD |
| SEM-EDS (cross-section) Point 5 | 8.42 | 75.14 | 16.43 |
| SEM-EDS (cross-section) Point 6 | 32.91 | 53.16 | 10.95 |
| SEM-EDS average | 40.74 | 50.45 | 8.10 |
| μ-PIXE (cross-section) Area 1 | 42.88 | 46.68 | 10.44 |
| μ-PIXE (cross-section) Area 2 | 52.41 | 46.02 | 2.57 |
| μ-PIXE (cross-section) Area 3 | 67.33 | 29.94 | 2.73 |
Results obtained from different analytical techniques performed on coin B
| Analytical technique | Ag (%) | Cu (%) | Zn (%) |
|---|---|---|---|
| ED-XRF (surface) | 96.23 | 3.07 | 0.71 |
| SEM-EDS (surface) | 97.97 | 2.03 | <LLD |
| XRF (surface) | 90.27 | 5.85 | 3.88 |
Table 2 presented the results of the elemental composition of the coin's B surface, measured using three different analytical techniques: ED-XRF, SEM-EDS, and μ-XRF. The ED-XRF surface analysis revealed a high Ag content (96.23%), indicating that Ag was the dominant element on the coin's surface. Cu was a minor component (3.07%), and Zn was present in a very small amount (0.71%). The SEM-EDS surface analysis showed an even higher Ag content (97.97%), further confirming the dominance of Ag on the surface. The Cu content was very low (2.03%), and Zn was below the detection limit. The μ-XRF surface analysis indicated a relatively lower Ag content (90.27%) compared to other techniques, but Ag remained the dominant element. This technique showed higher Cu (5.85%) and Zn (3.88%) contents, suggesting that it might have been more sensitive to the presence of these elements on the surface.
Spectroscopic X-ray techniques are valuable in archaeometry, but surface analysis may not fully represent a sample's composition. Our research highlights significant inconsistencies between the surface and core of the analyzed coin. Nondestructive methods like ED-XRF, SEM-EDS, and PIXE penetrate only a few tens of microns, limiting their ability to detect internal structures. Cross-sectional analysis, however, revealed a Cu–Zn core in early medieval Polish coins, previously considered homogeneous Ag–Cu alloys. Coin A's cross-sectional analysis exposed a layered structure with a Cu–Zn core beneath an Ag-rich outer layer, which surface analysis alone could not detect. The increased surface presence of Cu and Zn, as recorded by ED-XRF, suggests this layered structure. These findings underscore the need for further research in early medieval Polish minting practices and a re-evaluation of X-ray techniques in archaeometry. While noninvasive methods are crucial for preliminary studies, more accurate results often require destructive sampling. One promising option is laser-induced breakdown spectroscopy (LIBS), allowing microdestructive analysis of both surface and core to depths of 0.1–100 μm, which enables detailed chemical profiling.