
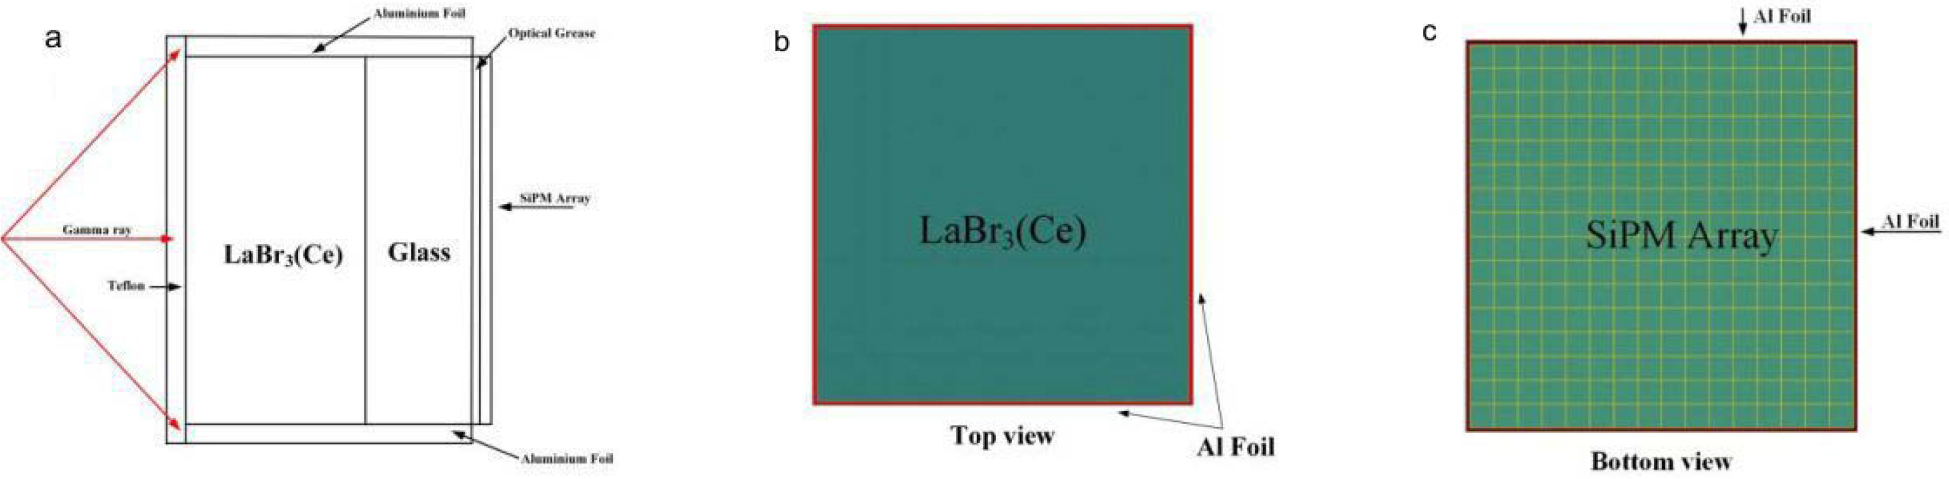
Fig. 1.
Geant4 detector model. (a) Detector construction. (b) Monolithic crystals. (c) SiPM array.
Table 1.
| Crystal | Density (g/cm3) | Melting point (°C) | Irradiation length/cm | Emission wavelength/ nm | Optical production (ph/MeV–1) | Decay time/ns | Energy resolution (@662 keV 137Cs) /% |
|---|---|---|---|---|---|---|---|
| NaI(Tl) | 3.67 | 651 | 2.59 | 410 | 40 000 | 230 | 6.5 |
| BGO | 7.13 | 1 050 | 1.12 | 480 | 3 600 | 300 | 20 |
| LSO(Ce) | 7.41 | 2 050 | 1.14 | 440 | 30 000 | 42 | 9.0 |
| BaF2 | 4.89 | 1 354 | 2.03 | 300/220 | 8 400/1 080 | 630/0.9 | 16 |
| LaCl3(Ce) | 3.90 | 875 | — | 350 | 50 000 | 24 | 3.1 |
| LaBr3(Ce) | 5.30 | 783 | — | 360 | 70 000 | 16 | 2.6 |
| CeBr3 | 5.20 | 732 | — | 380 | 60 000 | 17 | 4.0 |
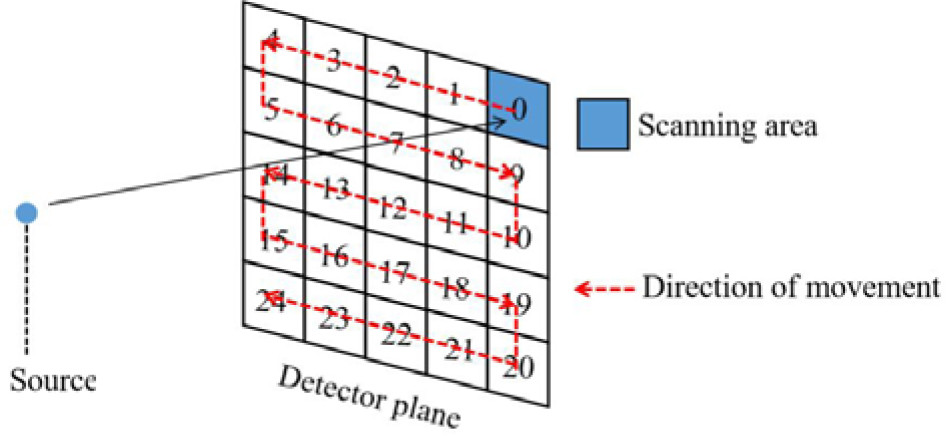
Fig. 2.
Schematic diagram of stepper scanning.
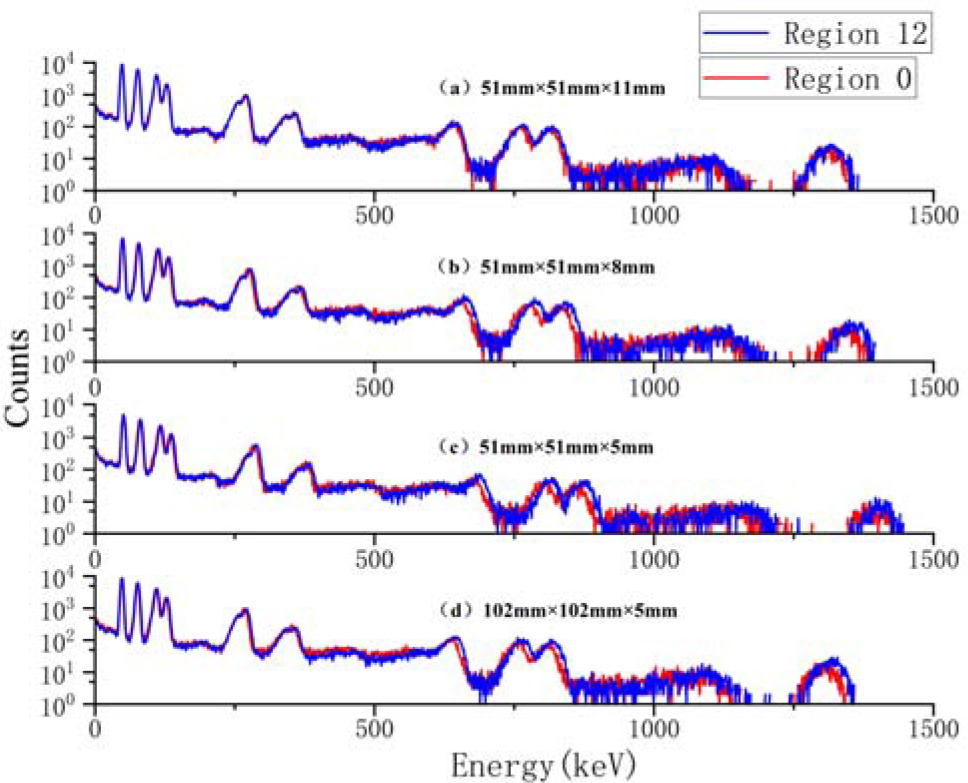
Fig. 3.
Energy spectra of the entire detector.
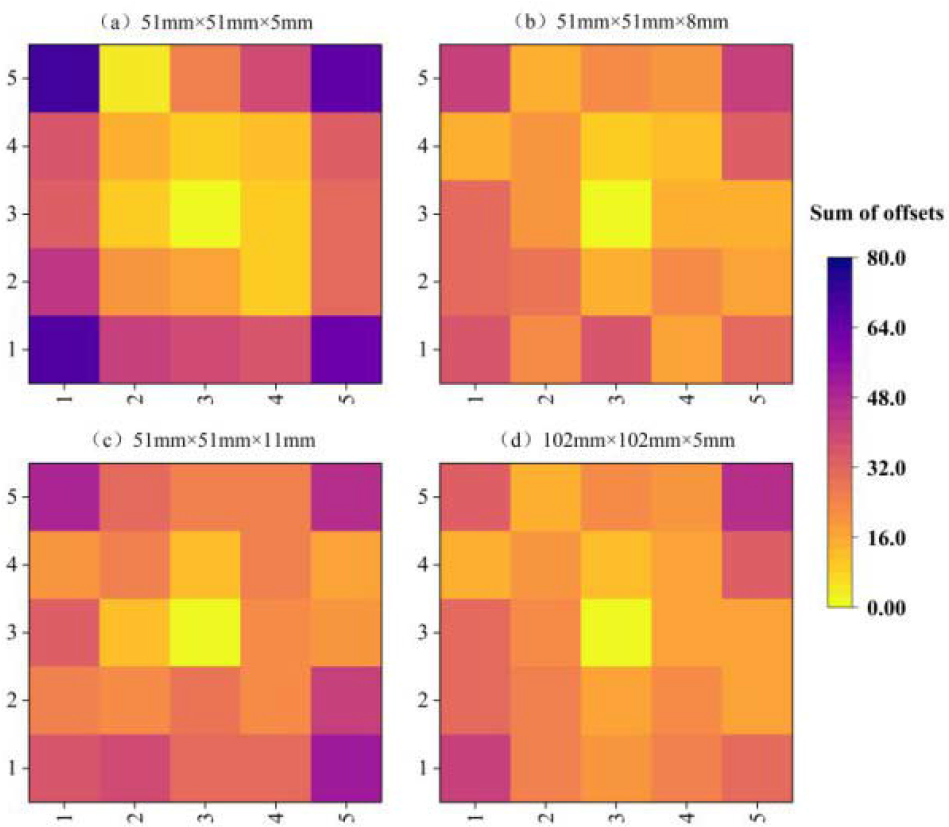
Fig. 4.
Mapping of the sum of peak offsets for different detector sizes.
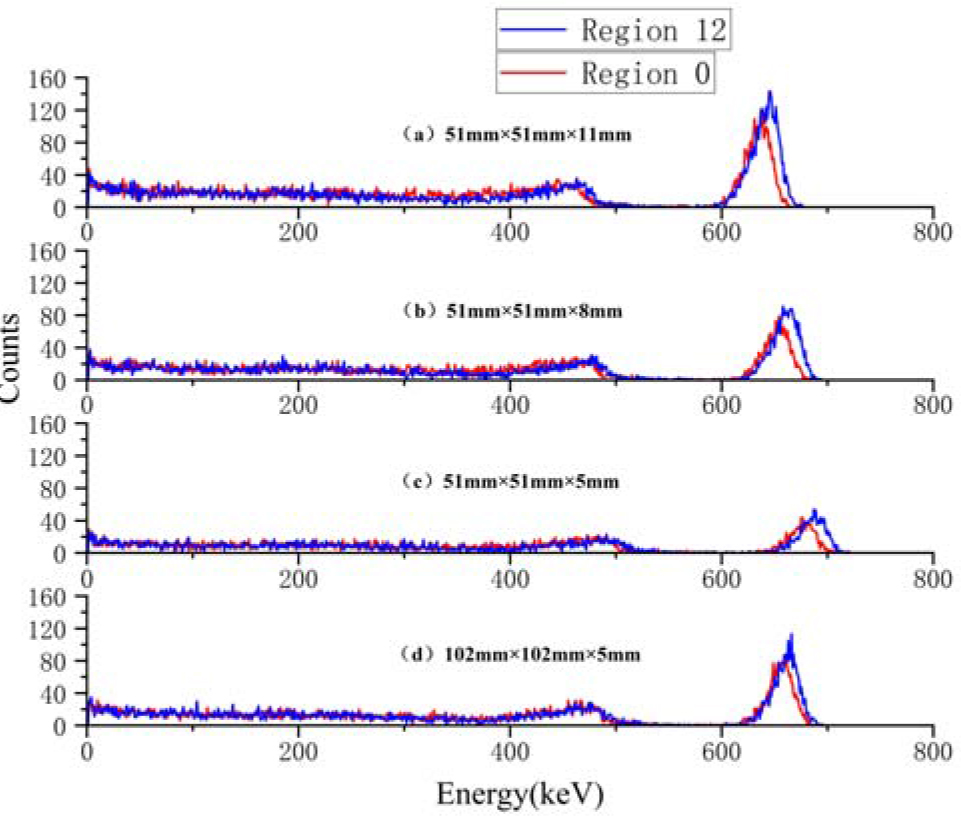
Fig. 5.
Comparison of Cs-137 662 keV energy spectra.
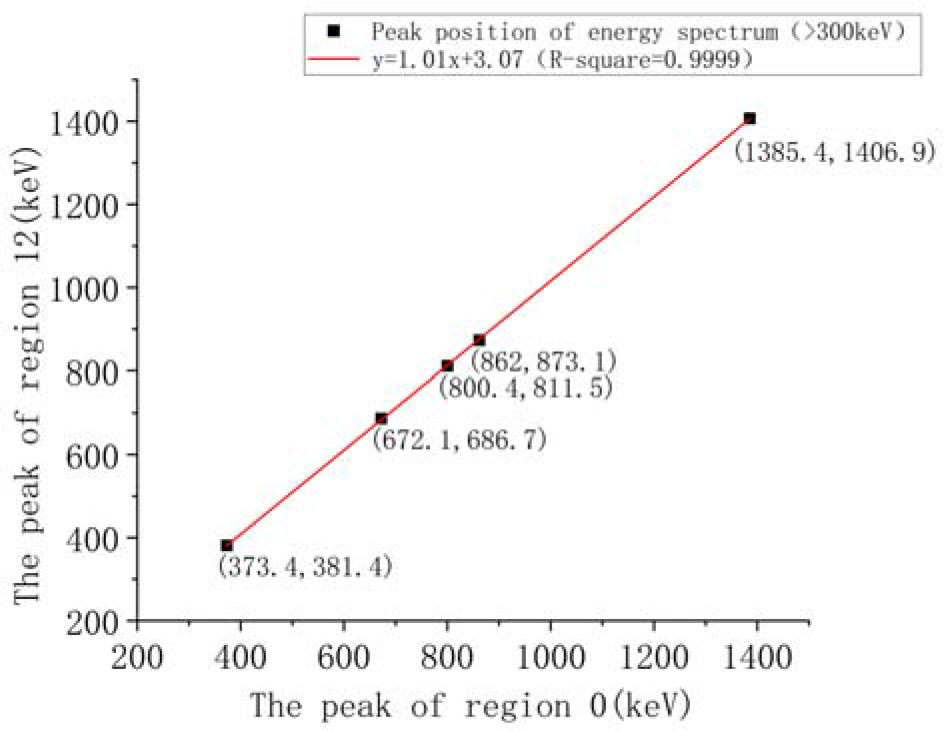
Fig. 6.
The peak position of the energy spectrum is linearly related to the peak position of the no. 12 (central) incident region of the 51 mm × 51 mm × 5 mm crystal in the no. 0 (edge) incident region.
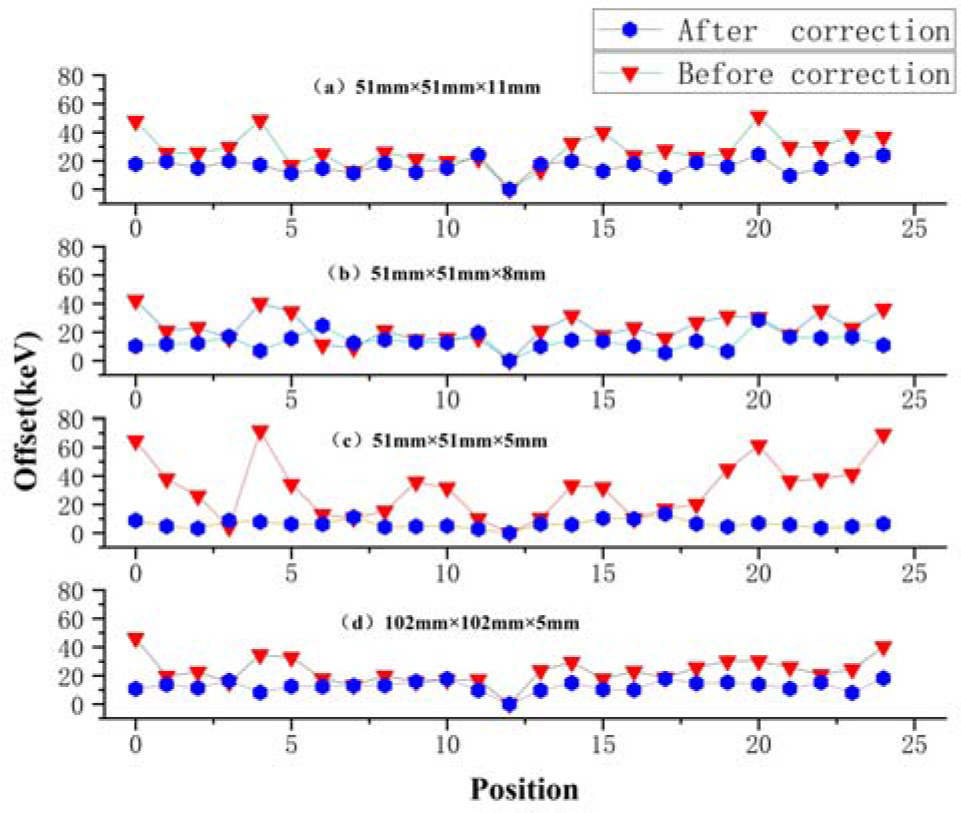
Fig. 7.
Plot of the sum of the peak offsets of the blocks in the different detector sizes with respect to the central position.
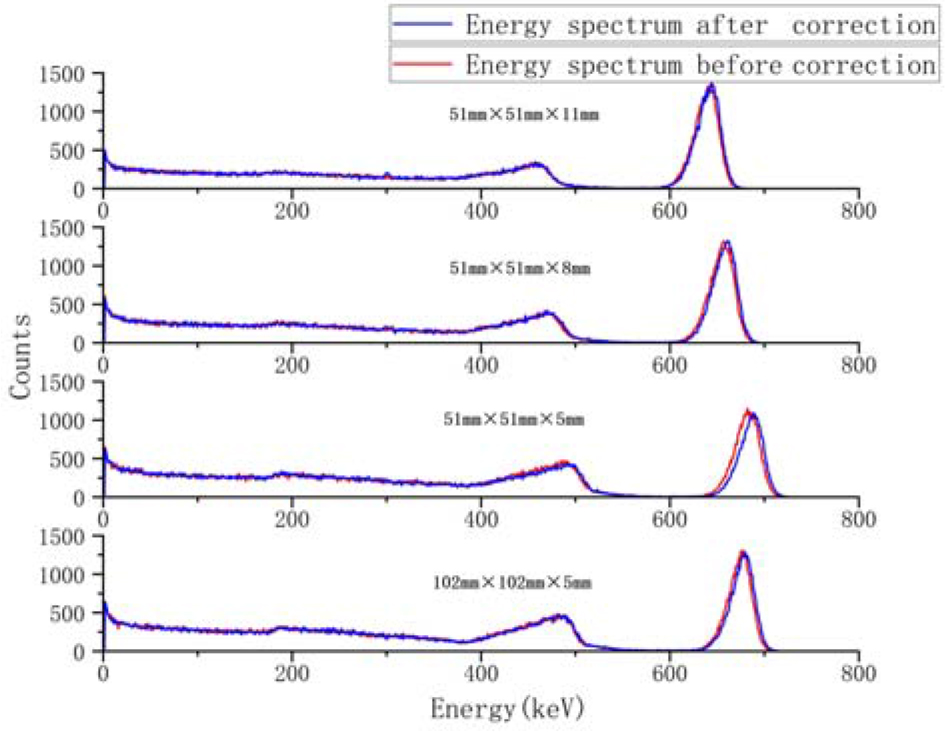
Fig. 8.
Comparison of energy resolution before and after correction for different detector sizes (Cs-137 point source).