
Fig. 1.
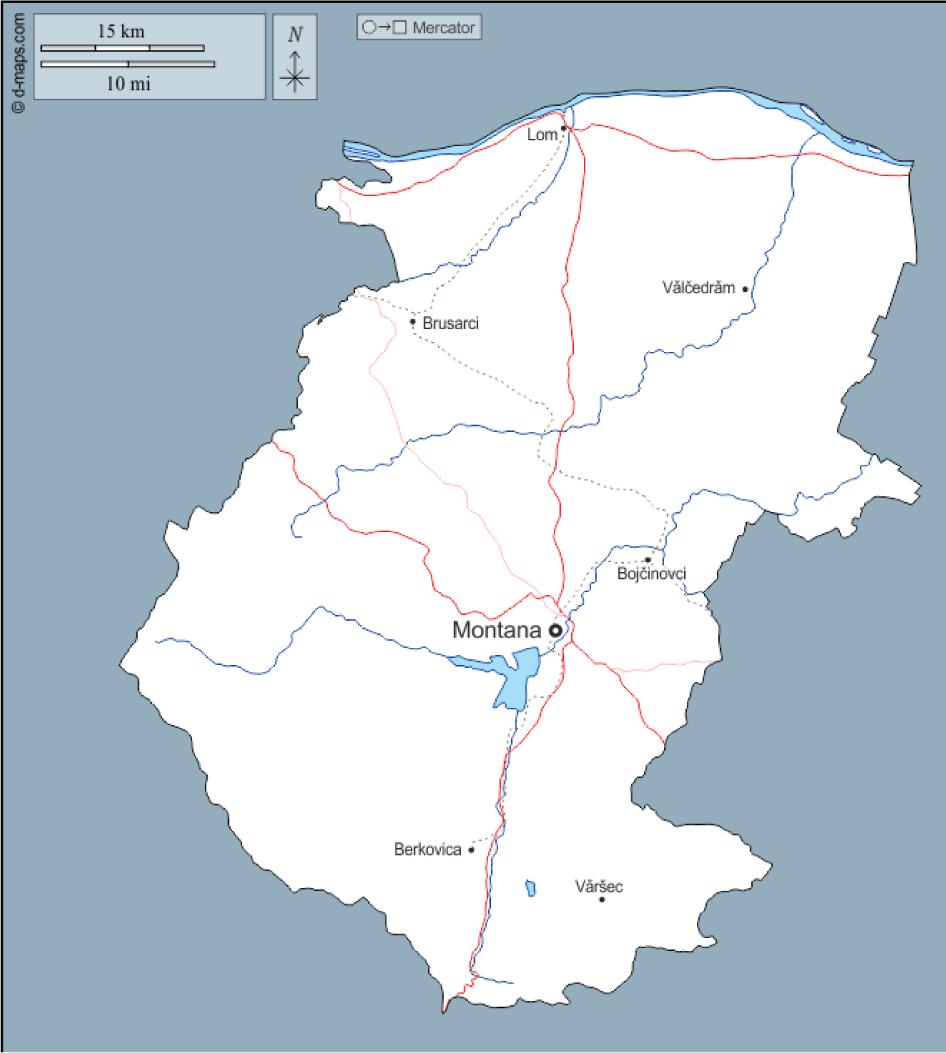
Fig. 2.
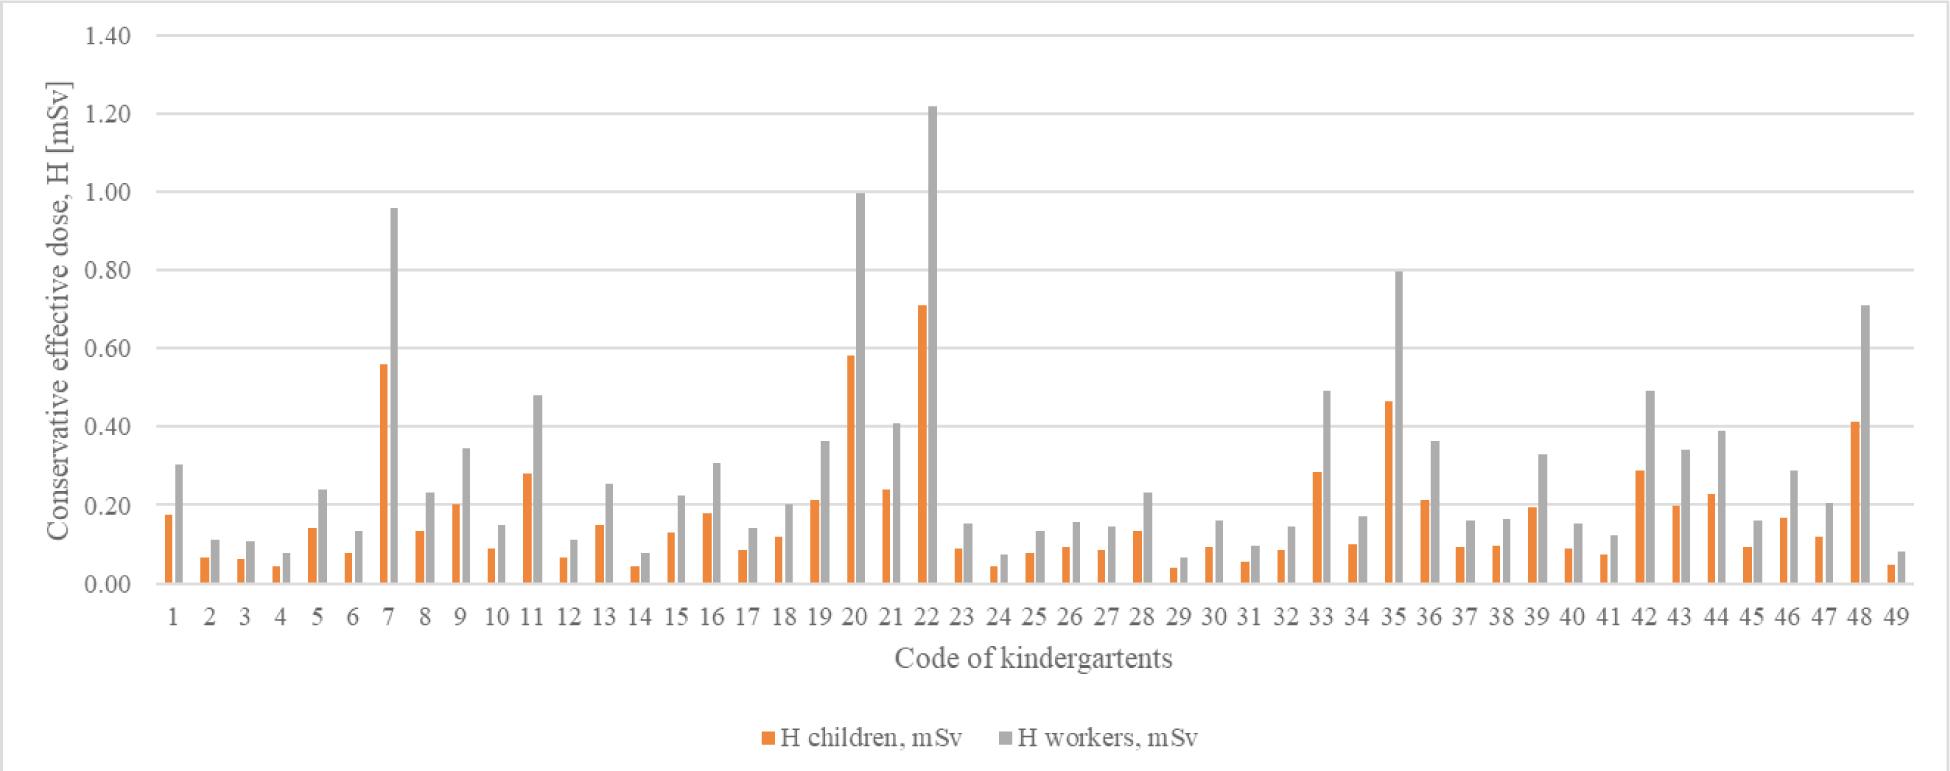
Fig. 3.
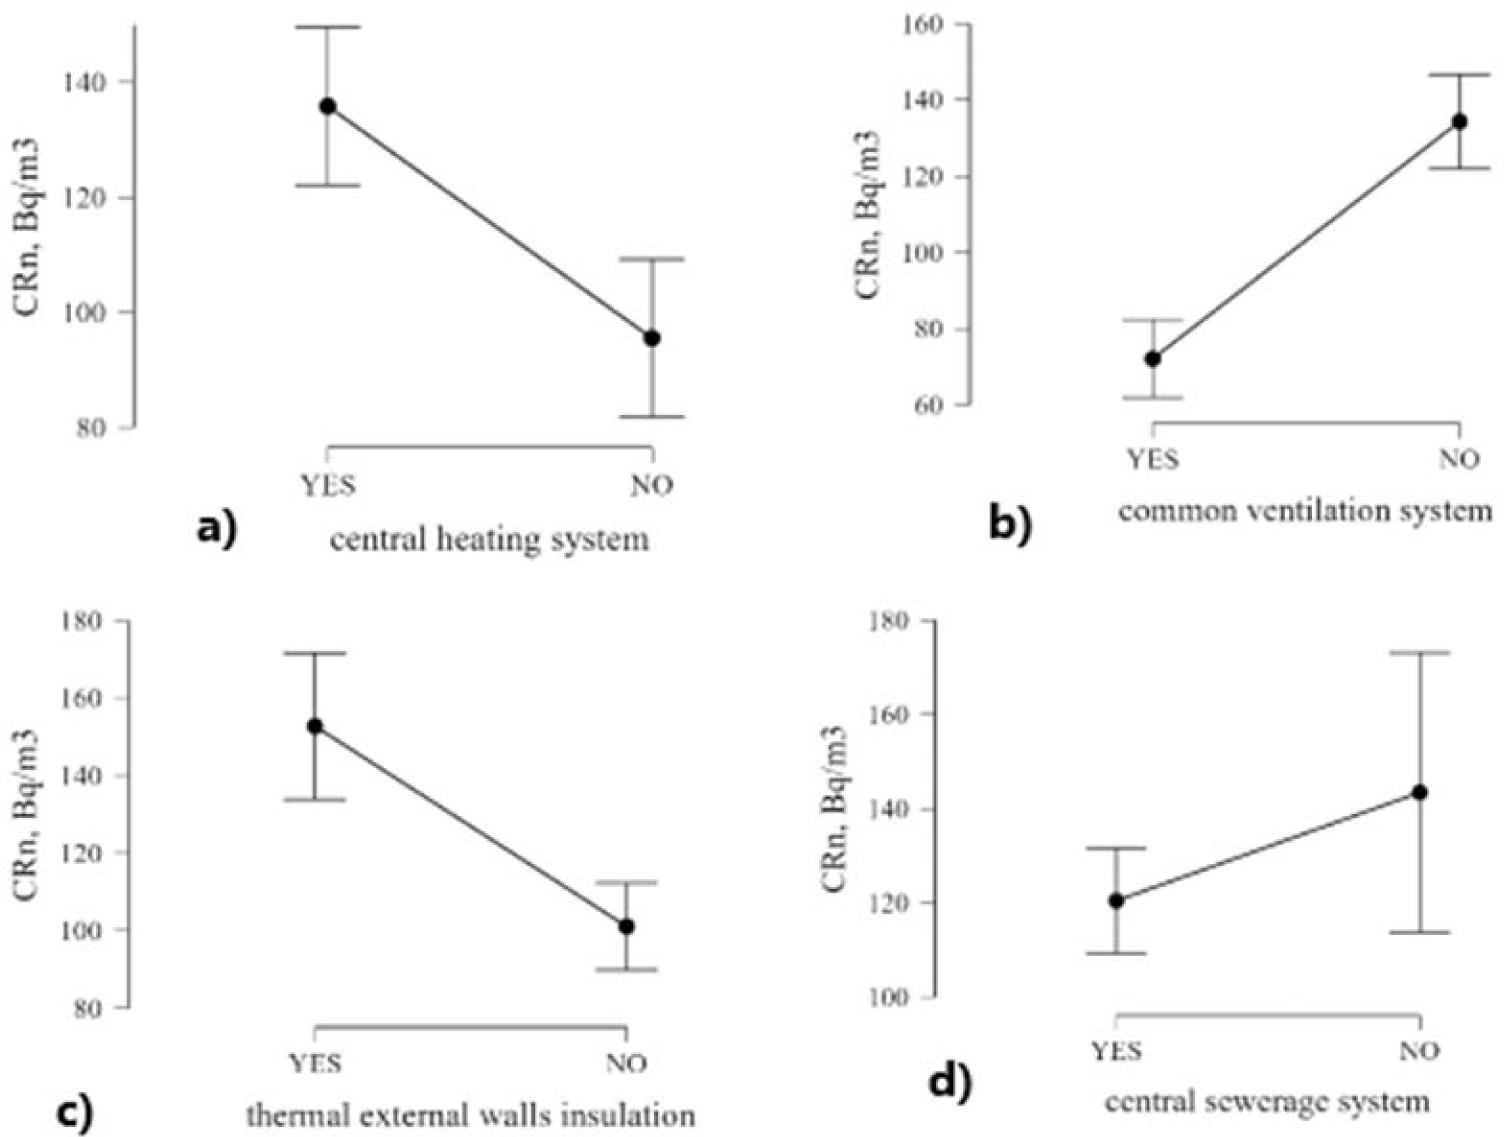
Descriptive statistics of indoor radon concentration by the common ventilation system, central heating system, thermal external walls insulation, and central sewerage system
| Statistic parameter | Common ventilation system | Central heating system | Thermal external walls insulation | Central sewerage system | ||||
|---|---|---|---|---|---|---|---|---|
| Yes | No | Yes | No | Yes | No | Yes | No | |
| Number | 87 | 515 | 445 | 157 | 282 | 320 | 474 | 128 |
| Median | 60 | 91 | 87 | 69 | 101 | 68 | 76 | 100.5 |
| Arithmetic mean | 72.1 | 134.3 | 135.9 | 95.5 | 152.8 | 101.1 | 120.4 | 143.4 |
| Standard deviation | 48.0 | 143.0 | 147.3 | 86.9 | 161.1 | 101.8 | 124.2 | 169.6 |
| Coefficient of variation | 0.67 | 1.06 | 1.08 | 0.91 | 1.05 | 1.01 | 1.03 | 1.18 |
| p-Value of Shapiro–Wilk | <0.001 | <0.001 | <0.001 | <0.001 | <0.001 | <0.001 | <0.001 | <0.001 |
| Minimum | 26 | 10 | 10 | 18 | 10 | 12 | 10 | 13 |
| Maximum | 317 | 1439 | 1439 | 519 | 1439 | 824 | 972 | 1439 |
Descriptive statistics of indoor radon concentration
| Parameter | CRn |
|---|---|
| Number of rooms | 602 |
| Arithmetic mean (Bq·m−3) | 125 |
| Standard deviation (Bq·m−3) | 135 |
| Median (Bq·m−3) | 84 |
| Minimum value (Bq·m−3) | 10 |
| Maximum value (Bq·m−3) | 1439 |
| Coefficient of variation (%) | 108 |
| Geometric mean (Bq·m−3) | 88 |
| Geometric standard deviation | 2.23 |
Descriptive statistics of indoor radon concentration by municipalities
| Municipalities | Number of premises | AM (Bq/m3) | SD (Bq/m3) | CV (%) | Mediana (Bq/m3) | Min. (Bq/m3) | Max. (Bq/m3) | Test Shapiro–Wilk (p) |
|---|---|---|---|---|---|---|---|---|
| Berkovitsa | 123 | 145 | 118.9 | 82 | 107 | 31 | 643 | 0.008 |
| Boychinovtsi | 27 | 200 | 177.9 | 89 | 110 | 31 | 669 | 0.135 |
| Brusartsi | 13 | 276 | 426.2 | 154 | 70 | 13 | 1439 | 0.152 |
| Vulchedrum | 122 | 96 | 96.4 | 100 | 70 | 12 | 824 | 0.165 |
| Varshets | 18 | 124 | 58.2 | 47 | 121 | 36 | 231 | 0.120 |
| Georgi Damyanovo | 20 | 70 | 17.9 | 25 | 64 | 45 | 113 | 0.051 |
| Lom | 89 | 73 | 62.9 | 86 | 56 | 18 | 429 | 0.011 |
| Medkovets | 18 | 246 | 240.4 | 98 | 146 | 54 | 853 | 0.162 |
| Montana | 158 | 130 | 124.6 | 96 | 96 | 10 | 972 | 0.053 |
| Chiprovtsi | 6 | 105 | 69.9 | 66 | 72 | 55 | 234 | 0.153 |
| Yakimovo | 8 | 130 | 134.6 | 104 | 64 | 44 | 380 | 0.012 |