
Table 1
The number of analysed plans according to calculation models
| Energy | Number of treatment plans |
|---|---|
| X6 MV | 152 |
| X15 MV | 128 |
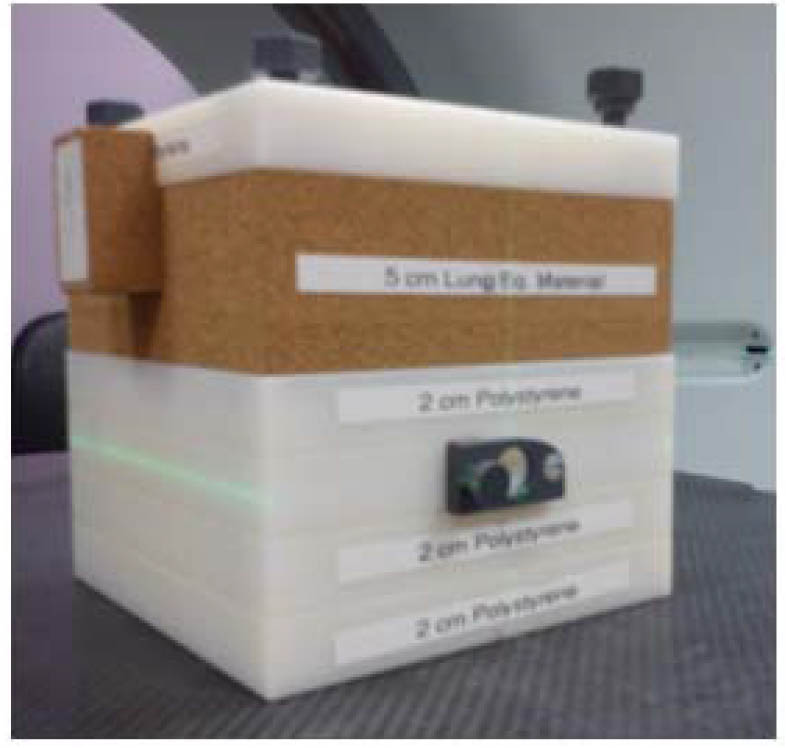
Fig. 1
Polystyrene/lung solid phantom.
Table 2
Geometries of treatment plans used for measurements
| No. | Number of fields | Gantry directions | Size of field (cm × cm) | Wedge | Shape of field |
|---|---|---|---|---|---|
| Polystyrene | |||||
| 1 | 1 | 0° | 3 × 3 | None | square |
| 2 | 1 | 0° | 8 × 8 | None | square |
| 3 | 3 | 0°, 90°, 270° | 8 × 8, 8 × 8, 8 × 8 | None | square |
| 4 | 3 | 0°, 70°, 290° | 8 × 8, 8 × 8, 8 × 8 | None | circular |
| 5 | 3 | 0°, 70°, 290° | 8 × 8, 8 × 8, 8 × 8 | none, 45 L, 45 R | circular |
| 6 | 3 | 0°, 70°, 290° | 8 × 8, 8 × 8, 8 × 8 | none, 45 OUT, 45 IN | circular |
| Polystyrene with bone equivalent material | |||||
| 7 | 1 | 0° | 3 × 3 | None | square |
| 8 | 1 | 0° | 8 × 8 | None | square |
| 9 | 3 | 0°, 90°, 270° | 8 × 8, 10 × 8, 10 × 8 | None | square |
| 10 | 3 | 0°, 45°, 315° | 8 × 8, 9.5 × 8, 9.5 × 8 | None | circular |
| 11 | 3 | 0°, 45°, 315° | 8 × 8, 9 × 8, 9 × 8 | none, 45 L, 45 R | circular |
| 12 | 3 | 0°, 45°, 315° | 8 × 8, 8 × 9, 8 × 9 | none, 45 OUT, 45 IN | circular |
| Polystyrene with lung equivalent material | |||||
| 13 | 1 | 0° | 3 × 3 | None | square |
| 14 | 1 | 0° | 8 × 8 | None | square |
| 15 | 3 | 0°, 90°, 270° | 8 × 8, 9.5 × 8, 9.5 × 8 | None | square |
| 16 | 3 | 0°, 50°, 310° | 8 × 8, 9 × 8, 9 × 8 | None | circular |
| 17 | 3 | 0°, 60°, 300° | 8 × 8, 9 × 8, 9 × 8 | none, 45 L, 45 R | circular |
| 18 | 3 | 0°, 50°, 310° | 8 × 8, 8 × 9, 8 × 9 | none, 45 OUT, 45 IN | circular |
Table 3
Differences between Eclipse and OMP calculations of mean doses to the PTV
| Energy | Cases | Average (%) ± STD (%) | Range (%) | p-value (p <0.001) |
|---|---|---|---|---|
| X6 MV | 152 | 1.4 ± 1.0 | −3.4, 6.0 | 0.0 |
| X15 MV | 128 | 2.5 ± 0.6 | −0.2, 4.5 | 0.0 |
Table 4
Differences between Eclipse and OMP calculations of dose to isocenter
| Energy | Cases | Average (%) ± STD (%) | Range (%) | p-value (p <0.001) |
|---|---|---|---|---|
| X6 MV | 152 | 1.3 ± 1.9 | −2.7, 10.6 | 0.0 |
| X15 MV | 128 | 2.1 ± 1.0 | −0.7, 5.6 | 0.0 |
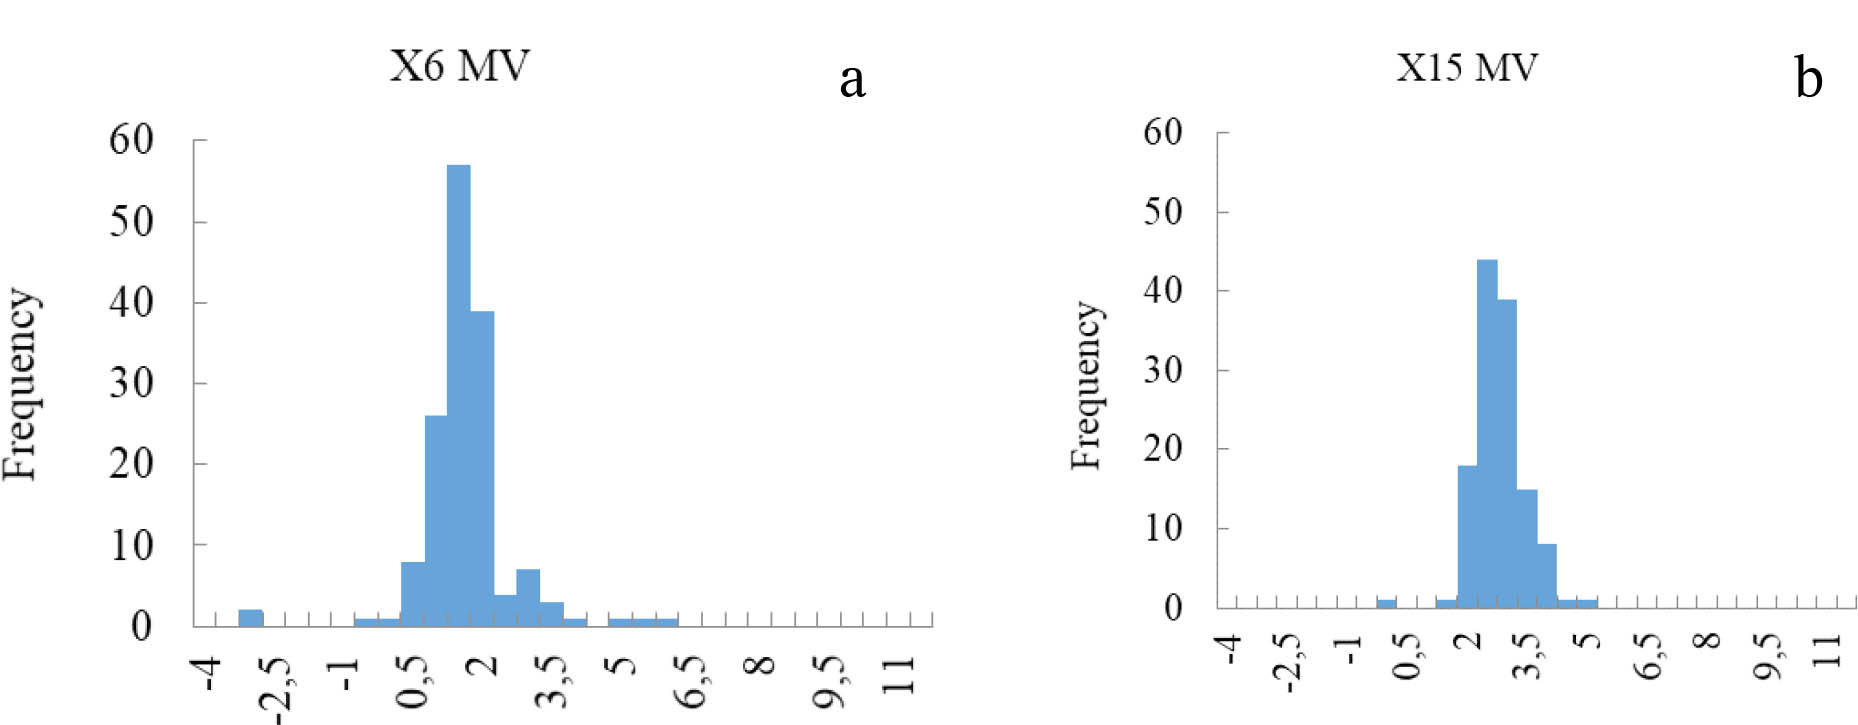
Fig. 2
Frequency histograms of differences between Eclipse and OMP calculations of mean doses to the PTV for 6 MV (a) and 15 MV (b).
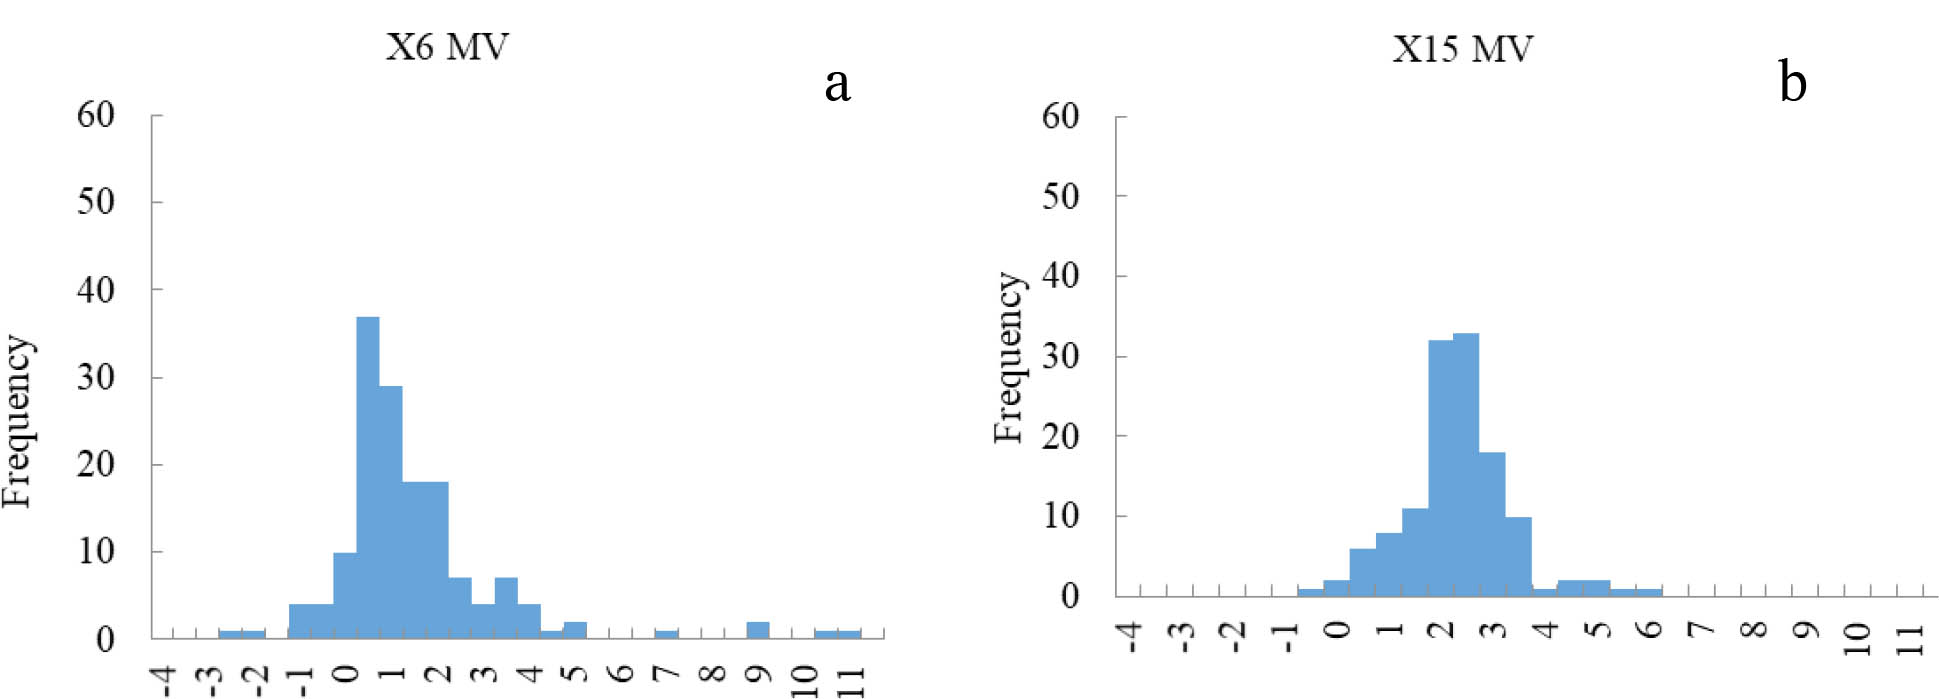
Fig. 3
Frequency histograms of differences between Eclipse and OMP calculations of doses to isocenter for 6 MV (a) and 15 MV beams (b).
Table 5
Statistical summary of differences between Eclipse and OMP calculation with and without inhomogeneity correction
| Energy | Plans | Average (%) ± STD (%) | Range (%) | p-value (p <0.001) |
|---|---|---|---|---|
| Mean dose with inhomogeneity correction | ||||
| X6 MV | 24 | 1.3 ± 0.5 | 0.1, 2.1 | 0.000 |
| X15 MV | 24 | 2.6 ± 0.6 | 1.6, 4.5 | 0.000 |
| Dose at isocenter with inhomogeneity correction | ||||
| X6 MV | 24 | 1.1 ± 1.5 | −1.0, 6.8 | 0.000 |
| X15 MV | 24 | 2.2 ± 1.1 | 0.4, 5.2 | 0.000 |
| Mean dose without inhomogeneity correction | ||||
| X6 MV | 24 | 0.4 ± 0.4 | −0.8, 1.0 | 0.000 |
| X15 MV | 24 | 1.0 ± 0.3 | 0.5, 1.6 | 0.000 |
| Dose in isocenter without inhomogeneity correction | ||||
| X6 MV | 24 | 0.2 ± 0.7 | −1.0, 2.4 | 0.110 |
| X15 MV | 24 | 0.5 ± 0.9 | −2.1, 2.8 | 0.001 |
Table 6
The discrepancy between Eclipse and OMP calculations and measurements for various beams geometry
| No. | X6 MV | X15 MV | ||
|---|---|---|---|---|
| Polystyrene phantom | ||||
| 1 | 2.2 | 0.3 | 2.2 | 0.8 |
| 2 | 2.2 | −0.5 | 2.8 | −0.4 |
| 3 | 2.0 | 0.2 | 3.0 | 0.4 |
| 4 | 2.4 | 0.4 | 2.8 | 0.1 |
| 5 | 2.1 | −0.1 | 2.1 | −0.3 |
| 6 | 2.1 | −0.1 | 2.3 | −0.4 |
| Polystyrene with bone equivalent material | ||||
| 7 | 2.5 | 1.4 | 2.5 | 1.4 |
| 8 | 2.3 | 0.5 | 3.6 | 0.8 |
| 9 | 2.6 | 0.6 | 2.6 | −0.1 |
| 10 | 2.8 | 0.8 | 4.0 | 1.3 |
| 11 | 2.8 | 0.8 | 3.5 | 1.0 |
| 12 | 2.4 | 0.6 | 3.4 | 0.8 |
| Polystyrene with lung equivalent material | ||||
| 13 | 2.9 | 1.3 | 1.5 | 0.7 |
| 14 | 3.3 | −0.3 | 3.1 | −0.4 |
| 15 | 1.7 | −0.2 | 2.3 | −0.2 |
| 16 | 2.9 | 1.4 | 2.9 | 0.8 |
| 17 | 1.8 | 0.6 | 2.2 | 0.3 |
| 18 | 1.6 | 0.2 | 2.3 | 0.2 |