

Table 1
Content categories, description, and Krippendorff’s alpha (α)
| Content category | Description | Krippendorff’s alpha (α) |
|---|---|---|
| Information provision | Posts delivering factual updates, policy information, public guidance, or explanations of decisions, usually without soliciting interaction. | 0.92 |
| Input-seeking | Posts inviting questions, opinions, feedback, experiences, or participation in limited interaction. | 0.88 |
| Politics | Posts mobilising support, presenting political priorities, criticising opponents, defending contested choices, claiming credit, or attributing responsibility. | 0.84 |
| Symbolic presentation | Posts constructing or maintaining a positive public image through gratitude, empathy, competence, proximity, authenticity, or relatability. | 0.79 |
[i] Comments: Categories are based on the typology developed by DePaula and colleagues (2018). Categories are not mutually exclusive.
Table 2
Distribution of communication types by platform
| Content category | Facebook, n (%) | Instagram, n (%) |
|---|---|---|
| Information provision | 394 (21.9) | 125 (21.0) |
| Input-seeking | 316 (17.5) | 10 (1.7) |
| Politics | 1,381 (76.6) | 97 (16.3) |
| Symbolic presentation | 1,218 (67.6) | 266 (44.7) |
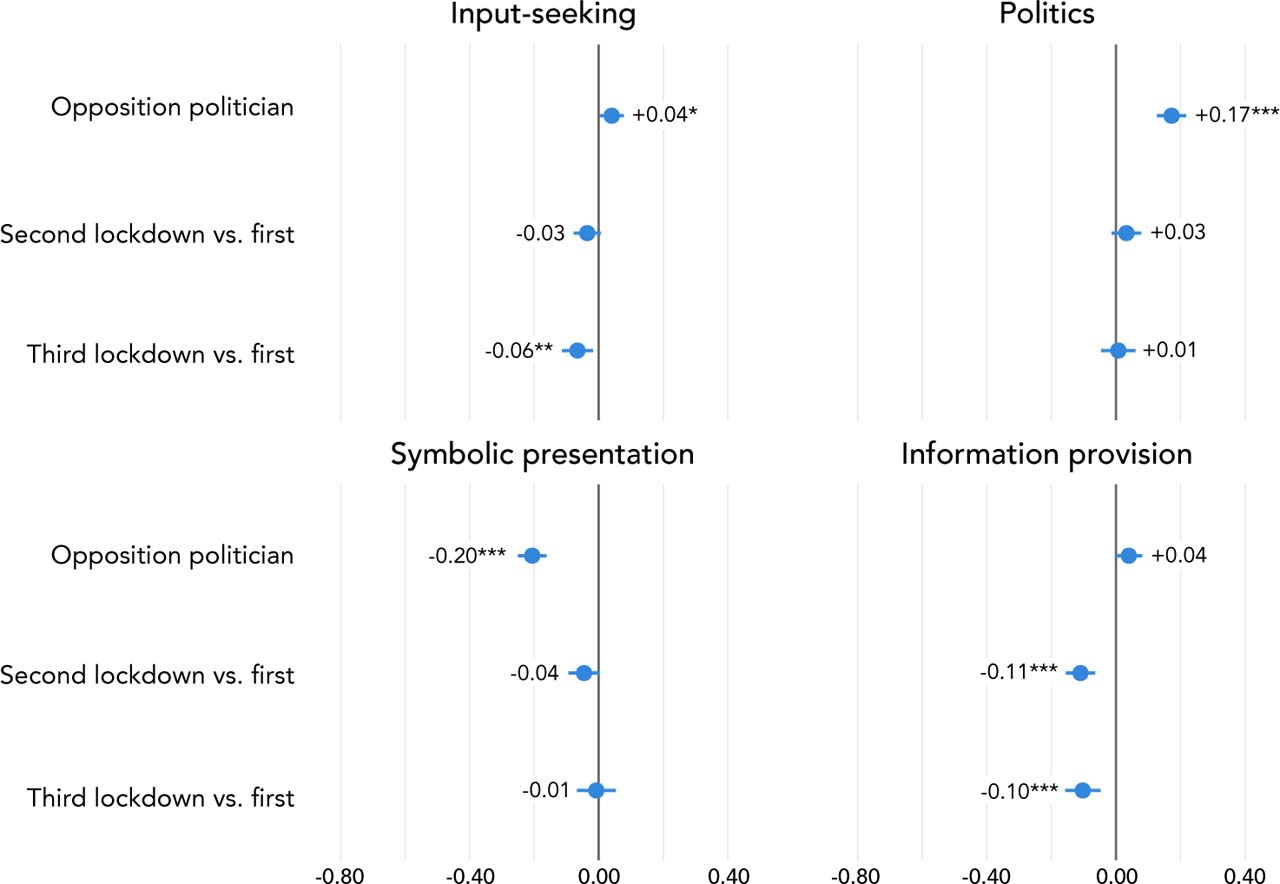
Figure 1
Facebook models for communication types across lockdown periods (Coefficient estimate)
Comments: *p < .05, **p < .01, ***p < .001. The figure shows coefficient estimates from Facebook-specific linear probability models. Outcomes are post-level binary indicators of whether each communication type appears in a post. Models include lockdown period, government or opposition status, and whether the post is Covid-19 related. Coefficients can be interpreted as percentage-point differences relative to the relevant reference categories: posts by party leaders from governing parties, posts from the first lockdown, and posts not coded as Covid-19 related. Robust standard errors are clustered by party leader. Blue points indicate coefficient estimates, and horizontal bars represent 95 per cent confidence intervals.
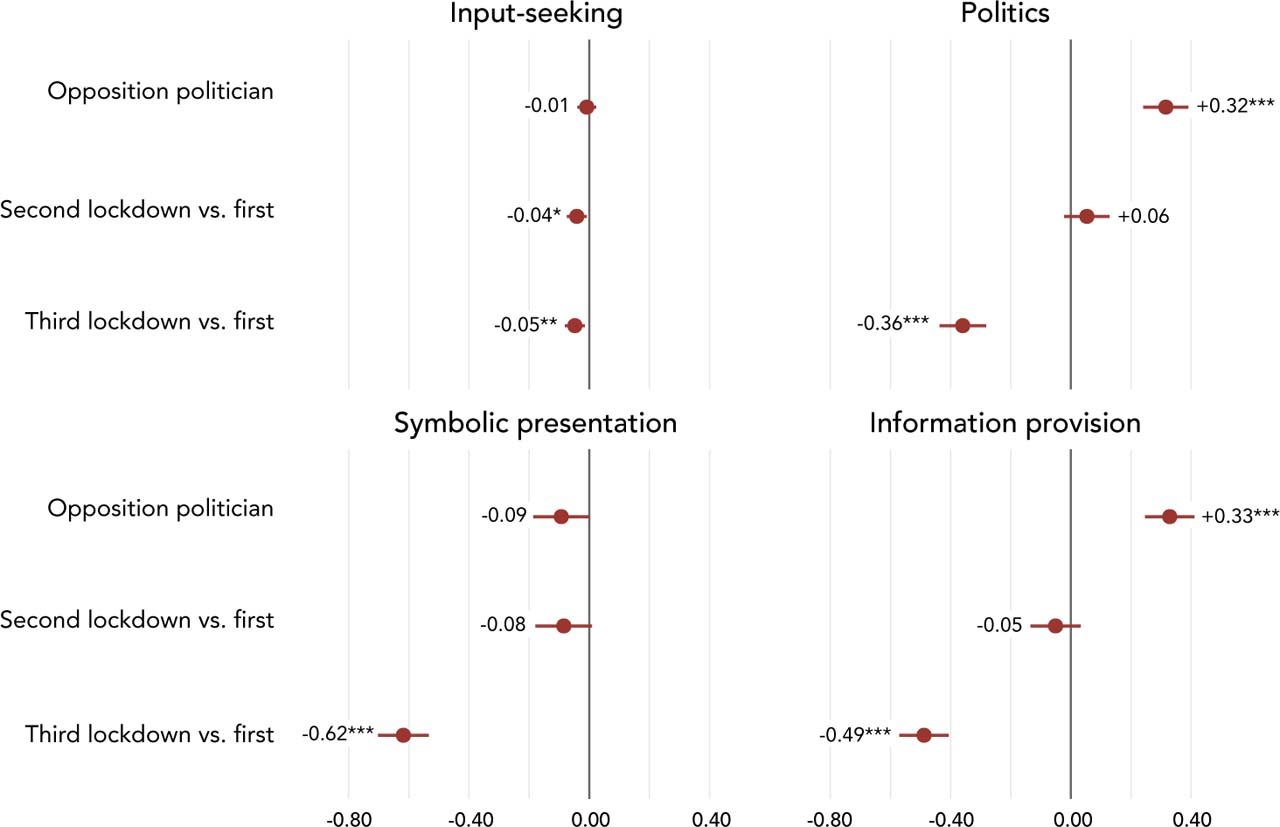
Figure 2
Instagram models for communication types across lockdown periods (Coefficient estimate)
Comments: *p < .05, **p < .01, ***p < .001. The figure shows coefficient estimates from Instagram-specific linear probability models. Outcomes are post-level binary indicators of whether each communication type appears in a post. Models include lockdown period, government or opposition status, and whether the post is Covid-19 related. Coefficients can be interpreted as percentage-point differences relative to the relevant reference categories: posts by party leaders from governing parties, posts from the first lockdown, and posts not coded as Covid-19 related. Robust standard errors are clustered by party leader. Red points indicate coefficient estimates, and horizontal bars represent 95 per cent confidence intervals.
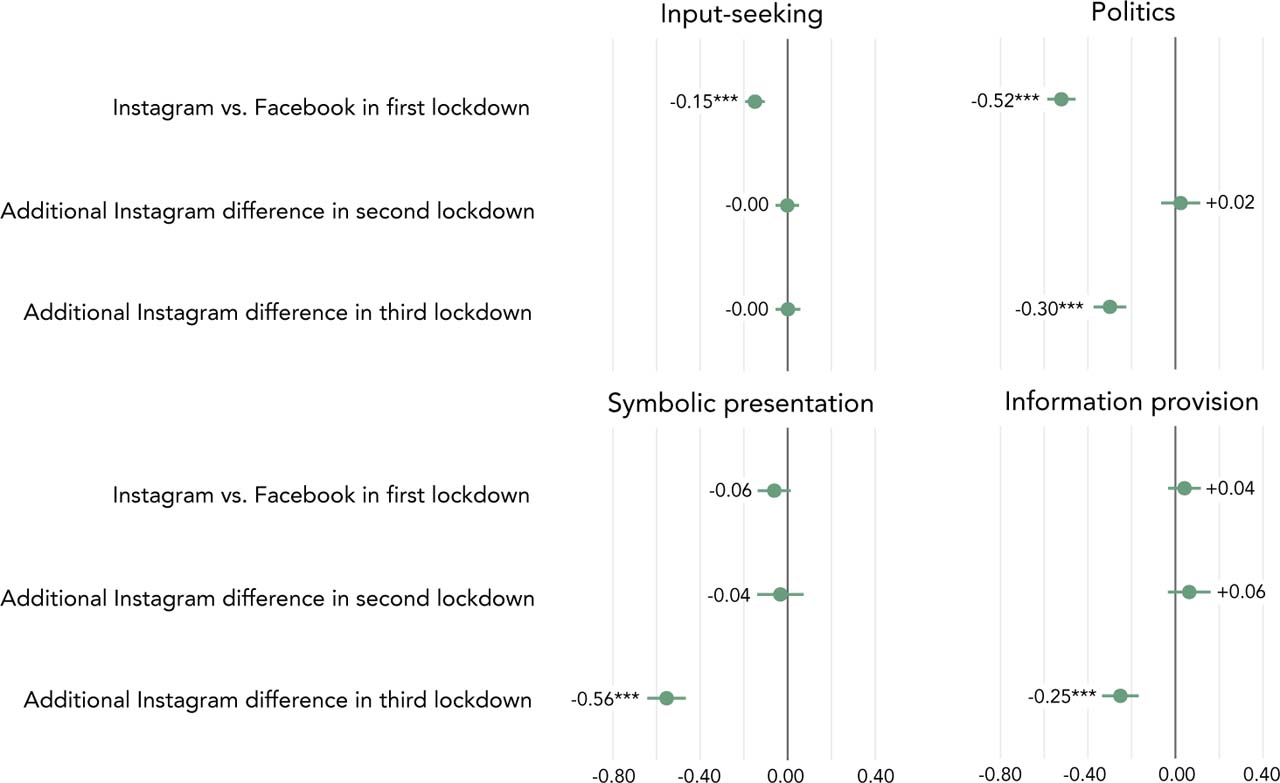
Figure 3
Interaction effects for platform and lockdown period (Interaction coefficient)
Comments: *p < .05, **p < .01, ***p < .001. The figure shows coefficient estimates from linear probability models with platform-by-lockdown interaction terms. Outcomes are post-level binary indicators of whether each communication type appears in a post. Models include lockdown period, platform, government or opposition status, whether the post is Covid-19 related, and platform-by-lockdown interactions. Coefficients can be interpreted as percentage-point differences. The Instagram coefficient estimates the conditional difference between Instagram and Facebook during the first lockdown. The interaction terms estimate whether this Instagram– Facebook difference changed in the second or third lockdown relative to the first lockdown. Robust standard errors are clustered by party leader. Point estimates are shown with horizontal bars representing 95 per cent confidence intervals.