Figure 1
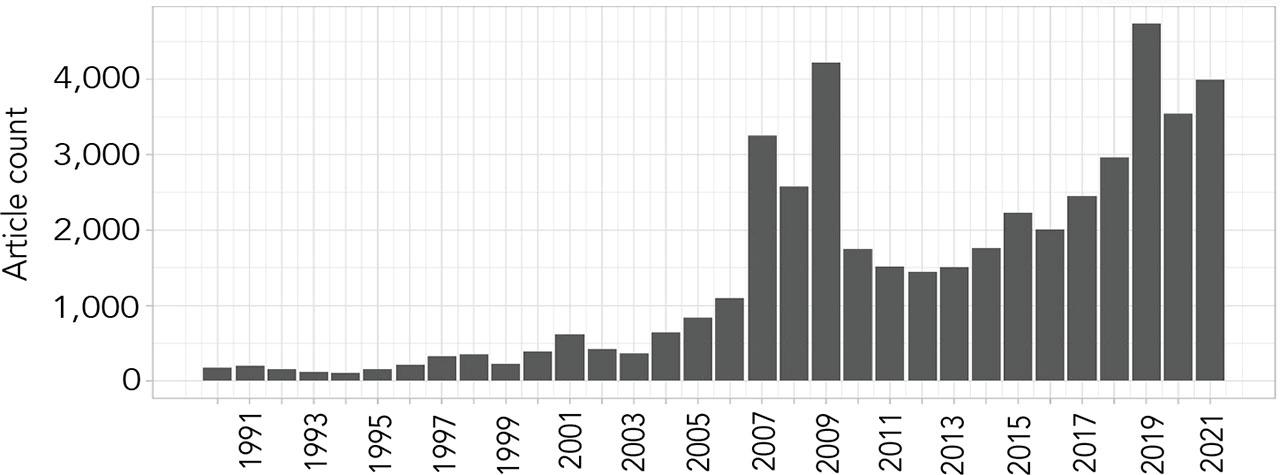
Figure 2
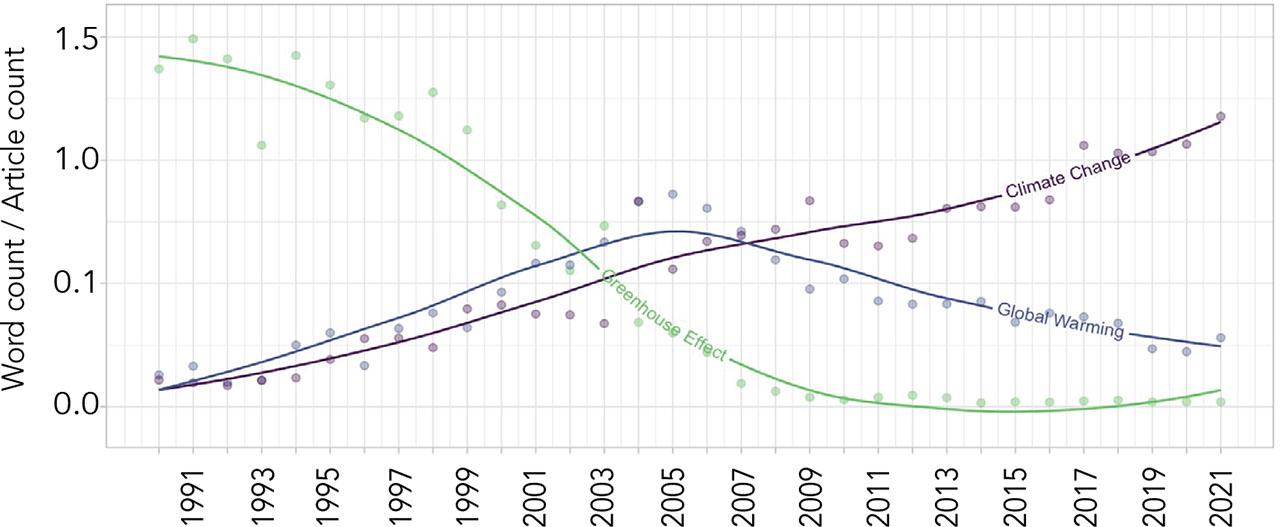
Figure 3
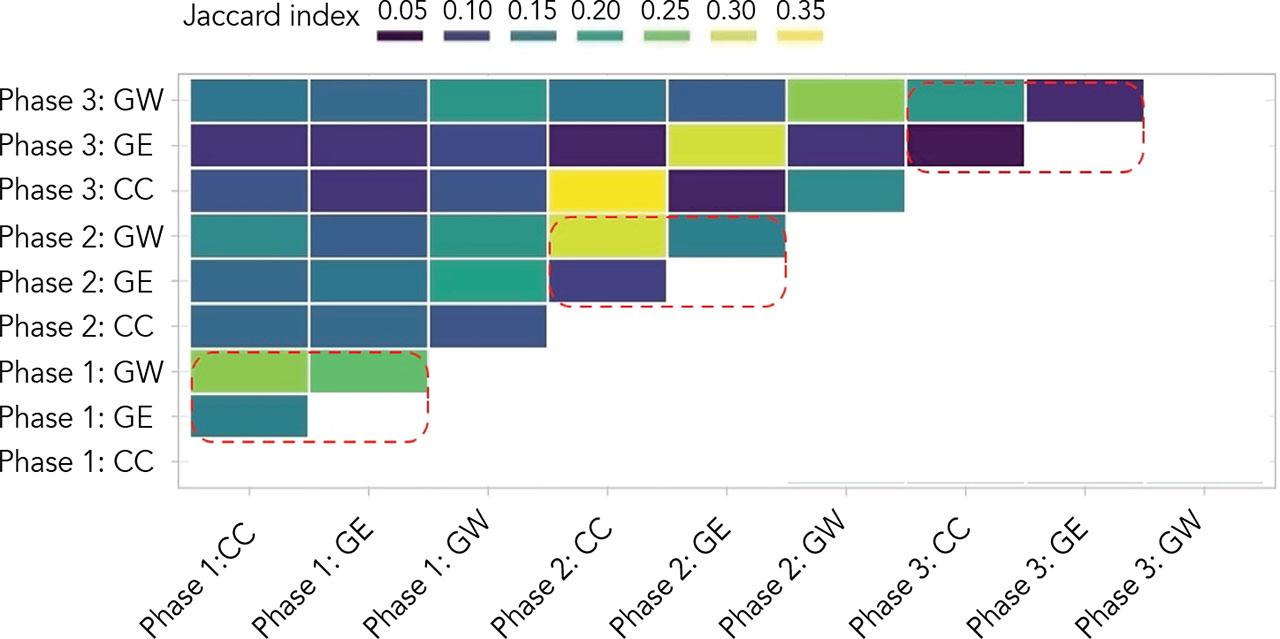
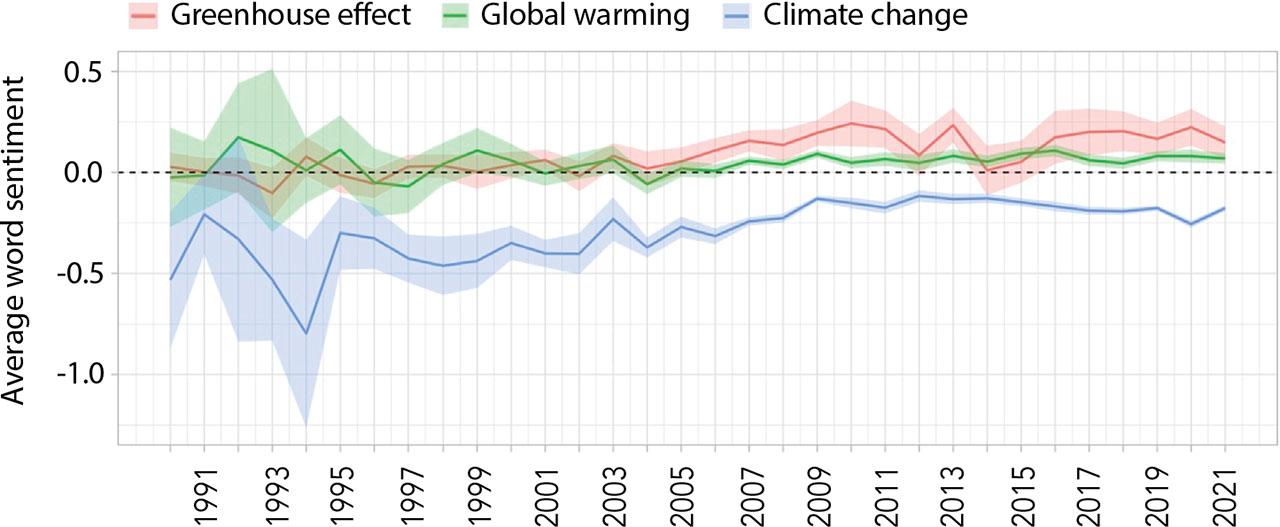
Figure 4
Three phases of sampling period
| 1. (1990–2000) | 2. (2001–2010) | 3. (2011–2021) | ||||||
|---|---|---|---|---|---|---|---|---|
|
|
| ||||||
| GE | GW | CC | GE | GW | CC | GE | GW | CC |
|
|
|
|
|
|
|
|
|


| 1. (1990–2000) | 2. (2001–2010) | 3. (2011–2021) | ||||||
|---|---|---|---|---|---|---|---|---|
|
|
| ||||||
| GE | GW | CC | GE | GW | CC | GE | GW | CC |
|
|
|
|
|
|
|
|
|
© 2026 Mikkel Fugl Eskjær, Florian Meier, published by University of Gothenburg Nordicom
This work is licensed under the Creative Commons Attribution-NonCommercial-NoDerivatives 4.0 License.