

Table 1
Search dimensions and strings
| Search dimension | Search string |
|---|---|
| Media AND | media OR communication OR film* OR movie* OR documentar* OR broadcast* OR television OR radio OR social media OR SNS OR internet OR online OR journalism OR news* OR blog* OR website* OR archive* |
| Past AND | memor* OR histor* OR heritage OR rememb* OR commemorat* OR mnemonic OR nostalgi* OR past |
| Country or region | Scandinavia* OR Nordic* OR Denmark OR Danish OR Norway OR Norwegian OR Finland OR Finnish OR Iceland* OR Sweden OR Swedish OR Åland OR Greenland* OR Faroe OR Bouvet Island OR Jan Mayen OR Svalbard OR Sápmi |
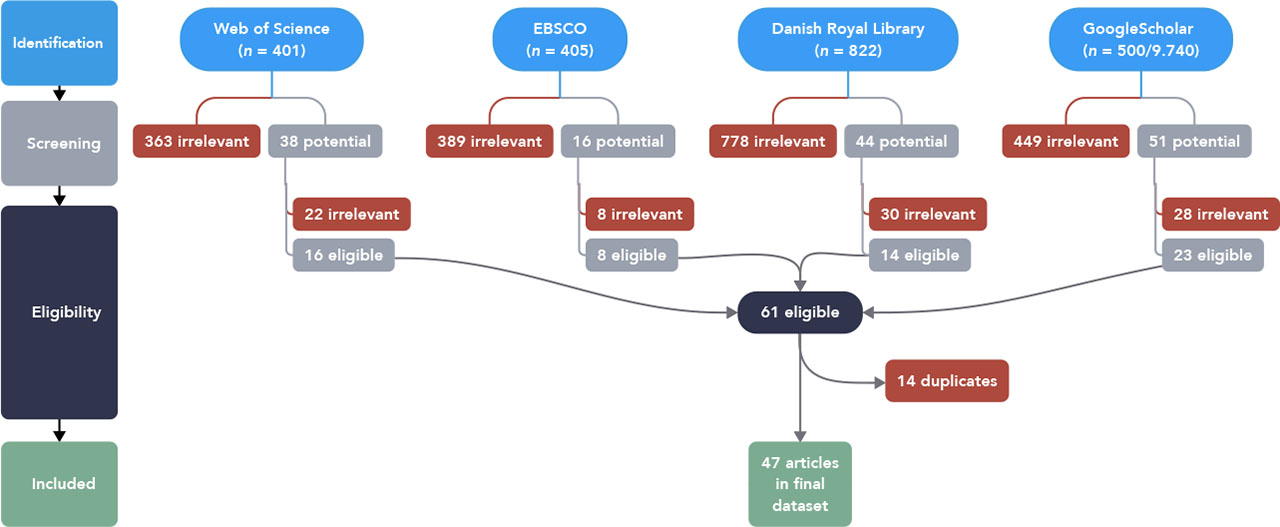
Figure 1
Literature sampling PRISMA flowchart illustrating the selection process
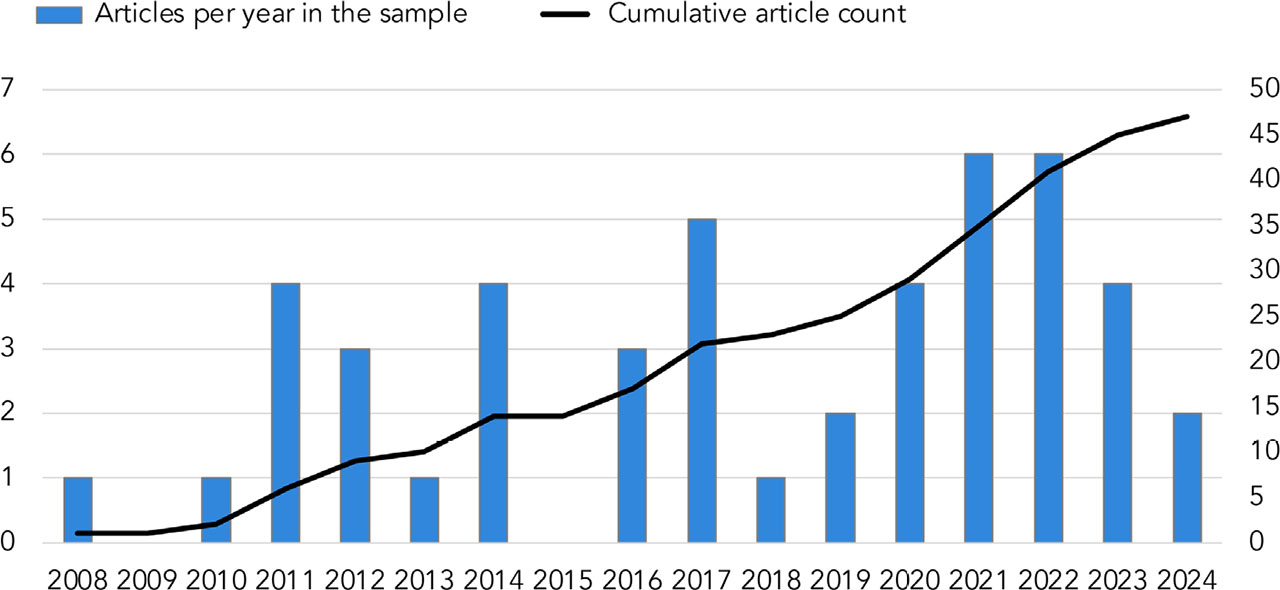
Figure 2
Absolute frequency of sampled journal articles per year and cumulated, 2008–2024
Comments: n = 47.
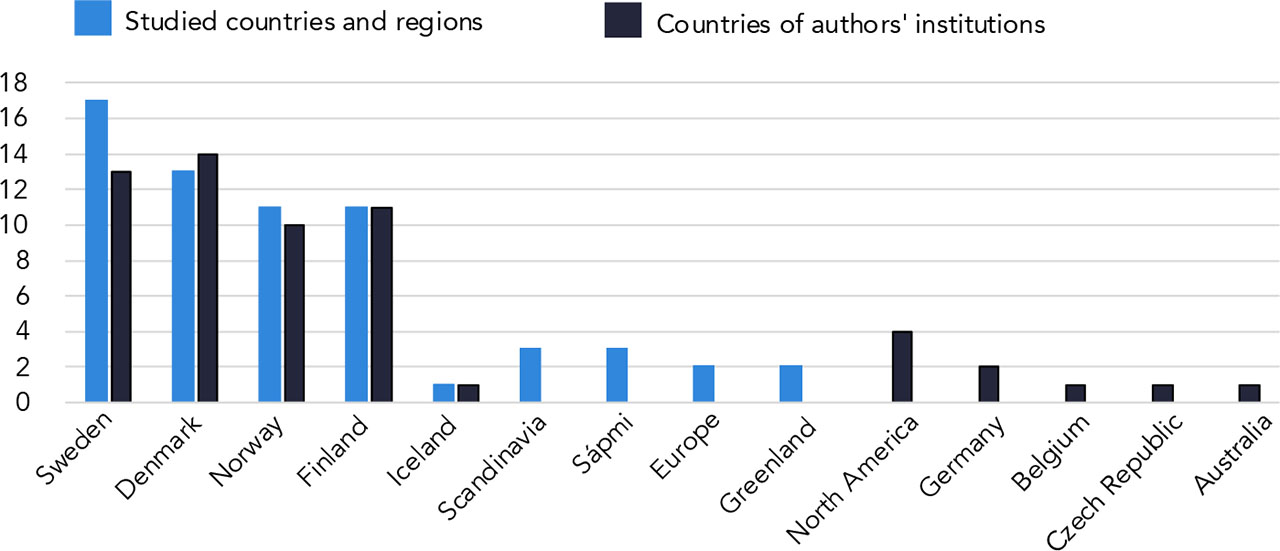
Figure 3
Absolute frequency of studied countries and regions and countries of authors’ institutions in the sampled journal articles
Comments: n = 47.
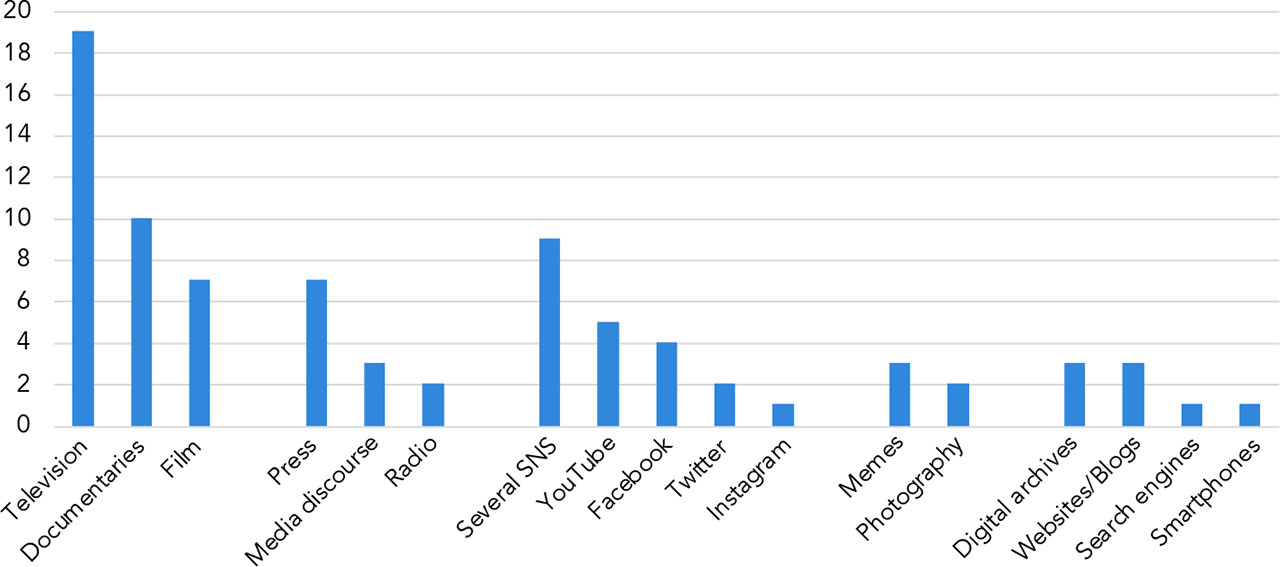
Figure 4
Absolute frequency of media studied or prominently discussed in the sampled journal articles
Comments: n = 47.
Table 2
List of methodologies and methods used in the sampled journal articles
| Methods | Articles |
|---|---|
| Qualitative audiovisual media analysis | 13 |
| Qualitative content analysis | 11 |
| (Critical) discourse analysis | 8 |
| Archive analysis | 3 |
| Historical analysis | 3 |
| Interview study | 3 |
| Quantitative content analysis | 2 |
| Quantitative SNS metadata analysis | 2 |
| Online ethnography | 2 |
| Ethnography | 1 |
| Focus groups | 1 |
| Digital epidemiography | 1 |
| Total | 47 |
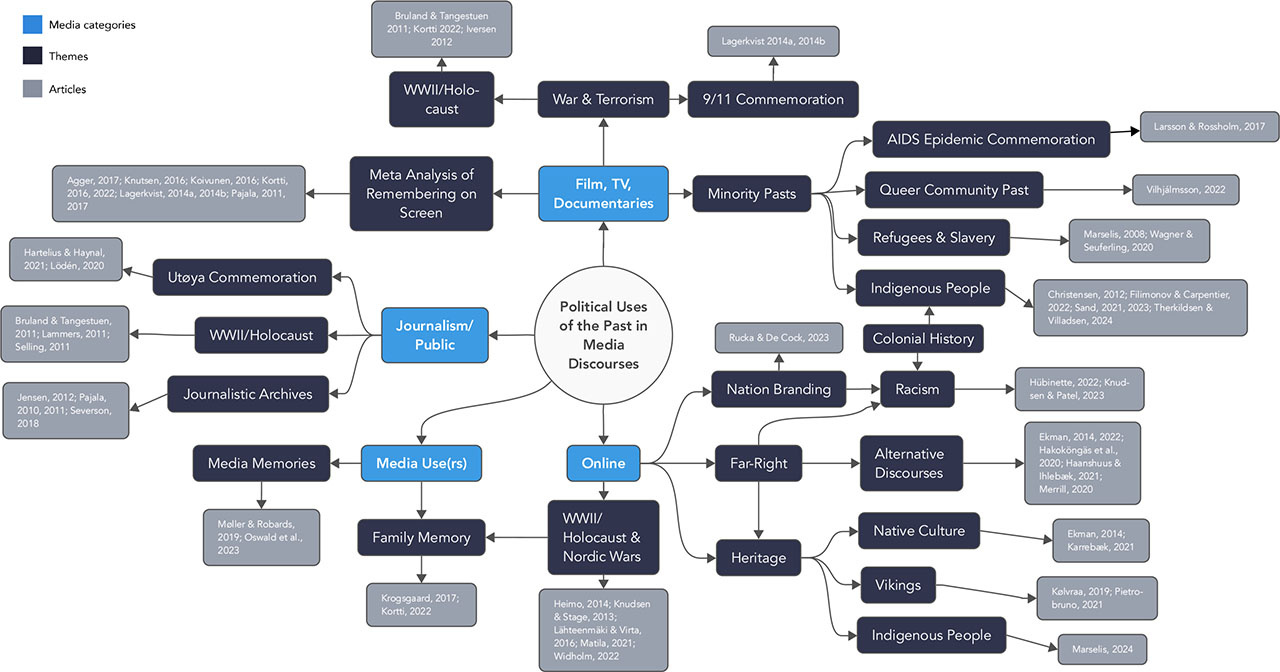
Figure 5
Mapping of media and themes studied in the sampled journal articles
Comments: n = 47.
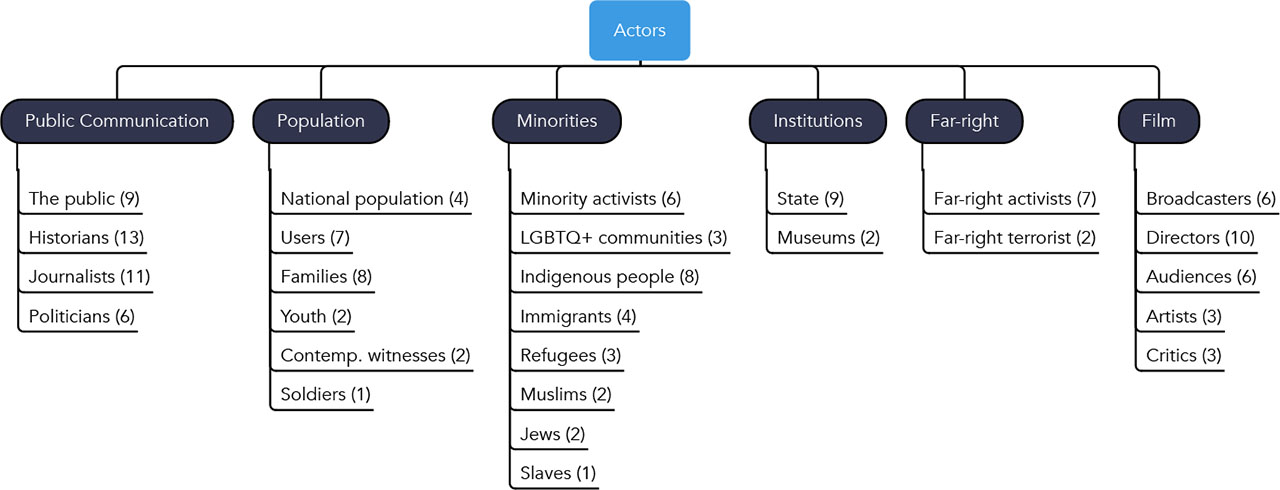
Figure 6
Absolute frequency of actors studied or prominently discussed in the sampled journal articles
Comments: n = 47.