

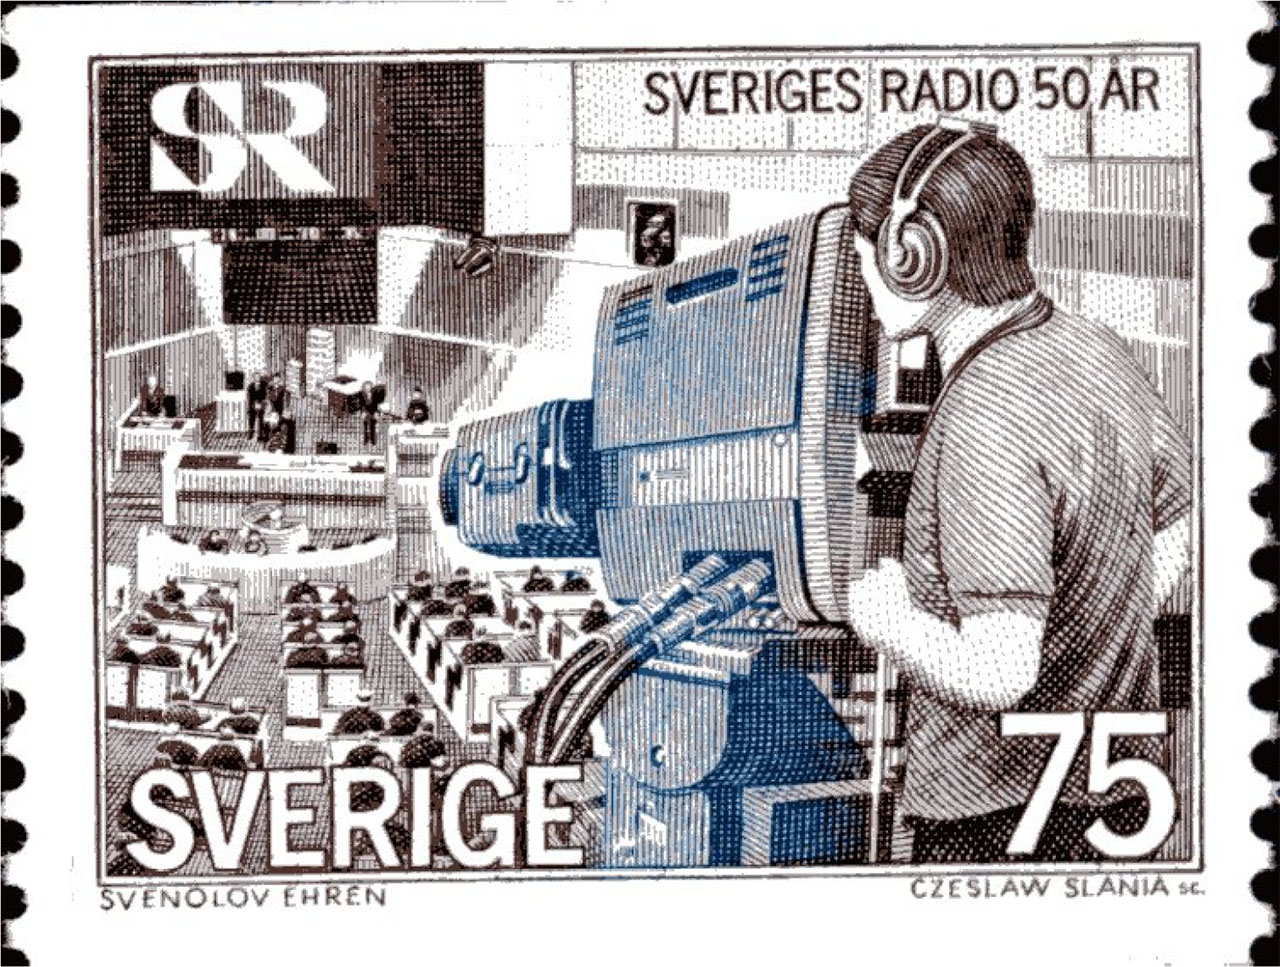
FIGURE 1
A stamp issued to celebrate the 50th birthday of public service broadcasting in Sweden, 1974
Comments: It is hard to see who is standing and speaking at the Riksdag [Swedish parliament] rostrum; rather, the postage stamp (issued in 1974) is focused on the television camera. Indeed, the medium seems to have been the message.
Source: published with permission from PostNord Frimärken.
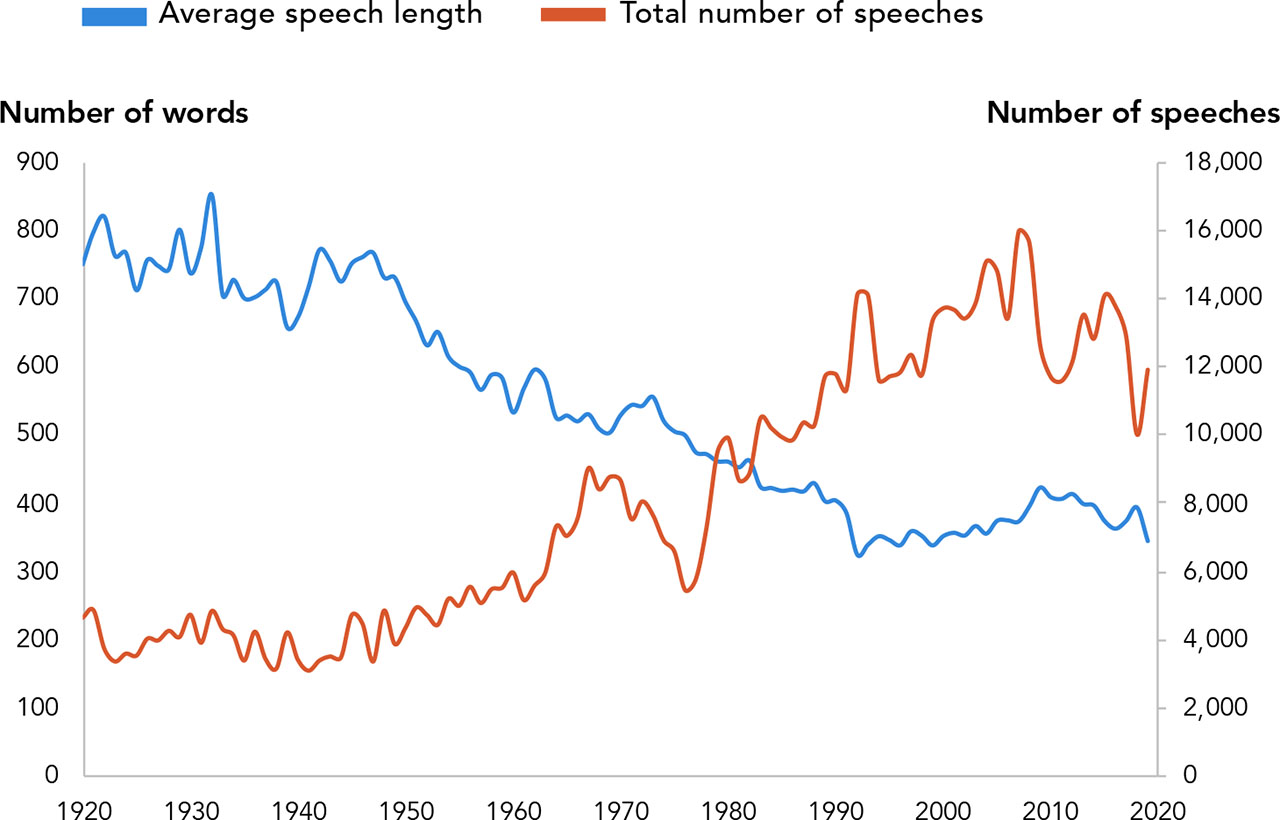
FIGURE 2
Average speech length and total number of speeches
Comments: N = 805,365. The blue trendline shows the average length of all annotated speeches in our dataset (based on the total word count for every speech divided by the total number of speeches for each year), and the red trendline displays the total number of annotated speeches in the Swedish parliament.
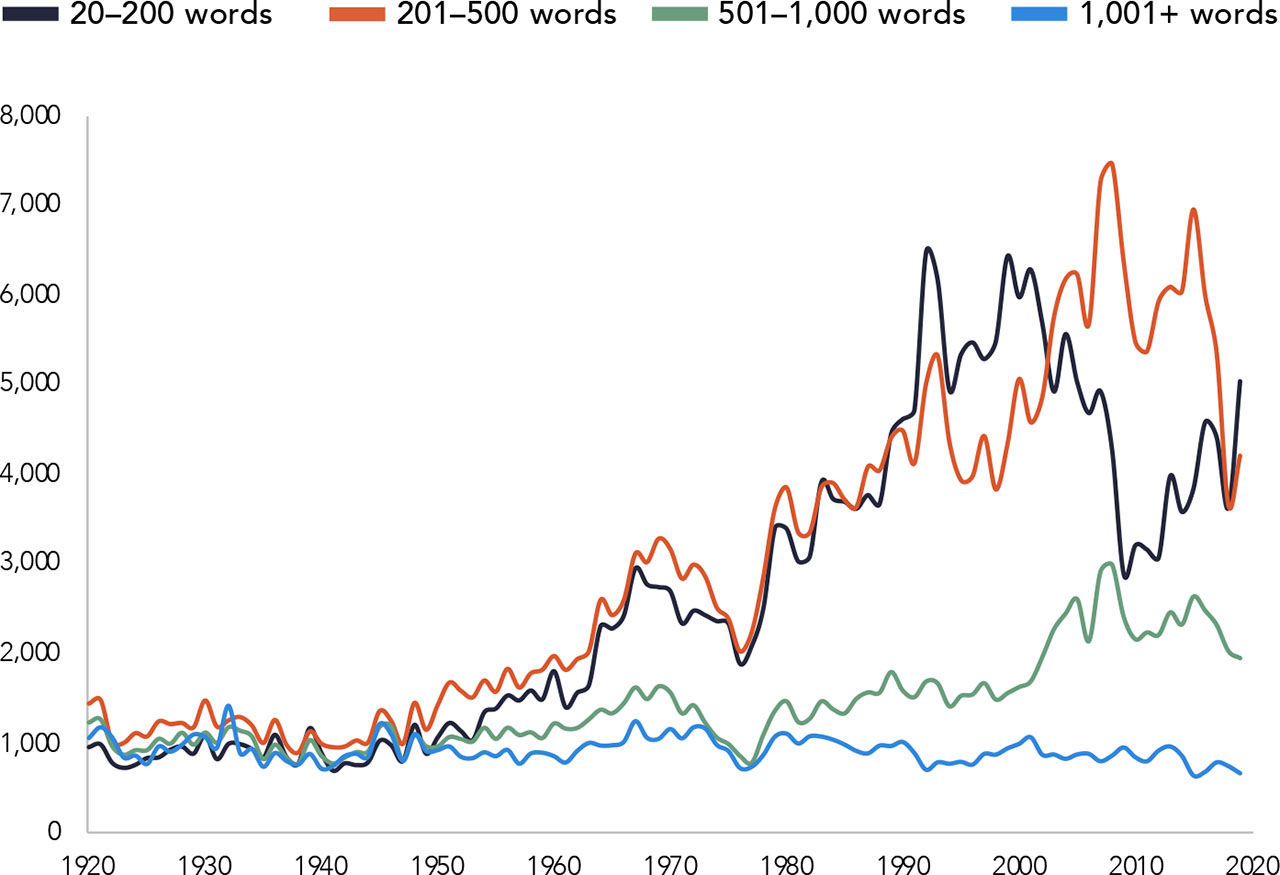
FIGURE 3
Total number of speeches for different categories of speech length
Comments: N = 793,893.
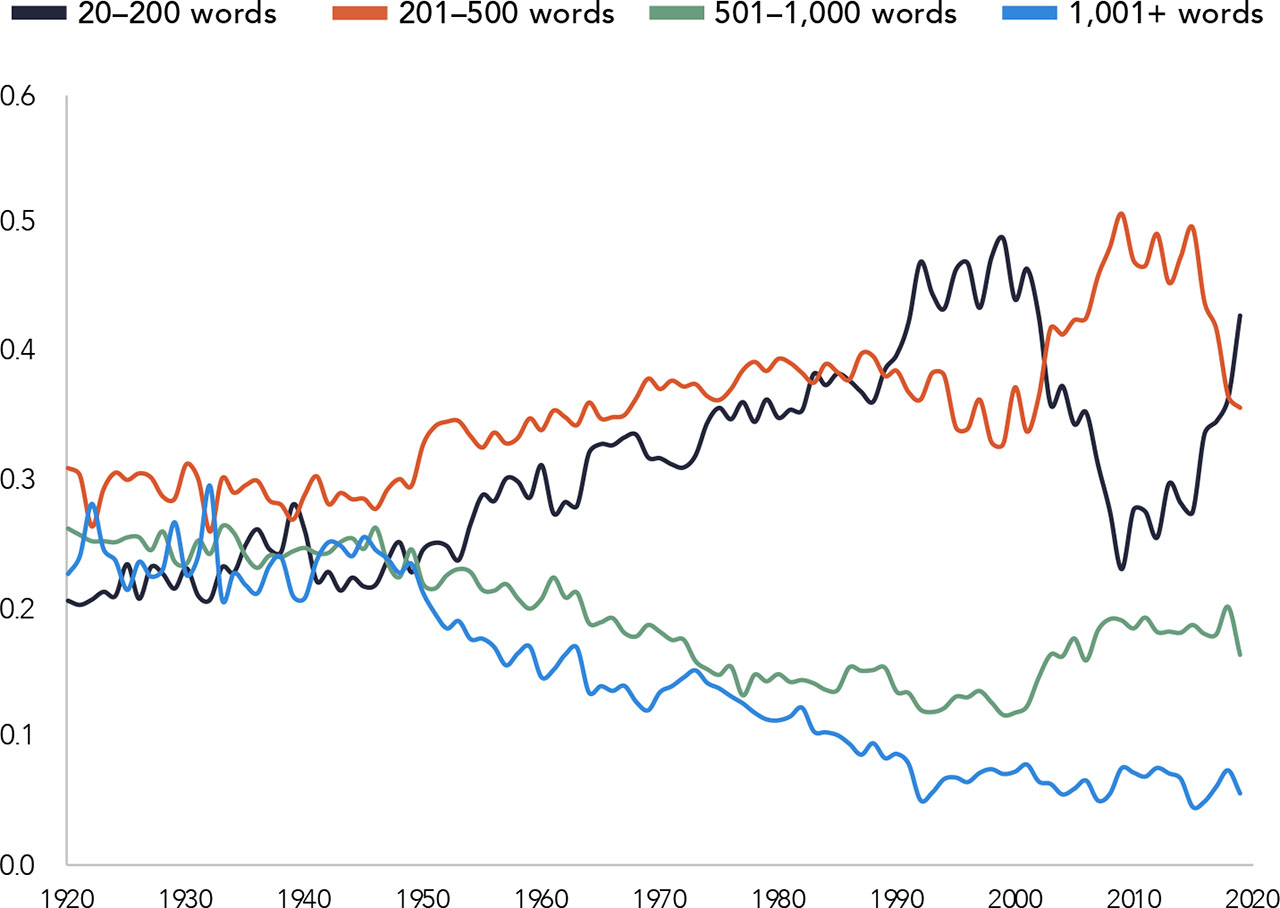
FIGURE 4
Normalised number of speeches for different categories of speech length
Comments: N = 793,893. The normalisation is based on the number of speeches in each category per year divided by the total number of speeches in the same year.
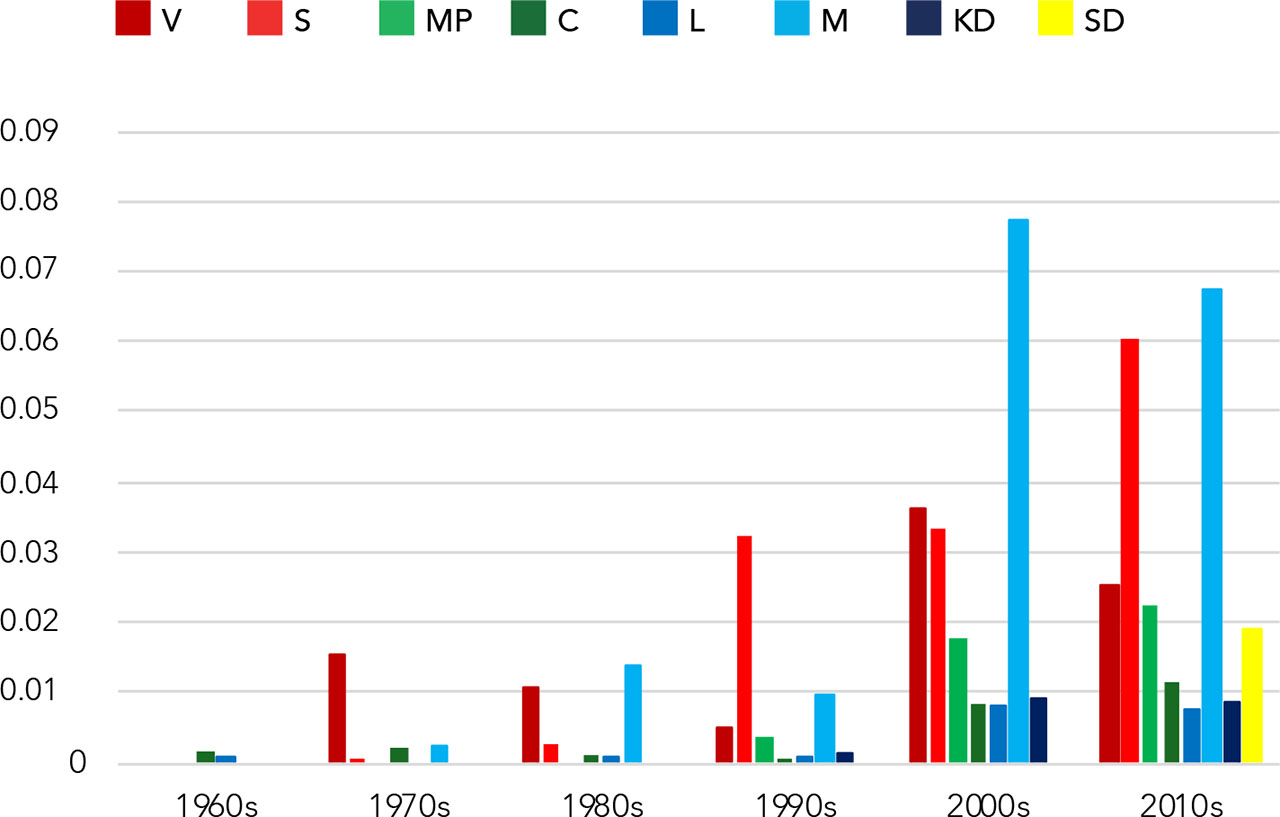
FIGURE 5
Normalised frequency of political slogans per decade, 1960–2019
Comments: N =11,820. The normalisation is based on the total number of slogan-like phrases divided by all speeches for a party during a decade. V = Left Party; S = Social Democratic Party; MP = Green Party; C = Centre Party; L = Liberals; M = Moderate Party; KD = Christian Democrats; SD = Sweden Democrats.