

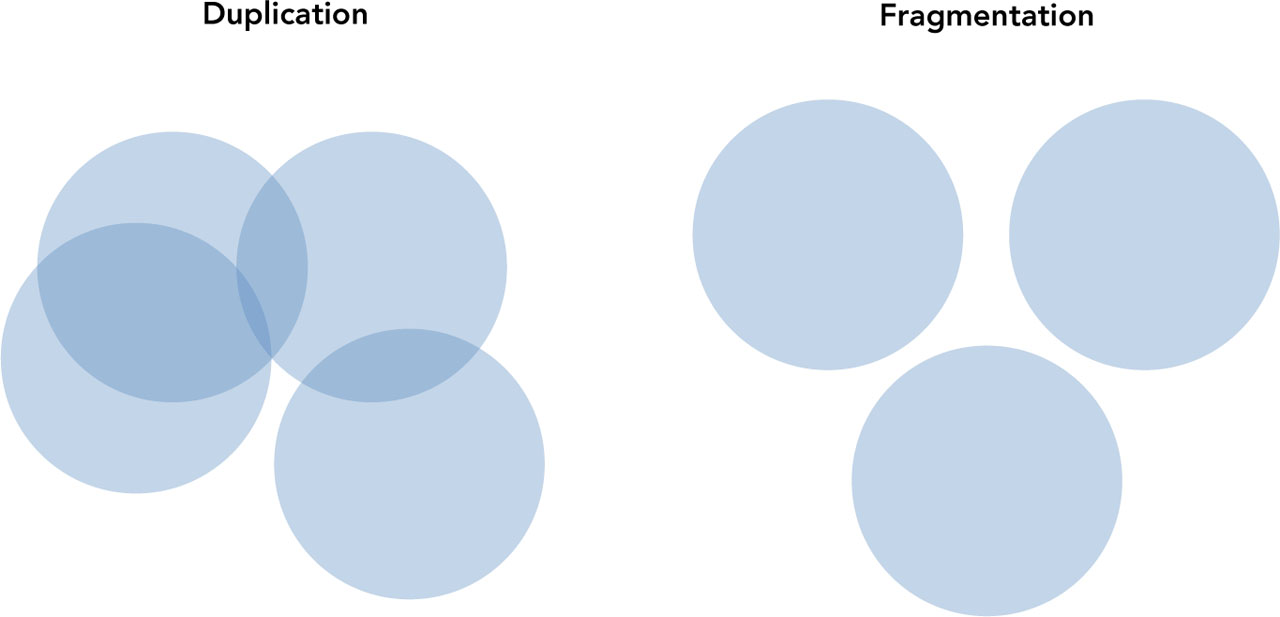
FIGURE 1
Duplication and fragmentation
Source: adapted from Webster, 2005
TABLE 1
Summaries of country–language media networks
| Nor-Nor | Nor-Eng | Swe-Swe | Swe-Eng | |
|---|---|---|---|---|
| Size: Outlets | 21 | 139 | 20 | 104 |
| Size: Ties | 140 | 7,759 | 163 | 4,714 |
| Duplication (density) | .67 | .81 | .86 | .88 |
| Modularity | .10 | .24 | .05 | .23 |
| Diameter | 2 | 2 | 2 | 2 |
| Transitivity | .81 | .89 | .90 | .92 |
| Centralisation | .31 | .19 | .16 | .12 |
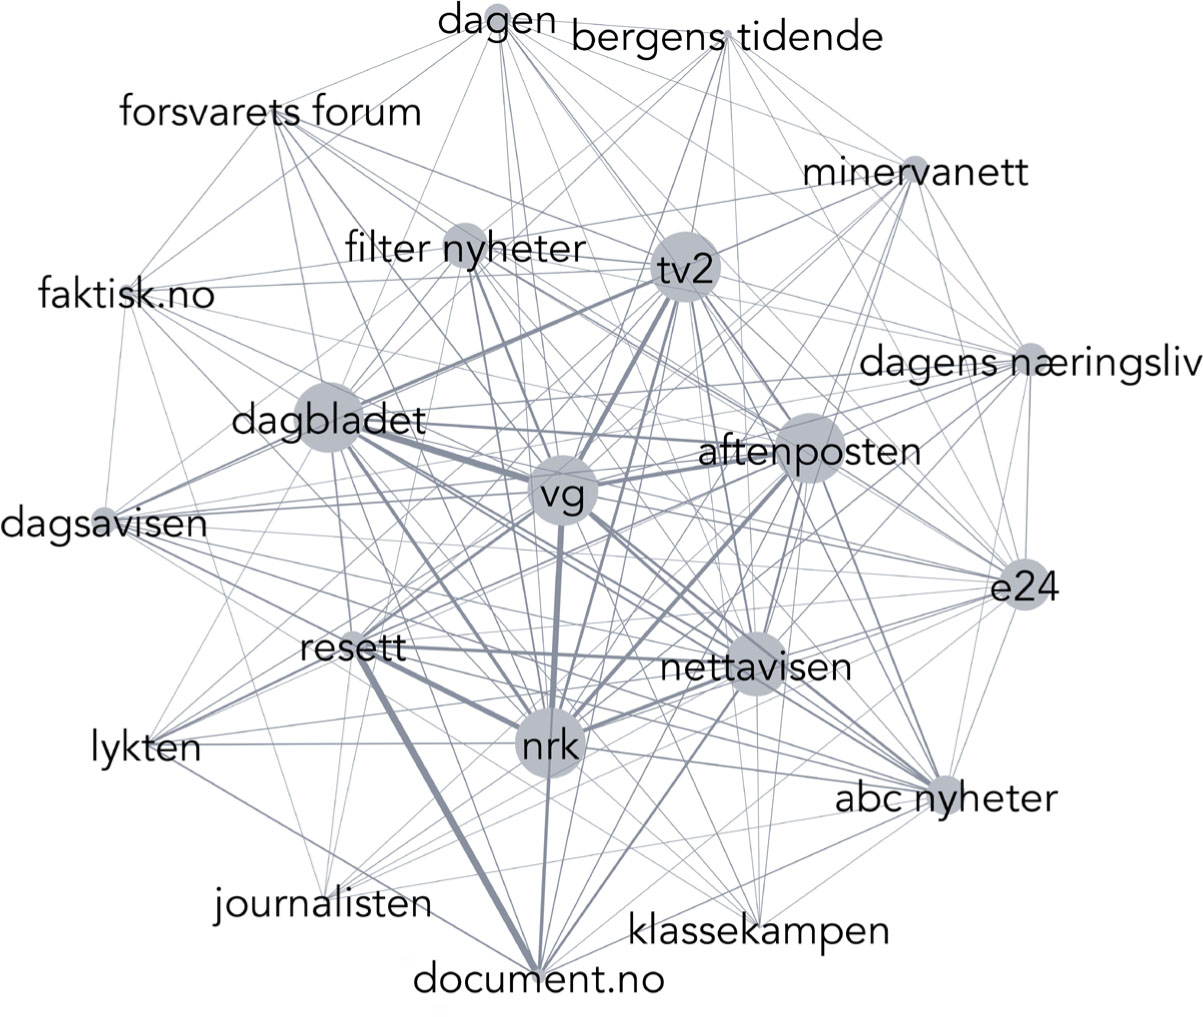
FIGURE 2A
Norway’s Norwegian-language media network
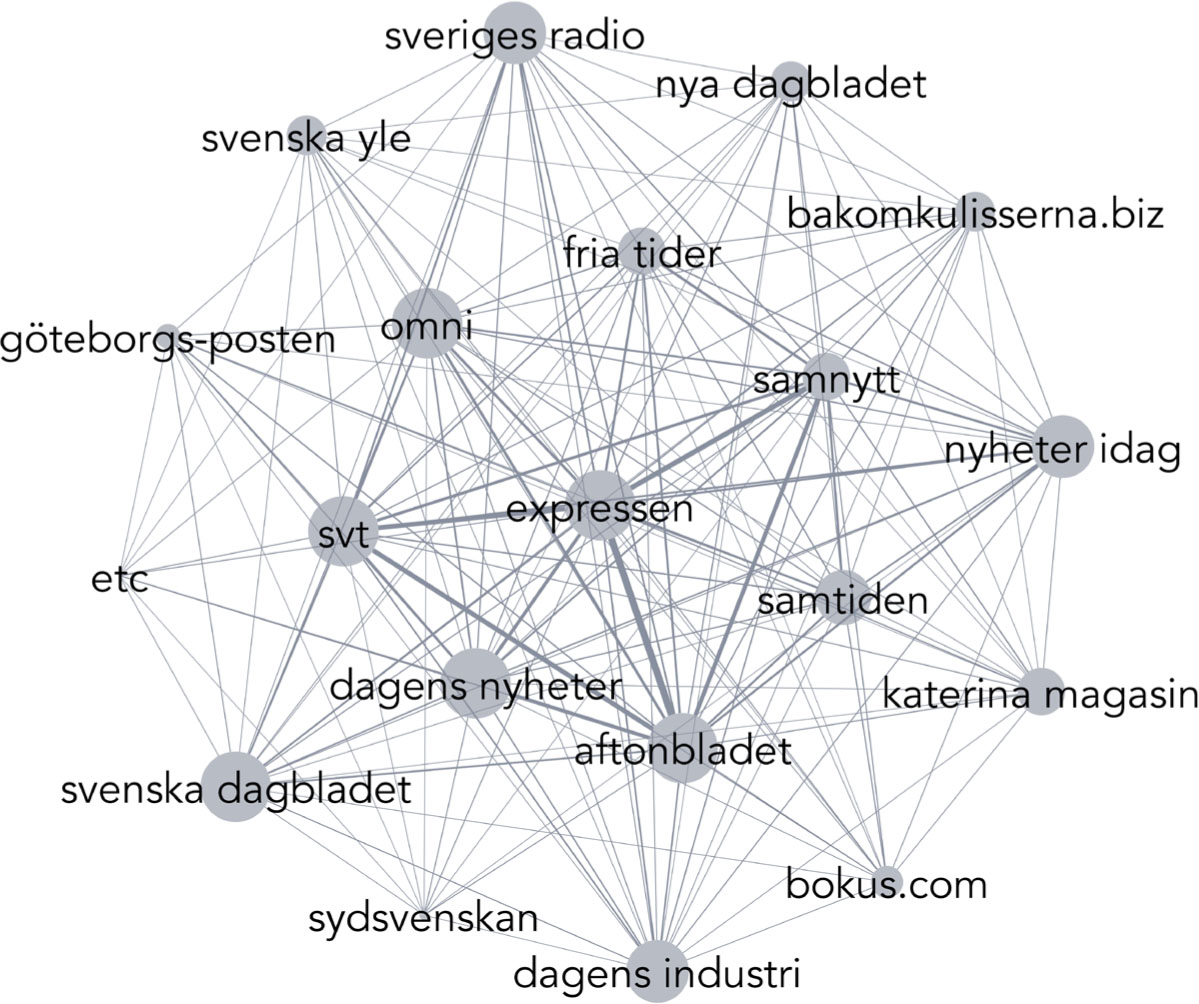
FIGURE 2B
Sweden’s Swedish-language media network
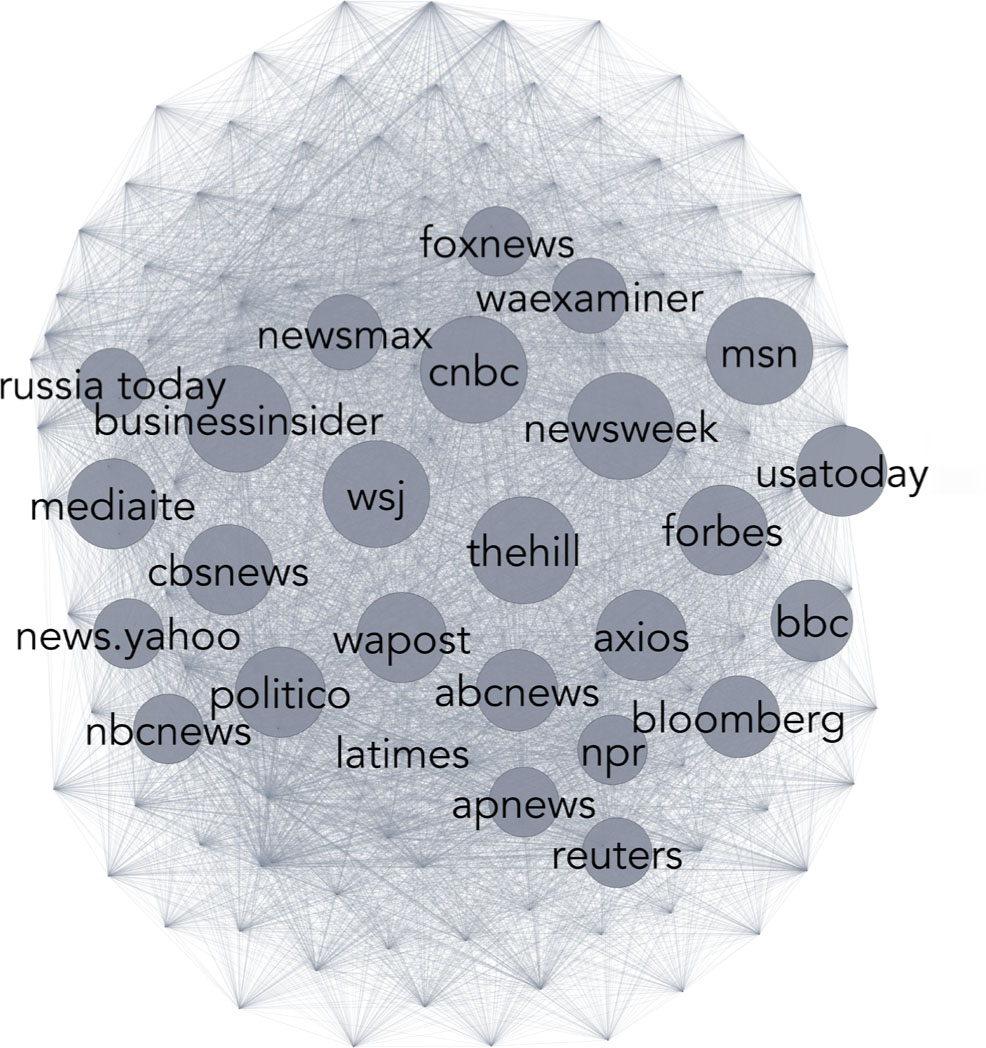
FIGURE 2C
Norway’s English-language media network
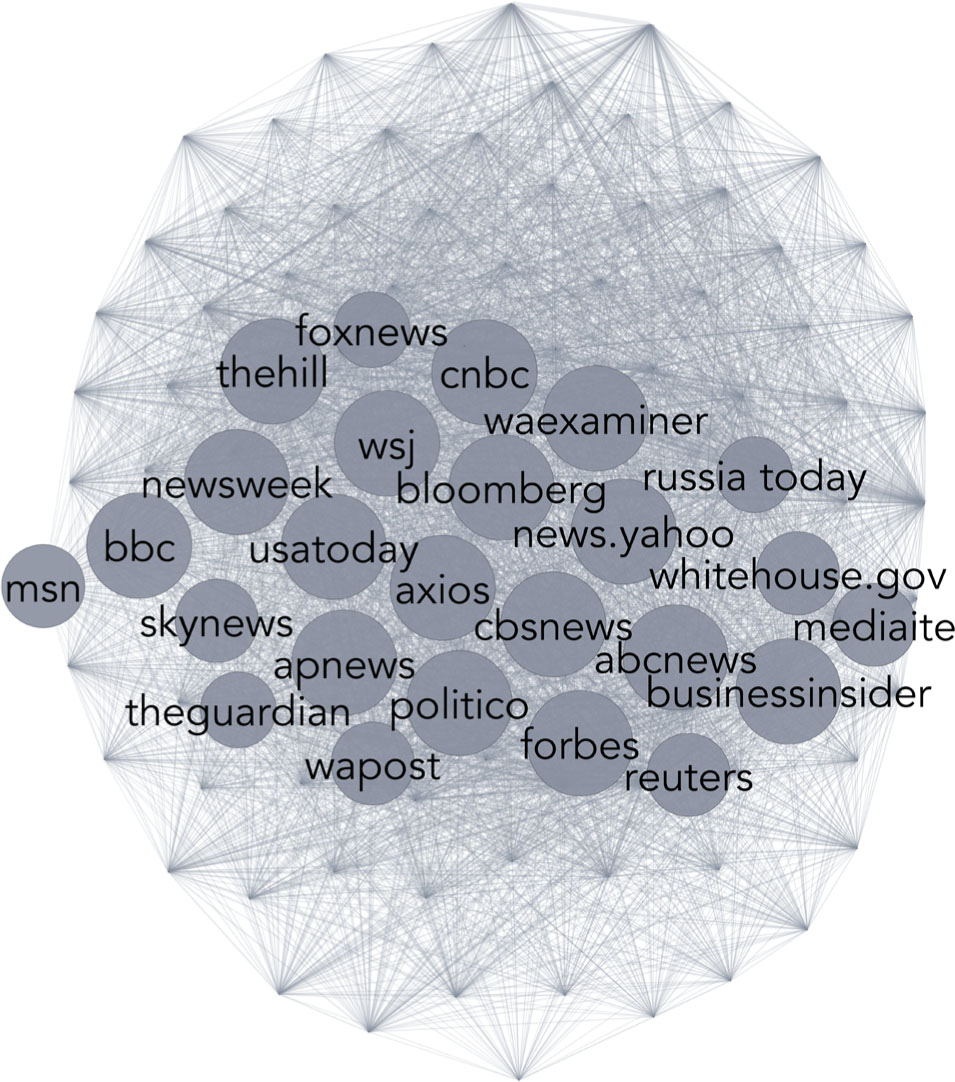
FIGURE 2D
Sweden’s English-language media network
Comments: Figures 2a–d illustrate the way different media outlets are connected each other based on the users that share them. Each country has been separated into the national language (Nor-Nor and Swe-Swe) and English (Nor-Eng and Swe-Eng) based on the language of the tweet. Networks are visualised using the Fruchterman Reingold algorithm in Gephi. In the English language networks, the 25 most well-connected outlets are labelled to ensure readability.
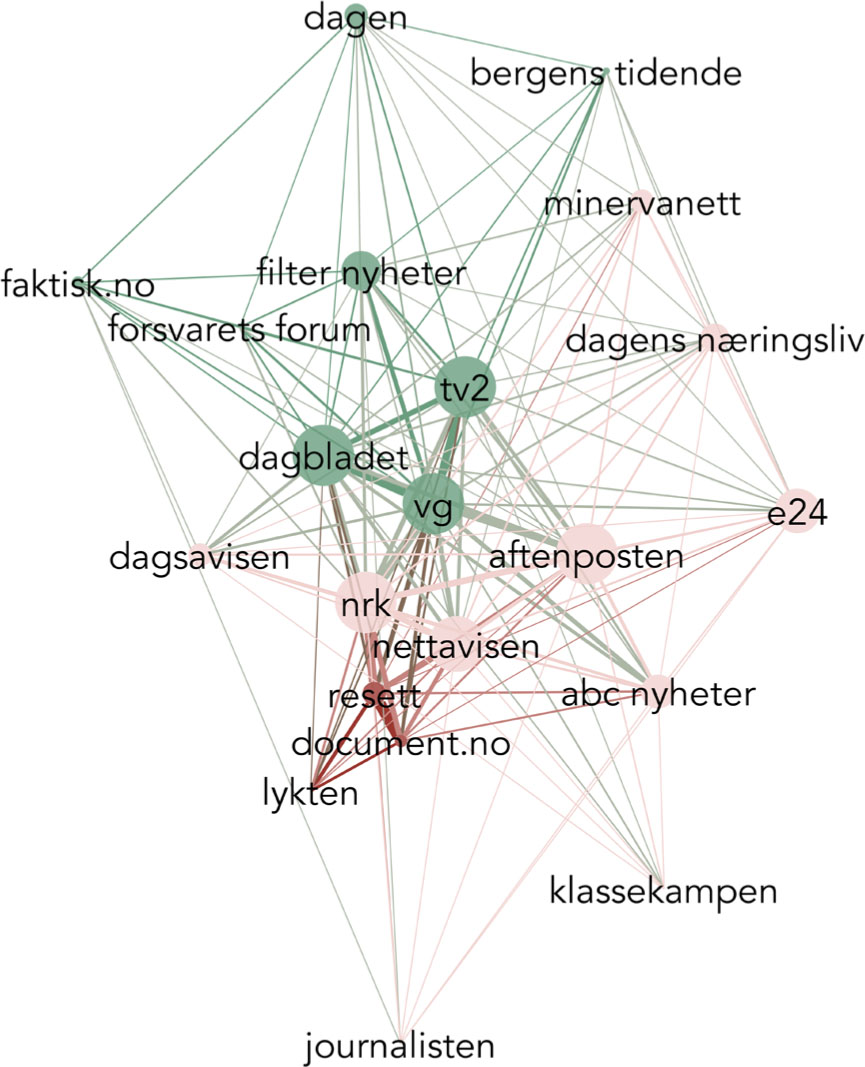
FIGURE 3A
Norway’s Norwegian-language media network, with modularity classes
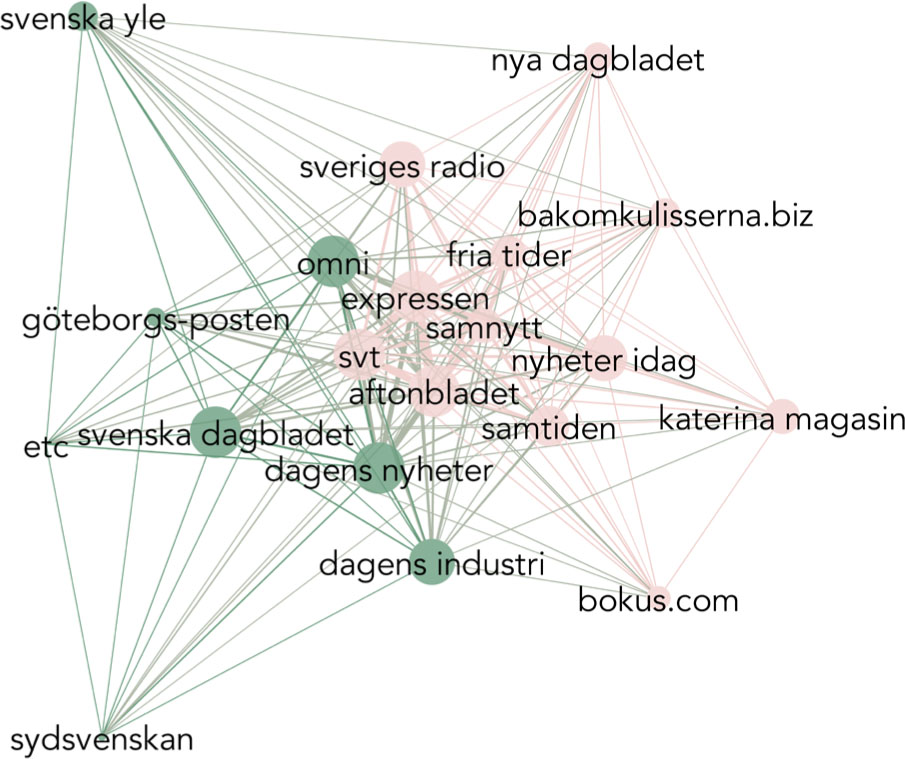
FIGURE 3B
Sweden’s Swedish-language media network, with modularity classes
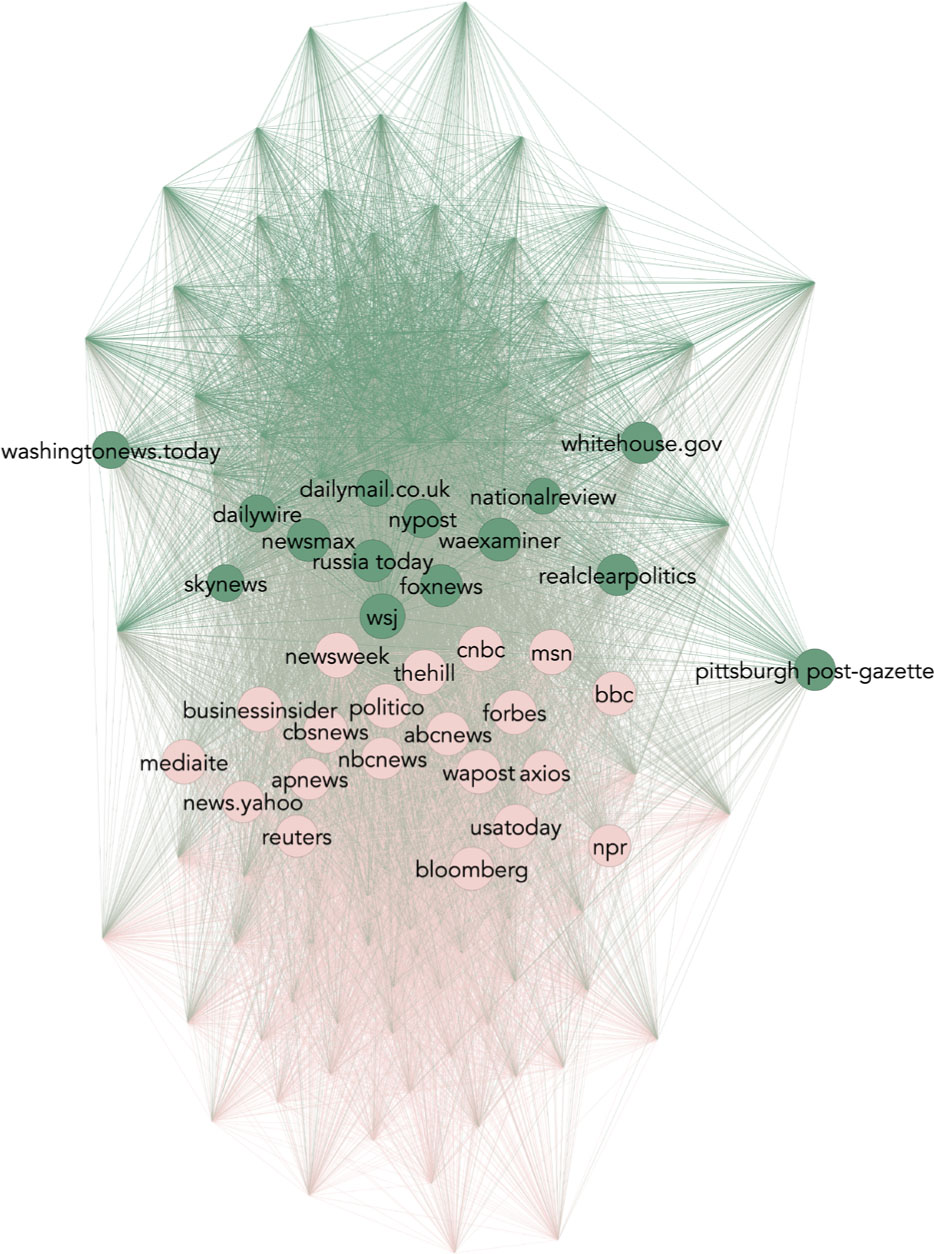
FIGURE 3C
Norway’s English-language media network, with modularity classes
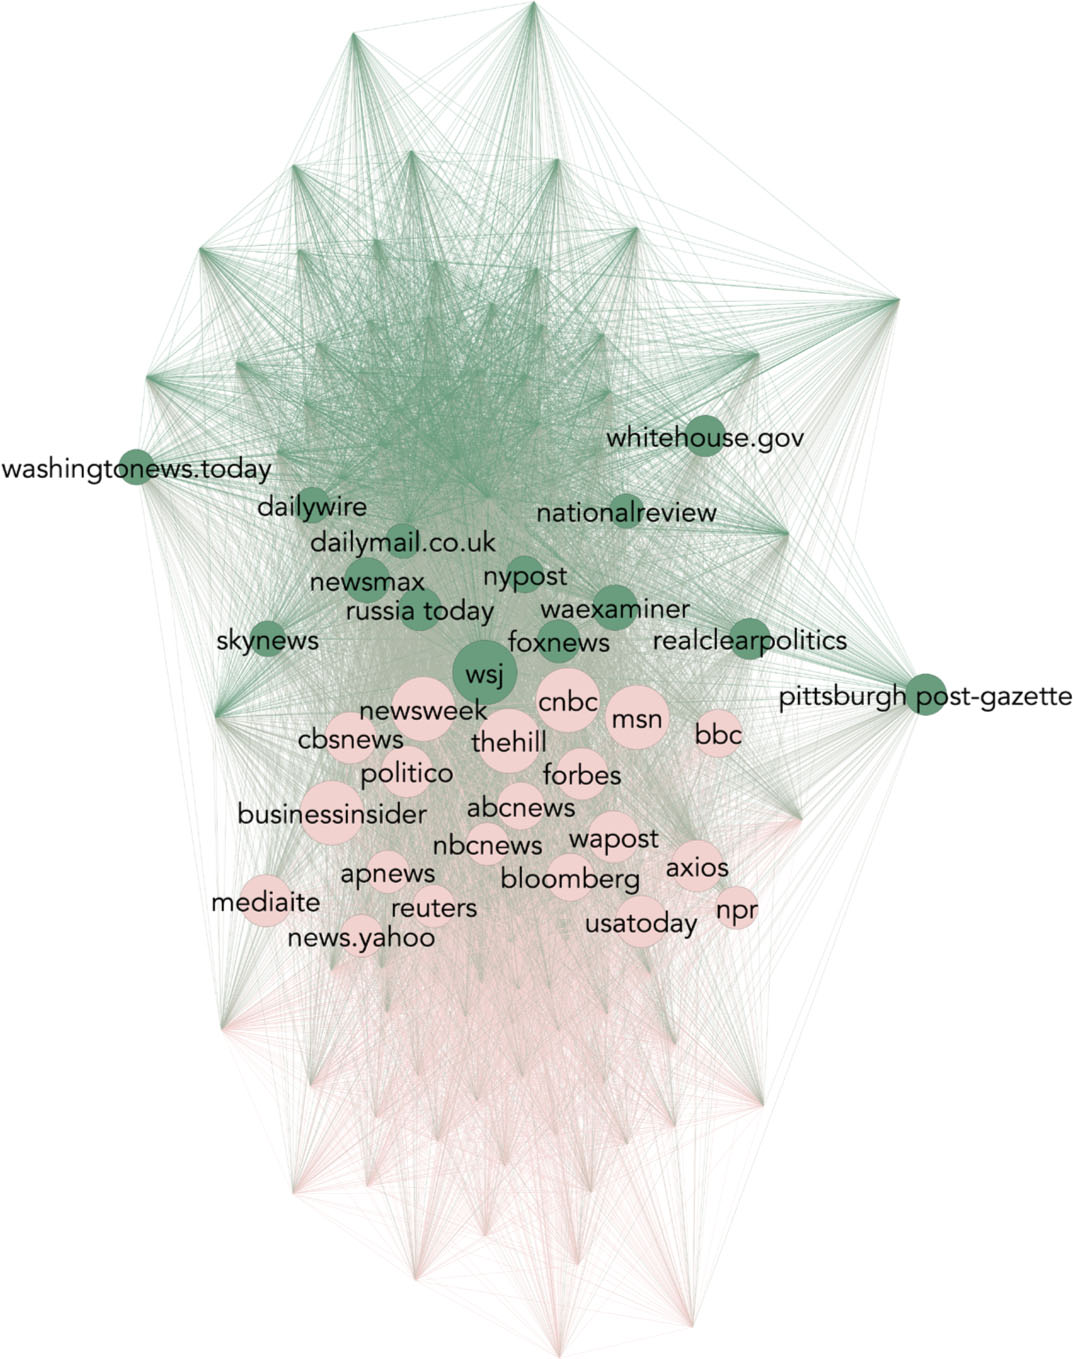
FIGURE 3D
Sweden’s English-language media network, with modularity classes
Comments: In Figures 3a–d, the media networks from Figures 2a–d have been restructured using the ForceAtlas 2 algorithm, which better visualises divisions in the network. Distinct communities or “modularity classes” have been colourised.
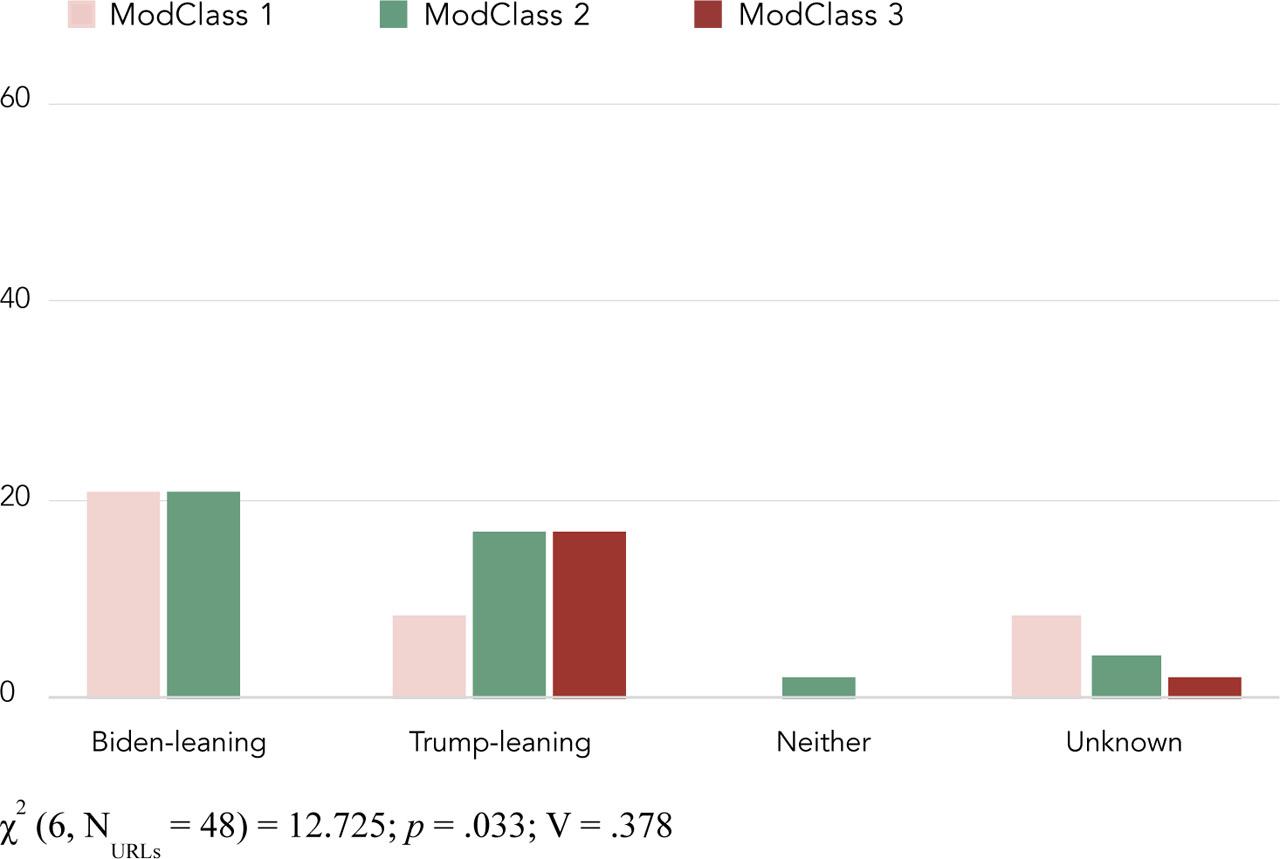
FIGURE 4A
Norway’s Norwegian-language media network, with modularity class and political orientation correlations
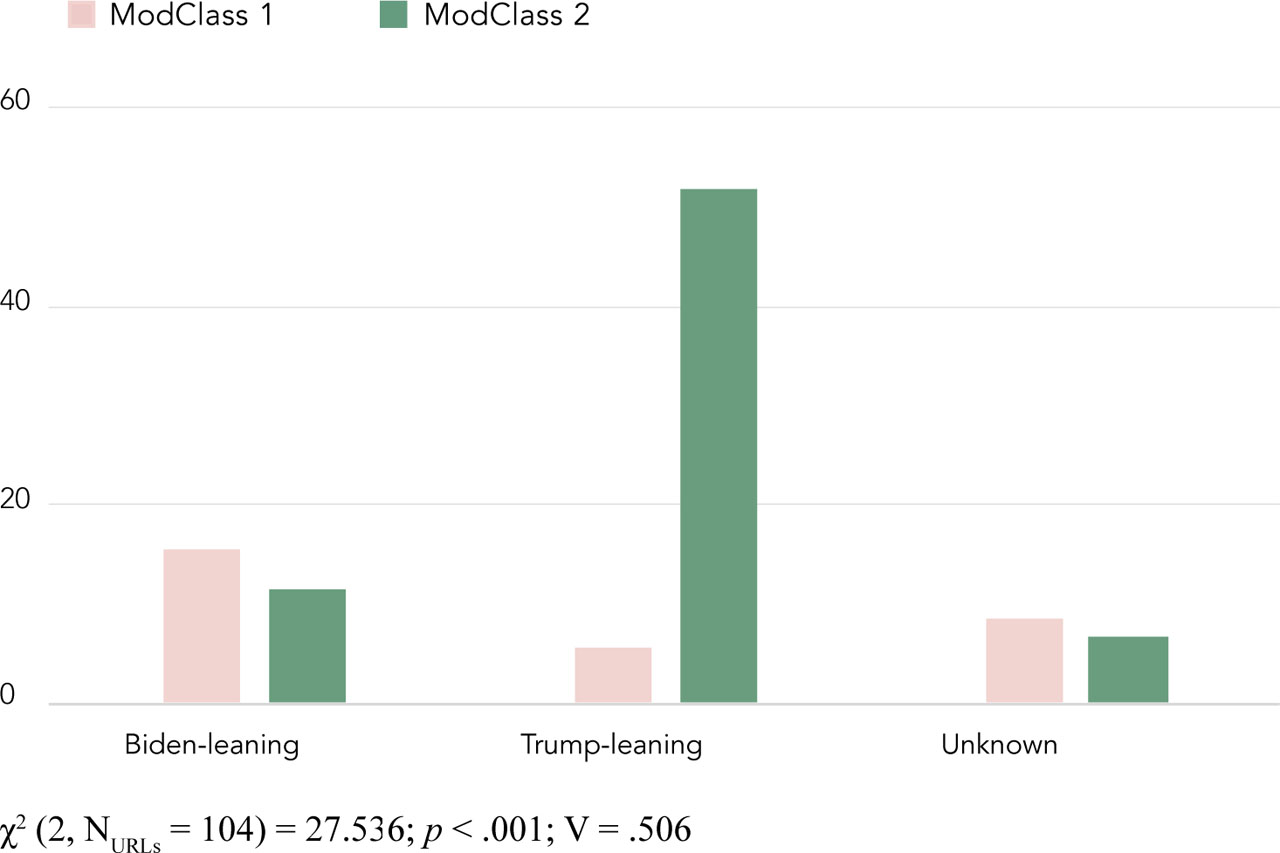
FIGURE 4B
Sweden’s Swedish-language media network, with modularity class and political orientation correlations
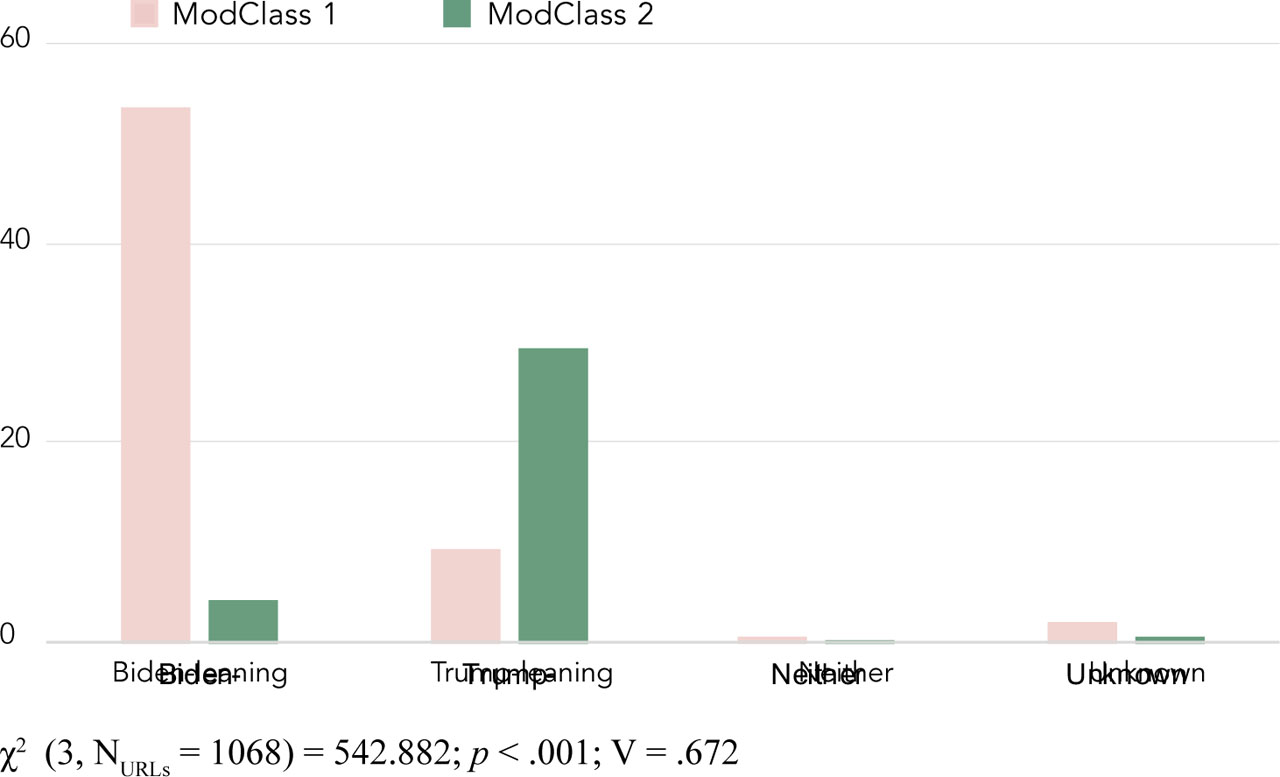
FIGURE 4C
Sweden’s English-language media network, with modularity class and political orientation correlations
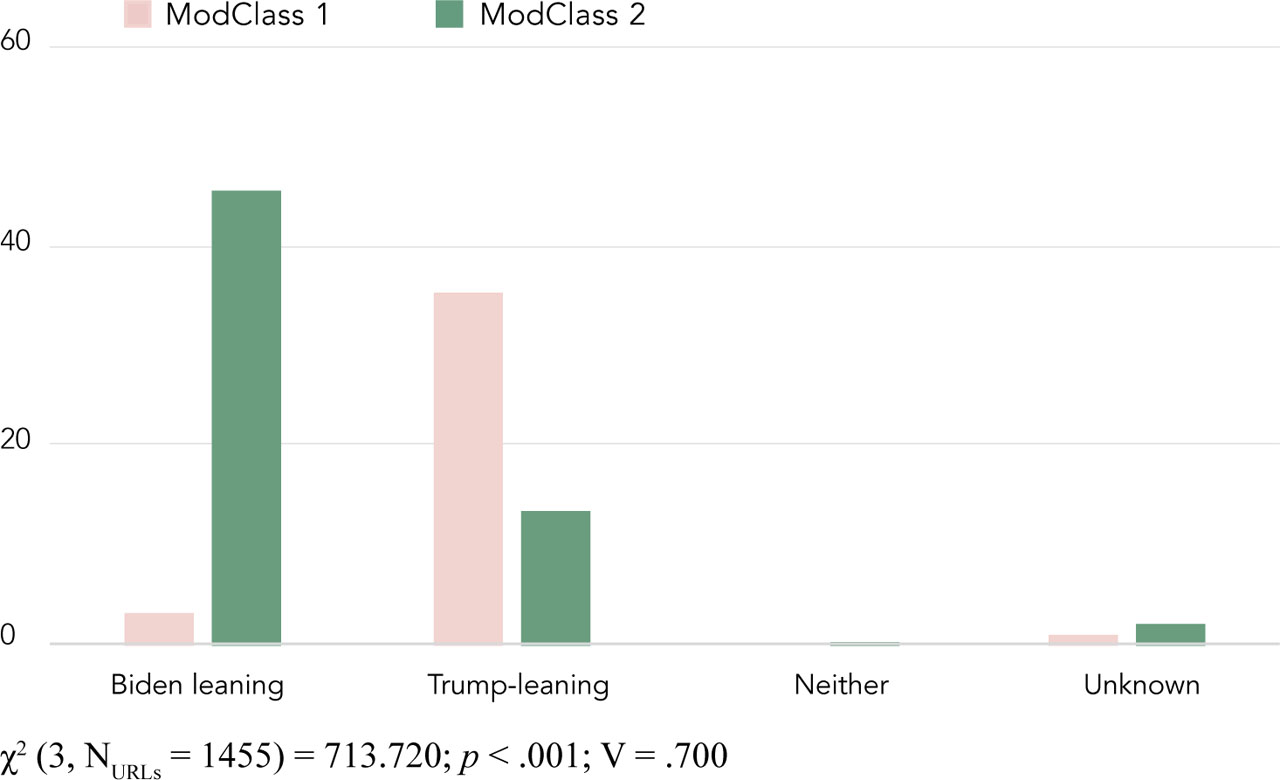
FIGURE 4D
Norway’s English-language media network, with modularity class and political orientation correlations
Comments: Figures 4a–d illustrate the relationship between the different modularity classes of media and the political orientation of the users who shared media outlets within these classes. The strength of correlation (V) shows the level of audience polarisation in each country–language group. The colours of the bars correspond to the colours of the modularity classes in Figures 3a–d.