

Figure 1
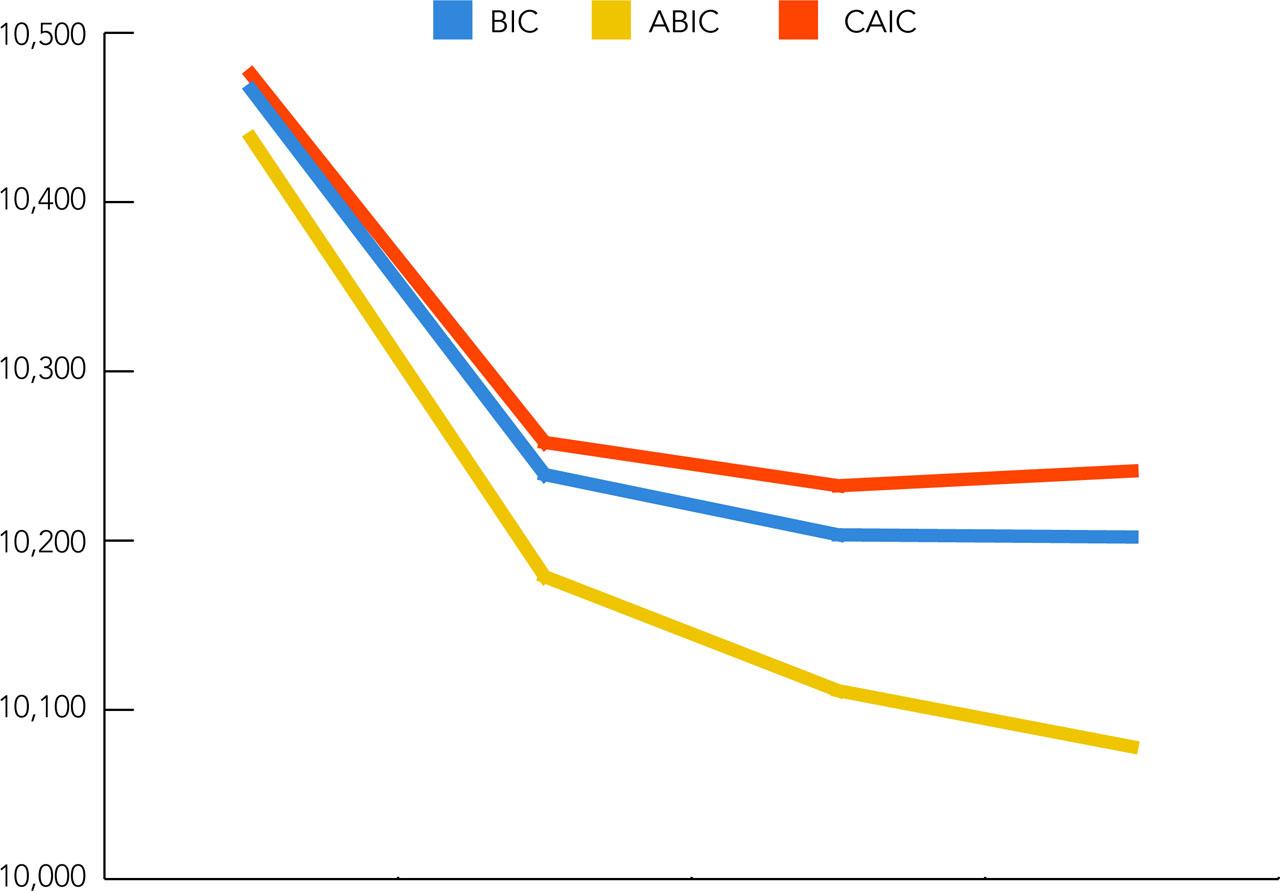
Figure 2
Descriptive statistics of following news from different source options
| Indicators | Mean* | Variance** | N*** |
|---|---|---|---|
| Television | 3.504 | 1.623 | 782 |
| Newspapers (print) | 2.770 | 1.763 | 782 |
| Newspapers (digital/Internet) | 4.063 | 1.509 | 782 |
| Shared news on social media | 3.385 | 1.811 | 775 |
Prediction of news repertoires (multinomial logistic)
| Repertoire | Variable | Coef.* | P-value |
|---|---|---|---|
| Moderate digital traditionalists (Ref. minimalist social media stumblers) | Gender (Ref. women) | 0.791 | 0.010 |
| Age | 0.172 | 0.121 | |
| At school (Ref. no) | 0.788 | 0.079 | |
| Living Uusimaa/Capital area (Ref. no) | −0.758 | 0.014 | |
| Economic situation family | 0.015 | 0.937 | |
| Political activity on social media in last 12 months (Ref. no) | 0.812 | 0.009 | |
| Trust traditional media | 0.592 | 0.002 | |
| Trust news social media | −0.214 | 0.266 | |
| Seek information daily social media (Ref. no) | −0.038 | 0.903 | |
| Frequent news omnivores (Ref. minimalist social media stumblers) | Gender (Ref. women) | 1.094 | 0.001 |
| Age | 0.232 | 0.052 | |
| At school (Ref. no) | 0.869 | 0.117 | |
| Living Uusimaa/Capital area (Ref. no) | −0.865 | 0.040 | |
| Economic situation family | 0.081 | 0.721 | |
| Political activity on social media in last 12 months (Ref. no) | 0.764 | 0.043 | |
| Trust traditional media | 0.514 | 0.022 | |
| Trust news social media | 0.210 | 0.343 | |
| Seek information daily social media (Ref. no) | 1.659 | 0.008 | |
Descriptive statistics of independent variables
| Covariates | Mean* | Variance** | N*** |
|---|---|---|---|
| Gender (0/1; Women/Men) | 0.494 | 0.250 | 782 |
| Age (in years) | 16.994 | 1.986 | 782 |
| At school (0/1; No/Yes) | 0.875 | 0.110 | 782 |
| Living in Uusimaa/Capital area (0/1; No/Yes) | 0.213 | 0.168 | 780 |
| Economic situation of family (1–5; Very Bad–Very Good) | 3.867 | 0.578 | 782 |
| Political activity last 12 months on some platform of social media (0/1; No/Yes) | 0.771 | 0.177 | 782 |
| Trust in traditional media sources (1–5; Not at all–Very much) | 4.180 | 0.590 | 782 |
| Trust in shared news on social media (1–5; Not at all–Very much) | 2.774 | 0.619 | 779 |
| Seek information daily on social media (0/1; No/Yes) | 0.707 | 0.207 | 782 |
Profile comparison
| Profile | Loglikelihood | AIC | BIC | ABIC | CAIC | Entropy | LMR | BLRT |
|---|---|---|---|---|---|---|---|---|
| 1 | −5203.163 | 10424.325 | 10466.282 | 10437.702 | 10475.283 | – | – | – |
| 2 | −5056.234 | 10150.469 | 10239.044 | 10178.709 | 10258.043 | 0.708 | 0.0837 | 0.0000 |
| 3 | −5005.105 | 10068.209 | 10203.403 | 10111.314 | 10232.404 | 0.661 | 0.0184 | 0.0000 |
| 4 | −4971.126 | 10020.252 | 10202.064 | 10078.220 | 10241.064 | 0.616* | 0.0007 | 0.0000 |
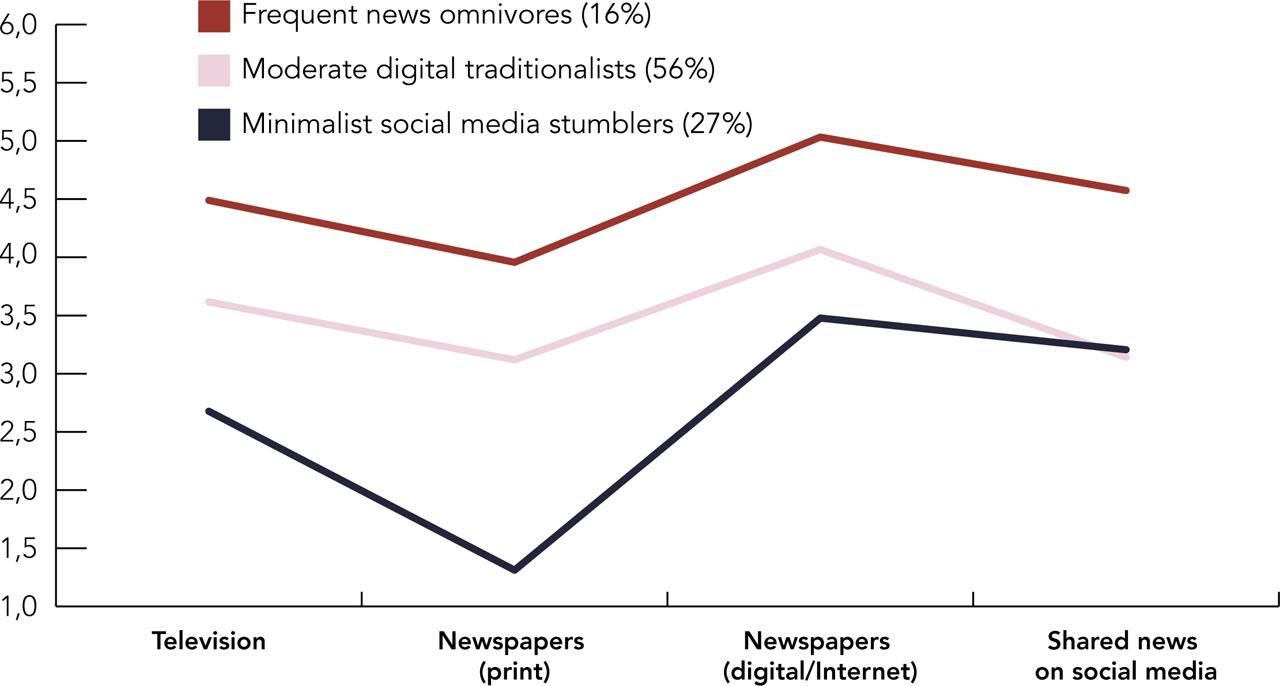
Selected model's means, variances, and residual covariances
| Profile 1 | Profile 2 | Profile 3 | |
|---|---|---|---|
| Minimalist social media stumblers | Moderate digital traditionalists | Frequent news omnivores | |
| Television | Mean = 2.677 | Mean = 3.616 | Mean = 4.489 |
| Variance = 1.710 | Variance = 1.269 | Variance = 0.600 | |
| Newspapers (print) | Mean = 1.312 | Mean = 3.119 | Mean = 3.957 |
| Variance = 0.218 | Variance =1.268 | Variance = 0.734 | |
| Newspapers (digital/Internet) | Mean = 3.478 | Mean = 4.067 | Mean = 5.033 |
| Variance = 1.963 | Variance = 1.198 | Variance = 0.357 | |
| Shared news on social media | Mean = 3.206 | Mean = 3.141 | Mean = 4.574 |
| Variance = 1.846 | Variance = 1.703 | Variance = 0.457 | |
| Residual covariance news sites and shared news social media | 0.636 (p = 0.013) | 0.056 (p = 0.593) | 0.130 (p = 0.070) |
| N | 214 (27%) | 439 (56%) | 129 (16%) |