

Table 1
Regular use of different local media in 2015 and 2017 (per cent)
| 2015 | 2017 | Difference | N * | |
|---|---|---|---|---|
| Local subscription-based newspaper (paper) | 57 | 41 | -16 | 10,812 |
| Local subscription-based newspaper (online) | 25 | 22 | -3 | 10,812 |
| Other local online news | 8 | 8 | 0 | 10,812 |
| Local free newspaper (weekly) | 33 | 33 | 0 | 1,828 |
| Public service radio (SR P4) | 50 | 43 | -7 | 10,812 |
| Public service TV (SVT regional news) | 61 | 50 | -11 | 10,812 |
| Facebook (e.g. local groups) | 41 | 46 | +5 | 1,827 |
| 5 | 6 | +1 | 1,827 | |
| Other kinds of social media (e.g. local blogs) | 14 | 15 | +1 | 1,827 |
| Website of the local municipality | 6 | 6 | 0 | 1,827 |
[i] Source: The national SOM surveys in 2015 and 2017
Comments: “Regular use” implies use at least three days per week. *The results are based on different parts of the SOM survey. Some questions on media use are based on all six subsurveys (10,812) and some only on one of them (1,827 and 1,828).
Table 2
Regular use of different local media in 2015 and 2017 by age (per cent)
| 16–29 | 30–49 | 50–64 | 65–85 | ||||||
|---|---|---|---|---|---|---|---|---|---|
| 2015 | 2017 | 2015 | 2017 | 2015 | 2017 | 2015 | 2017 | N * | |
| Local subscription-based newspaper (paper) | 20 | 10 | 40 | 23 | 64 | 47 | 81 | 67 | 10,812 |
| Local subscription-based newspaper (online) | 18 | 15 | 25 | 26 | 27 | 26 | 25 | 18 | 10,812 |
| Other local online news | 9 | 10 | 9 | 11 | 9 | 8 | 6 | 5 | 10,812 |
| Local free newspaper (weekly) | 14 | 12 | 31 | 35 | 34 | 36 | 46 | 40 | 1,828 |
| Public service radio (SR P4) | 16 | 14 | 36 | 31 | 61 | 51 | 73 | 63 | 10,812 |
| Public service TV (SVT regional news) | 22 | 19 | 38 | 30 | 72 | 59 | 91 | 79 | 10,812 |
| Facebook (e.g. local groups) | 66 | 61 | 57 | 59 | 38 | 46 | 16 | 27 | 1,827 |
| 14 | 15 | 5 | 6 | 4 | 5 | 1 | 2 | 1,827 | |
| Other kinds of social media (e.g. local blogs) | 32 | 24 | 18 | 17 | 10 | 10 | 4 | 8 | 1,827 |
| Website of the local municipality | 3 | 6 | 9 | 5 | 7 | 8 | 5 | 5 | 1,827 |
| Minimum number of answers | 229 | 276 | 433 | 534 | 369 | 478 | 419 | 539 | |
[i] Source: The national SOM surveys in 2015 and 2017
Comments: “Regular use” implies use at least three days per week. *The results are based on different parts of the SOM survey. Some questions on media use are based on all six subsurveys (10,812) and some only on one of them (1,827 and 1,828).
Table 3
Perceived importance of different local media for staying informed about local society (per cent)
| 2015 | 2017 | Difference | |
|---|---|---|---|
| Local subscription-based newspaper (paper) | 58 | 47 | -11 |
| Local subscription-based newspaper (online) | 44 | 44 | 0 |
| Other local online news | 27 | 28 | +1 |
| Local free newspaper (weekly) | 39 | 36 | -3 |
| Public service radio (SR P4) | 55 | 55 | 0 |
| Public service TV (SVT regional news) | 75 | 69 | -6 |
| Facebook (e.g. local groups) | 32 | 35 | +3 |
| 5 | 6 | +1 | |
| Other kinds of social media (e.g. local blogs) | 13 | 12 | -1 |
| Website of the local municipality | 30 | 30 | 0 |
| Number of answers | 1,597 | 1,827 | |
[i] Source: The national SOM surveys in 2015 and 2017
Comments: The percentages shown indicate the share of respondents who answered “very important” or “quite important” on a scale with four steps. (The question was: “How important are different kinds of local media for staying informed about local society?”)
Table 4
Regular use of local media in municipalities with differences in media presence (per cent)
| Municipalities with main newsrooms | Municipalities with local offices | Municipalities with no local media presence | Number of answers | |
|---|---|---|---|---|
| Local subscription-based newspa- per (paper) | 41 | 45 | 35 | 10,812 |
| Local subscription-based newspa- per (online) | 24 | 23 | 16 | 10,812 |
| Other local online news | 9 | 8 | 7 | 10,812 |
| Local free newspaper (weekly) | 31 | 28 | 45 | 1,828 |
| Public service radio (SR P4) | 41 | 48 | 44 | 10,812 |
| Public service TV (SVT regional news) | 50 | 52 | 50 | 10,812 |
| Facebook (e.g. local groups) | 46 | 49 | 45 | 1,827 |
| 6 | 6 | 5 | 1,827 | |
| Other kinds of social media (e.g. local blogs) | 15 | 17 | 14 | 1,827 |
| Website of the local municipality | 6 | 6 | 4 | 1,827 |
[i] Source: The national SOM survey in 2017
Comments: The degree of local media presence is based on Nygren and colleagues (2017), and a special analysis was done combining data on media presence and SOM data on media use. “Regular use” implies use at least three days per week.
Table 5
Frequency of various activities in local social media groups, for example local Facebook groups (per cent)
| Daily | 5-6 d/w | 3-4 d/w | 1-2 d/w | More seldom | Never | Don’t use social media | Total | |
|---|---|---|---|---|---|---|---|---|
| Keeping up to date with what is going on in the local community | 20 | 7 | 8 | 10 | 15 | 14 | 26 | 100 |
| Getting information about local events | 14 | 7 | 8 | 13 | 21 | 12 | 26 | 100 |
| Clicking on links to news in local media | 7 | 7 | 10 | 15 | 20 | 16 | 26 | 100 |
| Buying and selling things privately | 1 | 1 | 1 | 4 | 37 | 30 | 26 | 100 |
| Looking for help and information | 5 | 3 | 6 | 14 | 27 | 18 | 26 | 100 |
| Commenting on and discussing local issues | 2 | 1 | 3 | 6 | 30 | 33 | 26 | 100 |
| Publishing own texts and pictures | 2 | 2 | 3 | 9 | 32 | 16 | 26 | 100 |
[i] Source: The national SOM survey in 2017.
Comments: The number of answers is 1,827, including the share of 26 per cent who answered that they do not use social media.
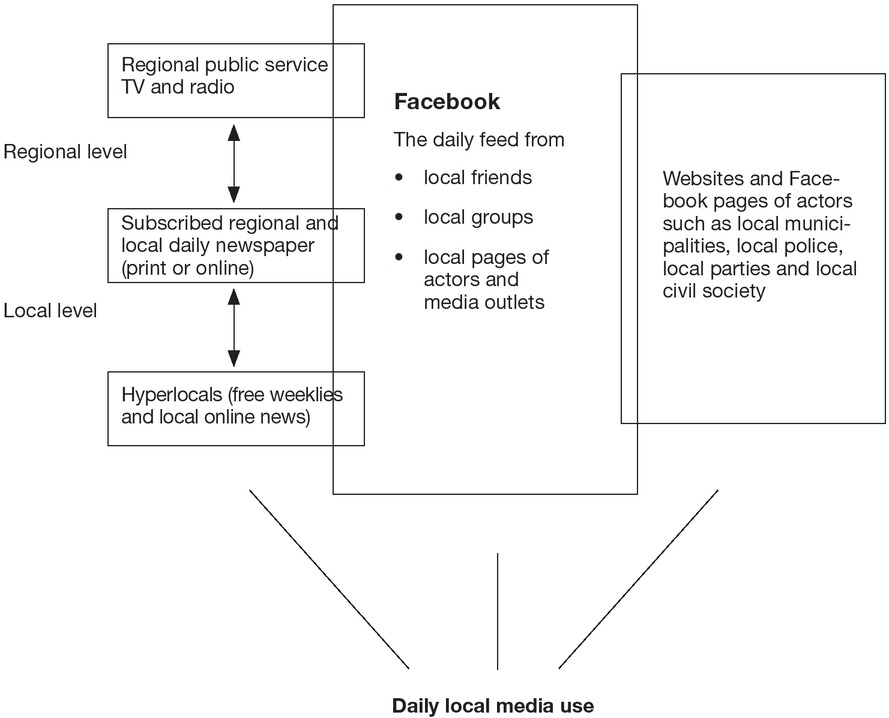
Figure 1
The centrality of Facebook in local media ecologies
Comments: Local media ecologies revolve around Facebook as the square where all kinds of actors meet. But what the individual media user sees depends on the algorithms of Facebook and what kind of content the user finds outside the Facebook universe directly from other media platforms and actors. There is also a flow between news outlets on different levels in both directions. Media and other actors use Facebook to find sources and stories, as a platform for interaction and for distribution of content.