

Table 1
Style and emotionality in news and cultural journalism (per cent)
| News (n=209) | Cultural journalism (n=105) | |
|---|---|---|
| Style** | ||
| Descriptive | 80 | 50 |
| Interpretative | 20 | 50 |
| Total | 100 | 100 |
| Emotionality | ||
| Emotional | 33 | 43 |
| Unemotional | 67 | 57 |
| Total | 100 | 100 |
[i] Note: **(p< .005)
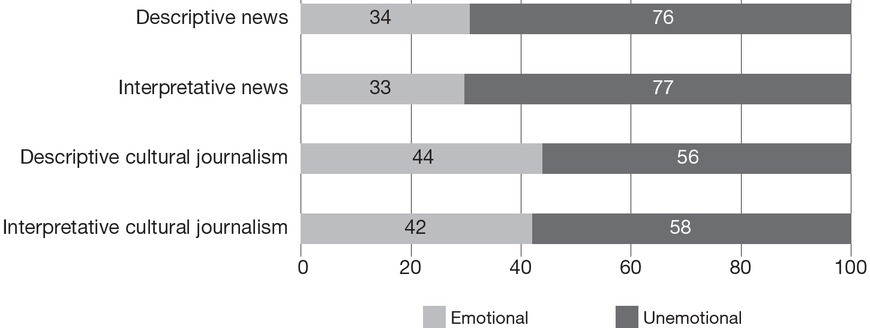
Figure 1
Emotionality in descriptive and interpretive news and cultural journalism (per cent)
Comment: Descriptive news (n=167), interpretative news (n=42). Descriptive cultural journalism (n=52), interpretative cultural journalism (n=53).
Table 2
Presence of problem frames (per cent)
| News (n=209) | Cultural journalism (n=105) | |
|---|---|---|
| Societal disruption* | 42 | 29 |
| Security/surveillance** | 40 | 12 |
| Islamic extremism* | 40 | 29 |
| War and conflicts | 26 | 20 |
| Migration* | 14 | 5 |
| Political incapacity | 13 | 11 |
| Inequality and segregation | 12 | 11 |
| Attack on values** | 9 | 29 |
| Racism* | 6 | 12 |
[i] Note: *(p< .05), **(p< .005).
Comment: Since the coding allowed for more than one frame per article/item, the total does not sum up to 100.
Table A
Presence of frames in descriptive and interpretative items (per cent)
| News | Cultural journalism | |||
|---|---|---|---|---|
| Descriptive (n=167) | Interpretative (n=42) | Descriptive (n=52) | Interpretative (n=53) | |
| Societal disruption | 47 | 19 | 40 | 17 |
| Security/surveillance | 38 | 45 | 4 | 21 |
| Islamic extremism | 37 | 55 | 14 | 43 |
| Inequality and segregation | 11 | 14 | 6 | 15 |
| Migration | 13 | 17 | 0 | 9 |
| Attack on values | 7 | 17 | 15 | 42 |
| Political incapacity | 9 | 31 | 6 | 17 |
| Racism | 4 | 14 | 8 | 17 |
| War and conflicts | 22 | 43 | 8 | 32 |
[i] Comment: Since the coding allowed for more than one frame per article/item, the total does not sum up to 100.