
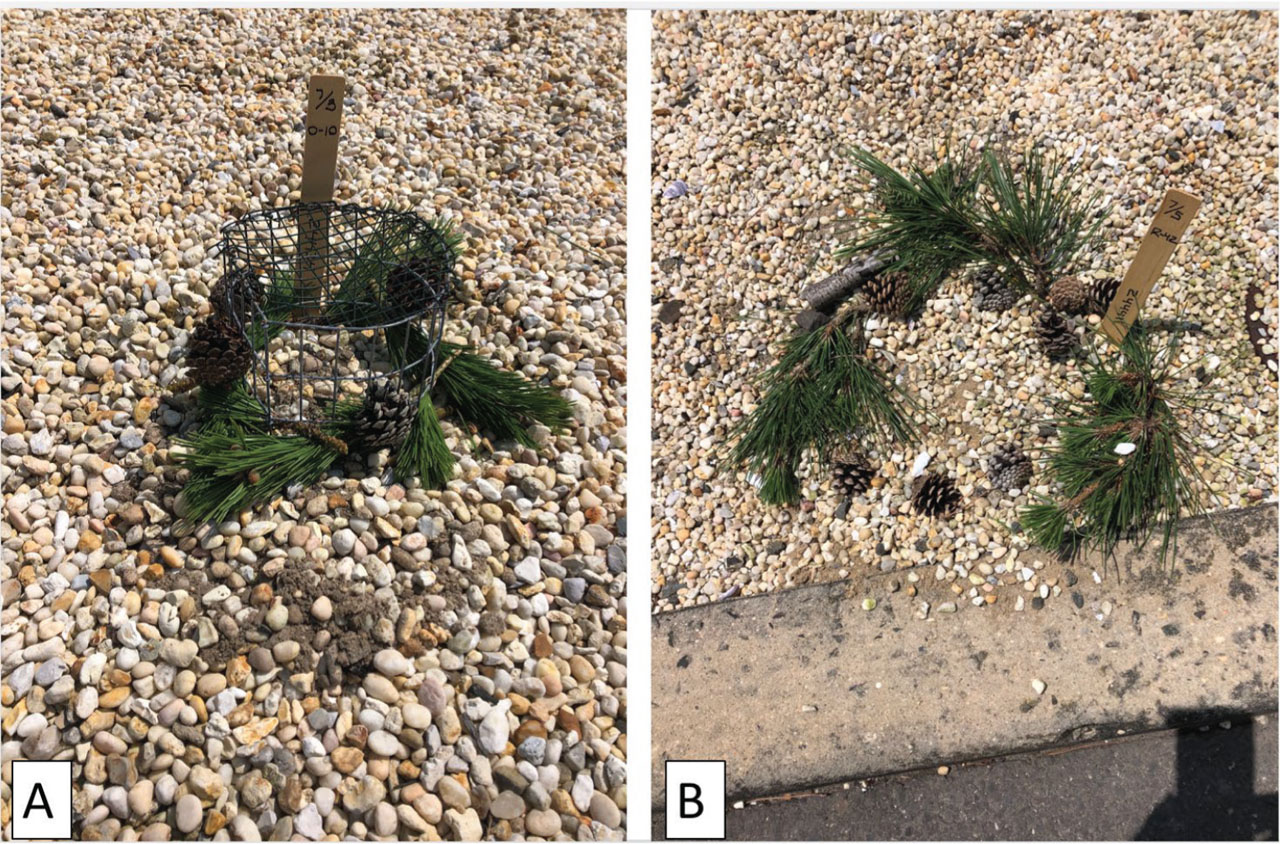
Figure 1.
(A – B). Nest protected with pine branches and pine cones: with cage (A) and without cage (B).
Table 1
Pine, No Pine, and Seaweed nest outcomes.
| Nest Outcome | Pine | No Pine | Seaweed | Total |
| Full Predation | 0 | 92 | 0 | 92 |
| Decoy | 8 | 12 | 1 | 21 |
| Emergence | 65 | 7 | 2 | 74 |
| Still Incubating | 13 | 0 | 0 | 13 |
| Non-viable | 0 | 3 | 1 | 4 |
| Total Nests | 86 | 114 | 4 | 204 |
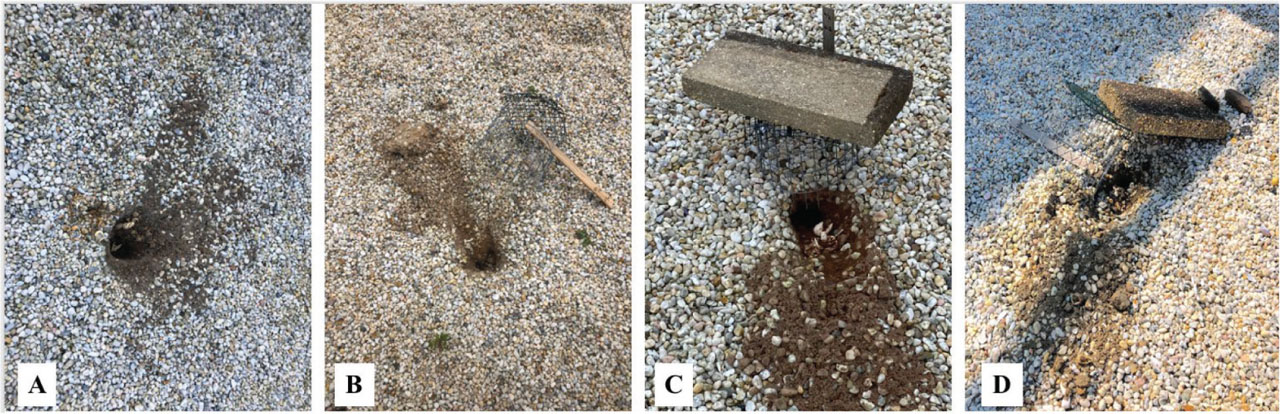
Figure 2.
(A – D). Predation of nests without pine or seaweed protection: (A) predated nest without cage; (B) predated nest with cage knocked over; (C) predated caged nest with paver; (D) predated nest with paver pushed off of the cage.
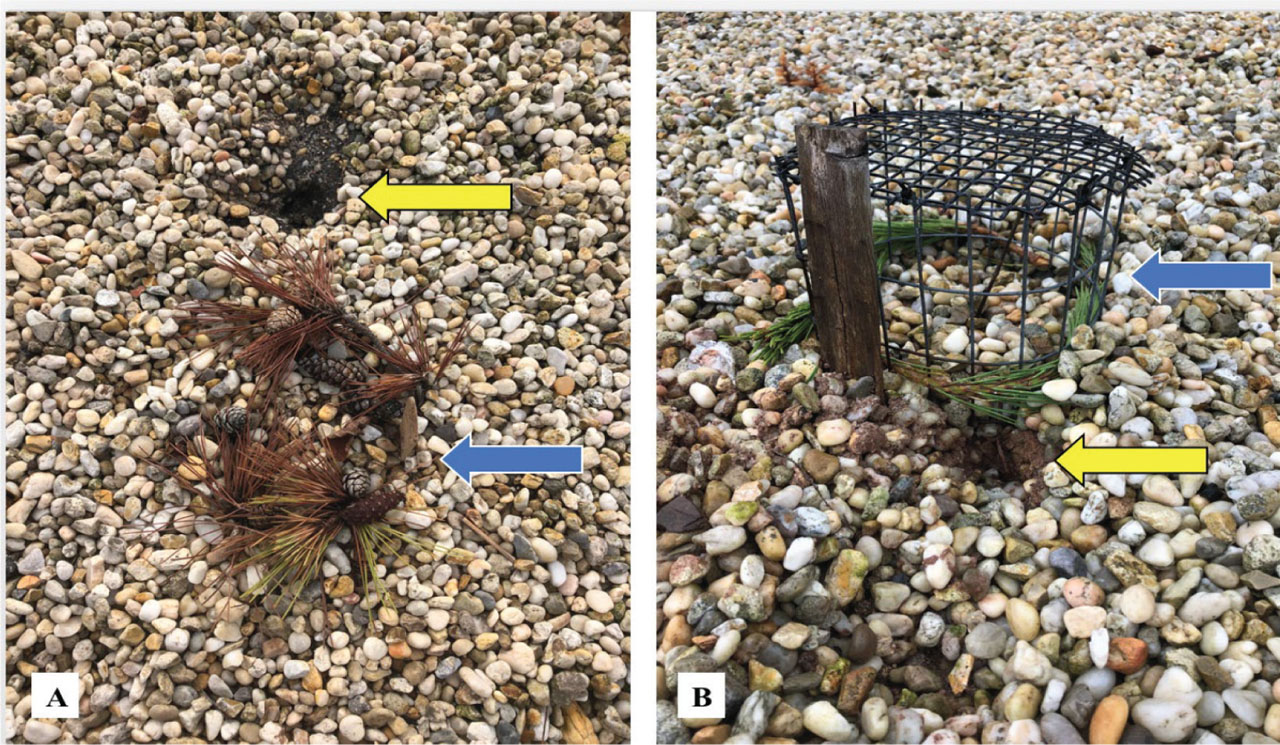
Figure 3.
(A – B). Predation attempts (yellow arrows) near/at pine protected uncaged (A) and caged (B) nests (blue arrows). No eggs were lost with these attempts.
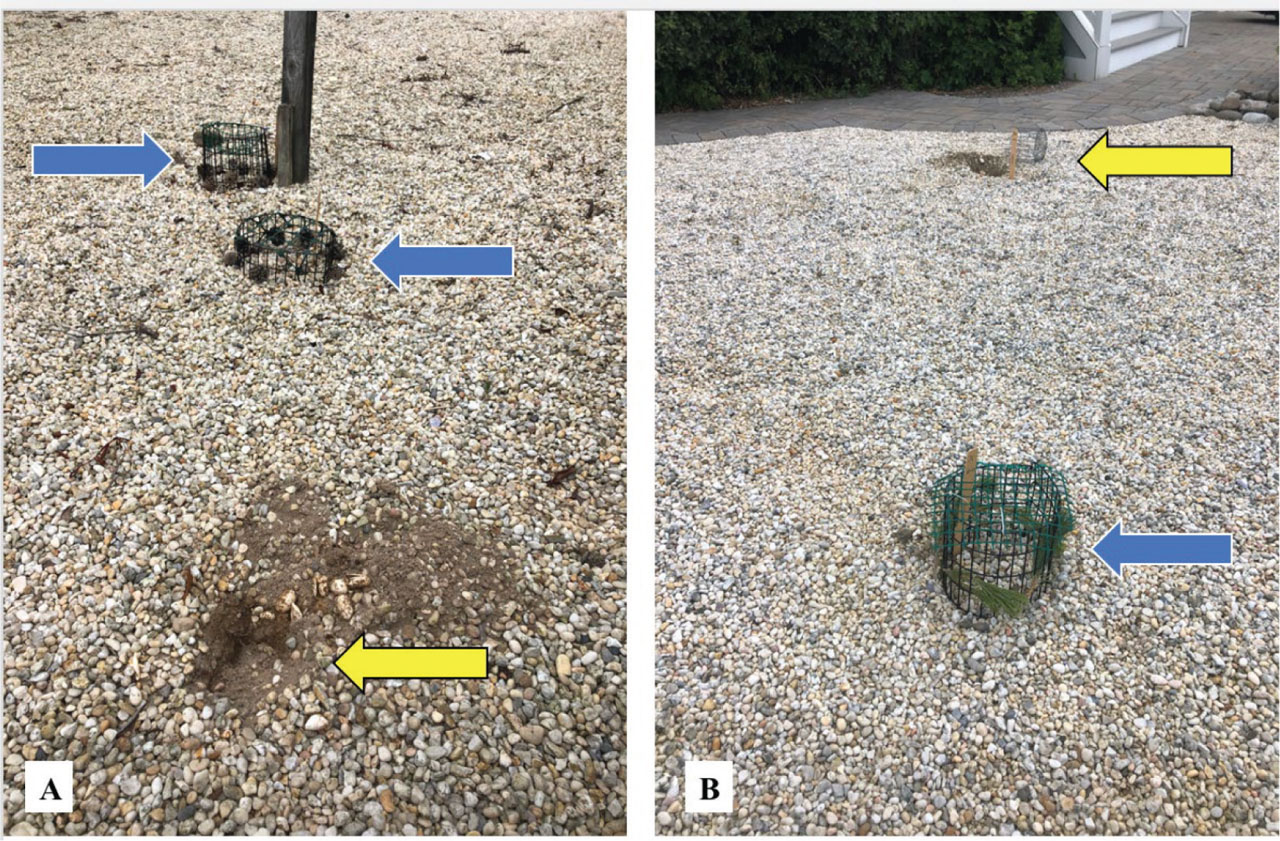
Figure 4.
(A – B). Predation of unprotected (no pine) uncaged (A) and caged (B) nests (yellow arrows), but no predation of nearby pine protected caged nests (blue arrows).
Table 2
pH readings recorded during 2023 and 2024 at nesting depths of 12.7 mm, 76.5 mm and 138.0 mm. In 2023, pH readings were taken in soil, next to a nest that did not contain pine. In 2024, pH was measured for pine nests, after emergence and within the walls of the nest cavity.
| 12.7 mm | 76.5 mm | 138.0 mm | ||||
| Year | Count | Mean pH ± SD | Count | Mean pH ± SD | Count | Mean pH ± SD |
| 2023 No Pine | 157 | 7.31 ± 0.26 | 111 | 7.56 ± 0.27 | 137 | 7.63 ± 0.18 |
| 2024 Pine | 56 | 7.09 ± 0.15 | 54 | 7.53 ± 0.46 | 52 | 7.62 ± 0.62 |