
1. Introduction
With the transition from Industry 4.0 (I4.0) to Industry 5.0 (I5.0), the responsibilities of people as participants in industrial systems have been profoundly changed. I5.0 represents human-centric systems, while I4.0 focuses on the role of Cyber-Physical Systems (CPS) in providing self-sufficient systems and productivity gains [1]. Through Human-Computer Interaction (HCI), human insight becomes equivalent to computing, and thus all human elements of creativity and decision-making are included in the processes, and human welfare is achieved in the industrial processes. A depiction of an environment enabled by Industry 5.0 is illustrated, where human ingenuity and worker welfare are united with the high precision, efficiency, and productivity that advanced computing systems provide [2]. This synergy intends to create a balanced participation between intelligent technologies and human capabilities, ensuring that technological advances not only improve operational results but also align with human intuition and skills. At the core of the idea of Industry 5.0 is a human-centered approach that puts the safety of the individual and the quality of human-technology interaction first [3]. In such cases, a flexible and intelligent HCI framework is very important, more so in situations of system malfunctions, carrying out maintenance proactively, and handling the changing complexities of industrial operations [4], [5]. This kind of system facilitates not only smooth, efficient workflows but also a safe, efficient work environment for human operators through seamless collaboration between people and machines. Thus, Fault Detection and Diagnosis (FDD) and the implementation of the human-centric aspect of Industry 5.0 philosophy, as the development of occupational health and safety [6], [7], are the most appropriate areas for applying these inputs due to their close relation and alignment with the focus on the human element and safe work conditions. Recent studies have indicated a need to improve HCI in the Industry 5.0 context by focusing on scalability, customization, and quick reaction. Espinoza Concha [8] set up a three-tiered HCI framework that included product, economic, and environmental dimensions, designed to generate more personalized outputs and foster better human-machine coordination. Their research highlighted the importance of user-centric design for improving system performance in general.
Pillai Murali Krishnan Rajasekhara [9] discussed major obstacles to data reliability in their research. They pointed out that inaccurate or incomplete data undermines the accuracy of predictive maintenance and, therefore, the decision-making process. They also reported the increasing mental demands of work, which may interfere with judgment in highly automated industrial sectors. Thus, Coman and Adela [10] came up with the concept of a human-digital twin as a bridge for human-robot collaboration. They argued that this model would personalize interactions by humanizing the characteristics inserted into Industry 5.0 systems. On the other hand, Nishat Atika [11] supported the idea of revising the operator's condition continuously as a basis for real-time customization. Therefore, if a human factor changes, the system changes accordingly. In a similar vein, Devi, VS. Anusuya et al. [12] have gone one step further by introducing of an augmented digital twin, which enables real-time data transfer and uninterrupted interfaces that simplify collaboration between humans and automation. Besides Azadi, Ali et al. [13] have highlighted the contribution of human-centered AI to additive manufacturing. The authors focus on design optimization and enhanced operational performance. However, these approaches, which are undoubtedly radical, are still in their infancy, and additional challenges must be tackled to bring them to fruition [14]. Troussas, C [15], even though they have discussed HCI in connection with additive manufacturing, barely scatted their field of study in industrial environments with complex problems. To ensure they perform effectively in such difficult areas, it is necessary to advance the development of dynamic task allocation and collaboration dashboards that enable real-time decision-making and scalability. Likewise, Yuan Ye [16] pointed out limitations in data quality, yet their research did not provide any efficient way to handle real-time data overflow under stressful conditions, which is one of the reasons why the decision-making process becomes exhausting. Besides, they indicated that workers' cognitive load is intensifying as automation expands, but their problem-solving methods lack a concrete framework for coping with such a mental burden in practice [17]. To address these issues, focusing on mental accessibility and creating efficient, smooth workflow designs is crucial, as they can ensure that operators have only the most necessary information available. This technique reduces the mental burden and improves decision accuracy. However, Ferracani, Andrea et al. [18] cast a net of human-digital twins out there. Still, the limitations of their concept are obvious when it comes to the mass adoption of the idea on the practical level. To make this model more appealing, it is imperative to add personalized task flows and adaptable/training systems that fit various operational situations. Explicitly, Calvano Miriana [19] put forward the method of real-time personalization, but did not go deep into the topic of how to keep data continuously updated to achieve the most accurate personalization possible. Because of this, it is very important to include the responsiveness of the system in real time so that the changes in the characteristics of the operator and his cognitive state can be realized without any buy-stops. The authors Safaei, Mohammad, and Ehsan Ghafourian [20] prepared a conceptual model. Nevertheless, they failed to provide tangible ways to embed human-centric elements into complex industrial environments. In a turnaround, using real-time behavioral analytics alongside interactive dashboards can be a great boost to improving the organization while also helping assign the most efficient tasks to human operators and automated systems. To highlight this point, Duan, Shiyu [21] mentioned the difficulties in deploying artificial intelligence (AI) in a case of limited data provision and, at the same time, in a very complex setting where there is an interwoven relationship between AI technologies, the properties of the materials, and human resources. Addressing these issues requires a stronger focus on interdisciplinary collaboration and adaptable task management strategies, thereby making AI tools more user-friendly and functionally relevant for operators navigating complex operational ecosystems.
A. Previous works
The HCI refers to a domain of investigation and innovation that encompasses approaches, conceptual frameworks, and applied practices aimed at the planning, development, and assessment of interactive digital systems [22]. These systems include components such as hardware, software, input/output interfaces, visual displays, instructional materials, and user guides, all designed to enable individuals to interact with them in a productive, accurate, secure, and satisfying manner [23]. HCI is inherently interdisciplinary in its execution and draws from a variety of foundational disciplines. It integrates and modifies elements from diverse areas such as human factors (e.g., foundational methods for task evaluation and designing systems to minimize human error), ergonomics (e.g., foundational principles for developing tools, workstations, and occupational settings), cognitive psychology (e.g., foundational theories for user behavior modeling), behavioral psychology and psychometrics (e.g., foundations for measuring user efficiency and outcomes), systems engineering (e.g., foundational techniques for preliminary system analysis), and computer science (e.g., foundational knowledge for interface design, development tools, and software structure) [24]. The primary objective across the entire discipline of HCI is to ensure a high level of usability for individuals interacting with digital systems. Contrary to common misconceptions that view usability as vague or abstract, it is, in fact, a concrete concept that can be measured. Usability is generally understood as the “ease of use” of a system, encompassing quantifiable factors such as how quickly users can learn to operate the system, the efficiency with which tasks are performed, the frequency of user mistakes, and overall user satisfaction [25]. Nevertheless, a system that is easy to navigate but fails to meet the functional requirements of its users ultimately holds limited practical value. Consequently, the definition of usability has progressed to a broader notion known as “usability in the large,” which integrates both ease of use and the system's relevance and effectiveness in fulfilling user needs [26].
For advanced or experienced users, the most critical aspect of usability is often its practicality, specifically, how effectively the system enables direct access to features and functions without causing interference or delay. This perspective differs from the more conventional interpretation of usability, which typically prioritizes ease of learning and comprehension for beginners or occasional users [27]. Nonetheless, usability for all user types is still assessed using key indicators such as efficiency, task performance, and user satisfaction; the distinction lies in how these indicators are valued and interpreted by expert users. For this group, the expectations and benchmarks are notably different. A well-known saying originally applied to people also serves as a fitting guideline for designing user interfaces: “Lead, follow, or get out of the way. An effective interface design guides novice users through tasks, supports intermediate users with clear and responsive feedback, and stays unobtrusive for expert users, allowing them to operate with speed and autonomy [1], [28]. Despite significant progress in the development of interactive digital systems, numerous usability challenges continue to limit accessibility and reduce the effectiveness of computing technologies. These obstacles not only hinder user engagement but also prevent society from fully benefiting from the substantial investments made in information technology. Such usability issues diminish human productivity and have widespread implications across various sectors, including business, government, industry, education, and society at large [29]. Historically, computer use was limited to a niche group of technically inclined individuals who often embraced the complexity of poorly designed systems. For these early adopters, difficult interfaces served as a gatekeeping mechanism, preserving the exclusivity of their expertise and, indirectly, their professional relevance. In that context, poor usability contributed to the mystique of computing and offered a form of job protection [29]. Today, however, the landscape has changed dramatically. A vast and diverse population now interacts with computers, and for most users, the user interface has become the focal point of the digital experience. In many cases, the interface is perceived as synonymous with the system itself. The way users interact with a system has become as vital as its computational capabilities, making usability a central concern in technology adoption and effectiveness [30].
B. Objectives
The investigation into Human-Computer Interaction (HCI) reveals a rich and comprehensive exploration of usability and its central role in a wide variety of user groups. Research emphasizes the inherently multidisciplinary nature of HCI by integrating findings from cognitive psychology, ergonomics, systems engineering, and computer science. Special attention is given to core usability factors like task performance, user satisfaction, and operational efficiency, which collectively define the effectiveness and flexibility of interactive digital systems. However, there is a glaring technical deficiency that has not been addressed: no formal diagnosis of the most influential factors affecting the performance of predictive models built to enhance usability. While usability is expressed in numerical terms to a certain extent, an effort has been made to empirically determine which specific inputs most notably influence the forecast accuracy and functional reliability of such systems. Such a lack can be addressed through the use of a systematic diagnostic framework to identify the most important influencing factors on model performance, which is the prime focus of this investigation. Technically, this involves employing feature evaluation techniques that rank input variables by their contribution to the system output, followed by sensitivity analyses that measure the system’s responsiveness to variations in such inputs. These techniques enable researchers to reveal underlying patterns and dependencies and determine which user actions, interface features, or contextual factors exert the most impact on real-world performance. By identifying influential factors, one can further develop the HCI system design so that it is not only technically accurate but also contextually fitting to the diverse needs of users. This enables one to design interfaces that are responsive, effective, and optimized for both expert and novice users. Besides, the ability to trace system behavior back to single variables supports transparency and trust in computer systems in solving usability, interpretability, and adaptability problems. Following this, in line with the purpose of this directed diagnostic method, the existing literature gap could be effectively solved, improving both the theoretical and practical aspects of HCI.
2. Data Gathering
Data were generated using a synthetic simulation framework designed to replicate authentic HCI environments. The dataset comprises 1500 interaction instances. To ensure the applicability of the models, the simulation parameters were calibrated to reflect real-world user demographics. The age variable was generated with a range of 18 to 64 years, maintaining a mean of 41.32 years. The gender distribution follows a balanced ratio, with approximately 55 % male and 45 % female. Experience levels were synthesized in three distinct categories (Beginner, Intermediate, and Advanced) to represent diverse user proficiencies. Interaction features, including mouse distance, clicks per minute, and session duration, were derived from algorithmic distributions mirroring actual user behavior patterns. Following generation, the database was split into two distinct subsets: 80 % for training and 20 % for testing. This partition enables the estimation and verification of predictive models. The training subset was used to estimate the models and identify patterns in the data, while the testing subset was reserved for the assessment of the generalization capability and resilience of the models on new data.
The target variable classifies user interaction into five levels of engagement: Very Low (Class 1), Low (Class 2), Moderate (Class 3), High (Class 4), and Very High (Class 5). These categories were synthetically generated based on composite scores of key metrics, such as session duration, click frequency, and task completion time. Higher values in these features correspond to higher engagement classes, enabling the models to distinguish between varying degrees of user involvement.
The overview of the dataset in Table 1 classifies the distribution behavior into two types: normal and uniform. In a normal distribution, session duration, clicks per minute, scroll depth %, mouse distance, task time to complete, age, and complexity of the interface reveal details about user behavior and activity. Session time, presented as a normalized metric, ranges from −2.41 to 69.26, with a mean of 30.06 and a standard deviation of 9.96, i.e., moderate variation; however, the negative minimum suggests anomalies or a normalized transformation. Clicks per minute, normalized to a standard scale, range between −2.84 and 12.06, with a mean of 4.98. This normalized mean serves as the baseline for average degrees of engagement relative to the dataset distribution. Mouse distance is also highly variable, ranging from 0.70 to over 3,200 pixels and averaging 1017.62, indicating highly variable interaction strength. Task completion times are also highly variable, averaging 300.42 seconds and having a standard deviation of 98.93, indicating highly variable task difficulty or user proficiency. The age distribution is fairly wide, with an average of 41.32 years. Interface complexity, scaled from 1 to 10, reflects medium complexity levels with a mean of 5 under the assumption of a balanced design. The uniform distribution depicts categorical variables with fixed lower and upper bounds. Keyboard activity levels range from 0 to 2, corresponding to discrete levels of activity, while errors range between 0 and 10, reflecting variability in user performance. Help requests are also binary, 0 to 1, whether or not help was requested. Device type is also categorical, 0 to 2, representing different types of devices. Experience level and gender are represented as categorical variables with values ranging from 0 to 2, corresponding to distinct classifications such as non-experienced/experienced and male/female/other categories. Satisfaction scores range from 1 to 5 and reflect user satisfaction levels. These variable summaries provide comprehensive information on user interaction, device, and demographic variables, enabling focused analysis and model training to predict user behavior and optimize interfaces.
Table 1.
Summary of the dataset based on two distribution categories.
| Distribution | Variables | Indicators | |||
|---|---|---|---|---|---|
| Min | Max | Average | Standard deviation | ||
| Normal | Session length | –2.41 | 69.26 | 30.06 | 9.96 |
| Clicks per minute | –2.84 | 12.06 | 4.98 | 2.02 | |
| Scroll depth percent | 7.49 | 100.00 | 74.18 | 18.14 | |
| Mouse distance Px | 0.70 | 3239.54 | 1017.62 | 482.40 | |
| Interface complexity | 1.00 | 10.00 | 5.02 | 1.95 | |
| Task completion time | 0.05 | 640.97 | 300.42 | 98.93 | |
| Age | 18.00 | 64.00 | 41.32 | 13.51 | |
| Lower bound | Upper bound | ||||
| Uniform | Keyboard activity level | 0 | 2 | ||
| Errors made | 0 | 10 | |||
| Help requested | 0 | 1 | |||
| Device type | 0 | 2 | |||
| Experience level | 0 | 2 | |||
| Gender | 0 | 2 | |||
| Satisfaction score | 1 | 5 | |||
Correlation among the selected inputs, age, mouse distance in pixels, complexity of the interface, and satisfaction scores demonstrates strong relationships based on Fig. 1. Age, being a demographic variable, is generally found to be weak to moderately correlated with satisfaction, suggesting variations in comfort with technology or expectations, but with likely context-dependent effects. Mouse distance, or total user movement while active, typically indicates involvement or proficiency; higher distances may be negatively correlated with satisfaction, indicating user frustration or struggle, yet in some contexts, higher movement may indicate active discovery. Interface complexity on a one-to-ten scale is theoretically inversely correlated with satisfaction: higher complexity interfaces lead to mental overload and lower user satisfaction, substantiating a negative correlation. Throughout the analysis, these particular inputs were prioritized among other variables due to their hypothesized or proven influence on user experience and their high correlation coefficients. From the research, it is evident that interface complexity shows the strongest negative correlation with satisfaction, suggesting that enhancing user satisfaction can be achieved by alleviating interface complexity. Age and distance of the mouse show weaker but no less significant correlations since they too can affect user perception and interaction ease. Interface modifications targeted to these inputs can be implemented to optimize total user satisfaction based on quantitative measures of their impact.
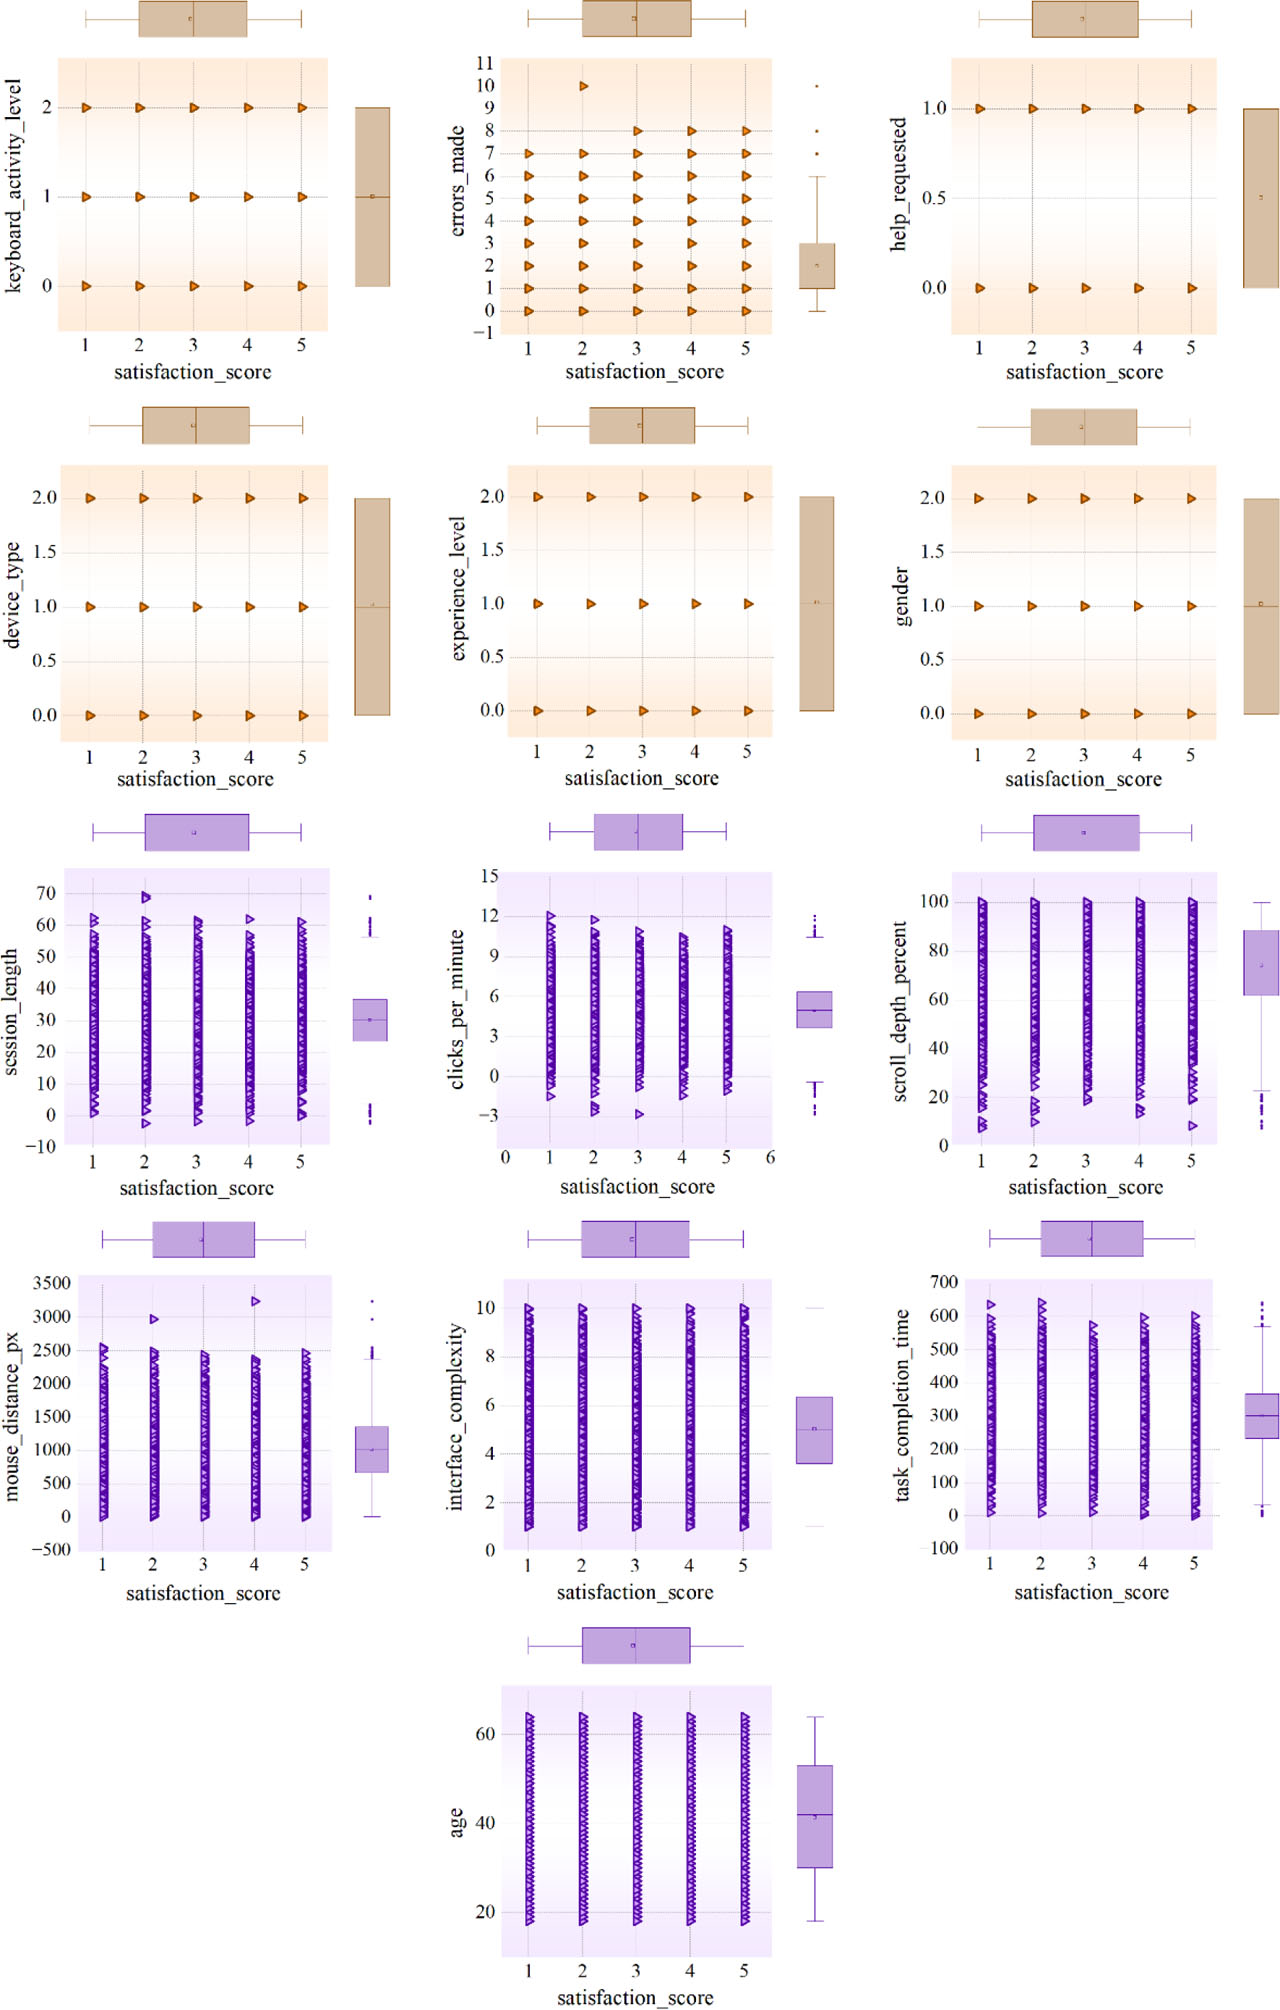
Fig. 1.
Box-scatter plot for the dataset.
3. Methods
The Random Forest Classification (RFC) and Decision Tree Classification (DTC) are widely used machine learning (ML) algorithms for continuous value prediction [31]. DTC divides the data into subsets based on feature values. It builds a tree structure in which each internal node is a decision based on a specific feature, and each leaf node corresponds to a predicted value. The model recursively splits the dataset into subsets to reduce variance within each subset. DTC is a simple method that will overfit the training set the most, especially if the tree is too deep. Overfitting leads to bad generalization on novel data, and the model may be very sensitive to small fluctuations in the input. On the other hand, RFC has an advantage over DTC in that it builds an ensemble of DTs rather than relying on a single one [32]. During training, multiple trees are generated from various portions of the data and features. The variety in trees is what enables RFC to reduce variance and avoid overfitting. Prediction is done by averaging the outputs of each individual tree, resulting in more stable and accurate outcomes [32]. RFC is robust to noise, efficient for large data, and provides an estimate of feature importance, which is helpful for identifying the input variables that make the greatest contribution to the target.
The performance of RFC and DTC can be optimized using optimization algorithms such as the Fox Optimizer (FO) and Northern Goshawk Optimization (NGO). FO is inspired by the foraging behavior of foxes, which wisely wander to identify sources of food. This optimizer toggles between global and local search behaviors and is therefore well-suited for hyperparameter optimization. By adjusting key parameters such as tree depth, the minimum number of samples to split, and the number of trees, FO improves the quality of predictions and generalization abilities of the model. NGO derives inspiration from the hunting style of the Northern Goshawk, a bird that chases at high velocities and employs cautious attack tactics. It applies an exploration-and-exploitation phase that continuously develops solutions [34]. It dynamically changes the search strategy to optimize, helping models escape local minima and converge to better solutions. When combined with RFC or DTC, the NGO effectively searches for the optimal parameter tuning, thereby enhancing model performance and stability, particularly on those high-dimensional, complex problems. FO and NGO are both efficient tools for ML model tuning, leading to more stable and accurate regression results [35]–[38].
A. Performance evaluation metrics
In performance evaluation, accuracy refers to the fraction of true predictions made by a model out of all forecasts. It is determined by dividing the number of correct forecasts by the total number of guesses, then dividing by 100 %. While a frequent statistic, it may not accurately reflect a model's performance, particularly in unbalanced datasets. Other metrics, such as accuracy, recall, and F1-score, provide more details on how well the model is performing in the classification tasks.
In the following equations (1)–(4), TP (True Positive) represents the number of positive instances correctly classified as positive, while TN (True Negative) denotes the number of negative instances correctly classified as negative. FP (False Positive) refers to the number of negative instances incorrectly classified as positive, whereas FN (False Negative) represents the number of positive instances incorrectly classified as negative. Moreover, P denotes the total number of actual positive instances and is calculated as P=TP+FN. For the multiclass classification problem, these quantities are calculated separately for each class by considering the selected class as positive and the remaining classes as negative.
In the context of performance evaluation, precision means the part of correct positive predictions among all positive predictions a model has generated. It shows the model's capability to ensure that no false positives occur. Precision is calculated as the ratio of true positive predictions to the total number of true positive and false positive predictions. It is a very important measure when it comes to applications in which cutting down false positives to a minimum is vital, such as medical diagnosis or spam identification.
The F1-score is a binary classification task performance metric that represents both accuracy and recall in one number. This number is the harmonic mean of accuracy and recall, thus giving a fair verdict. Higher scores, measured from 0 to 1, indicate superior performance. The F1-score is especially useful when the class distribution is skewed, as it provides a full assessment of a model's ability to balance accuracy (minimizing false positives) and recall (minimizing false negatives).
Recall is defined as the fraction of correctly predicted positive instances among all positive instances in a dataset. It represents the model's ability to detect all positive situations while reducing false negatives accurately. Recall is determined by dividing the number of true positive predictions by the total of true positives and false negatives. It is an important measure, especially in applications where losing positive cases is expensive, such as medical diagnosis or anomaly detection.
B. Hyperparameter tuning
Table 2 shows the hyperparameter tuning outcomes for different models, including some modifications made to each to achieve optimal performance. The DT models, DTNO (Decision Tree optimized by Northern Goshawk) and DTFO (Decision Tree optimized by Fox Optimizer), have vastly different depth values (Max_depth), DTNO up to 33 and DTFO up to 48, reflecting a significant difference in the trees' complexity. The minimum number of samples to split a node (Min_samples_split) is 7 for DTNO and 32 for DTFO, suggesting a more conservative split rule for DTFO, perhaps to prevent overfitting. The minimum number of samples for a leaf node (Min_samples_leaf) is 5 for DTNO and 21 for DTFO; the larger values in DTFO suggest that it prefers simpler, more generalized trees. The DTNO's maximum leaf node number (Max_leaf_nodes) is 11, whereas that of DTFO is 3, reflecting various strategies in depth and complexity control once again. For the RF models RFNO (Random Forest optimized by Northern Goshawk) and RFFO (Random Forest optimized by Fox Optimizer), the estimators (trees) are quite distinct (N_estimators), with RFNO having 876 and RFFO having 378, indicating different efforts in ensemble size to strike a balance between bias and variance. The maximum depth (Max_depth) in RFNO is 145, while RFFO has a maximum of 55, both using different regularization mechanisms to improve generalization. The minimum samples to split (Min_samples_split) and to have in a leaf (Min_samples_leaf) are set to 24 and 12 for RFNO and 31 and 15 for RFFO, respectively, to deliberately limit tree growth so that there is no overfitting while maintaining depth.
Table 2.
Obtained results of the fine-tuning values.
| Hyperparameters | Model | |||
|---|---|---|---|---|
| DTNO | DTFO | RFNO | RFFO | |
| N_estimators | – | – | 876 | 378 |
| Max_depth | 33 | 48 | 145 | 55 |
| Min_samples_split | 7 | 32 | 24 | 31 |
| Min_samples_leaf | 5 | 21 | 12 | 15 |
| Max_leaf_nodes | 11 | 3 | – | – |
These parameter selection options reveal a detailed trade-off between model complexity maximization and generalizability potential, with greater trees and ensembles tending to yield more adequate results but at a higher risk of overfitting, which these constraints aim to mitigate. The variations suggest significant hyperparameter optimization unique to each model formulation and dataset properties to yield the best predictive accuracy and robustness.
4. Results
This section presents the performance of the models developed across different phases and classes, using tables and different plots.
As observed from the analysis of Table 3, among the tested models, the RFFO model performed better overall in both the training and testing phases. In the training process, the highest values of all the indices, accuracy, precision, recall, and F1-score, were achieved by RFFO, with each being 0.992, which shows remarkable learning and generalization capacity in the training set. The results of the test process validate this model's strength, as it achieves the best performance with 0.984 across all measures, indicating good predictive accuracy and stability on unseen data. The DTFO model also performs well, ranking second in both phases, with lower but still high measurements to RFFO, especially during the test phase, where it recorded a score of 0.974. This predictability implies it is indeed a strong contender once further optimized. Other models, such as RFNO and DTNO, also achieved satisfactory performance, although a noticeable performance gap remained compared with RFFO and DTFO. The DTC and RFC models perform relatively worse across both phases, indicating worse generalization. Following these results, RFFO is currently the highest-performing model in both stages, with DTFO set to take this place after potential optimization. The absence of substantial loss in RFFO's performance from the training to the test stages also speaks to better model stability.
Table 3.
Performance of the developed models in the training and testing phases.
| Model | Index values | ||||
|---|---|---|---|---|---|
| Accuracy | Precision | Recall | F1-score | ||
| Train | DTC | 0.952 | 0.952 | 0.952 | 0.952 |
| DTNO | 0.969 | 0.969 | 0.969 | 0.969 | |
| DTFO | 0.982 | 0.982 | 0.982 | 0.982 | |
| RFC | 0.960 | 0.960 | 0.960 | 0.960 | |
| RFNO | 0.980 | 0.980 | 0.980 | 0.979 | |
| RFFO | 0.992 | 0.992 | 0.992 | 0.992 | |
| Test | DTC | 0.933 | 0.934 | 0.933 | 0.933 |
| DTNO | 0.936 | 0.936 | 0.936 | 0.936 | |
| DTFO | 0.974 | 0.974 | 0.974 | 0.974 | |
| RFC | 0.937 | 0.937 | 0.937 | 0.937 | |
| RFNO | 0.940 | 0.940 | 0.940 | 0.940 | |
| RFFO | 0.984 | 0.984 | 0.984 | 0.984 | |
Table 4 presents a comparison across five classes, indicating that the RFFO model consistently achieves the highest precision, recall, and F1-score values, all approximately 0.99, reflecting near-perfect performance across all classes. This near-perfect score of this model shows that it performs better than all other models in every class, making it the overall best performer. Hot on its heels is the DTFO, whose performance is 0.98 for precision, recall, and F1-score across all classes, showing moderate but extremely high classification capability. The RFNO model is operating very well, with scores between 0.96 and 0.98, which is clearly better than the slightly inferior DTNO model, which ranges from 0.95 to 0.97. Both are moderate-performance models, but RFNO is just slightly better than DTNO due to higher consistency and slightly better scores, especially in classes 3 and 5. DTC and RFC have relatively lower precision, recall, and F1-score, predominantly in the range 0.94–0.96, reflecting poor performance compared to the others. DTC and RFC are potentially poor at achieving equal accuracy for all classes and, thus, exhibit weak performance. RFFO ranks as the overall best model, DTFO and RFNO as moderate, while DTC and RFC are weaker models in this classification task.
Table 4.
Comparison between the models in five classes.
| DT models | RF models | |||||
|---|---|---|---|---|---|---|
| DTC | RFC | |||||
| Class | Precision | Recall | F1-score | Precision | Recall | F1-score |
| 1 | 0.95 | 0.95 | 0.95 | 0.96 | 0.95 | 0.96 |
| 2 | 0.95 | 0.95 | 0.95 | 0.96 | 0.96 | 0.96 |
| 3 | 0.95 | 0.95 | 0.95 | 0.95 | 0.96 | 0.95 |
| 4 | 0.96 | 0.94 | 0.95 | 0.96 | 0.96 | 0.96 |
| 5 | 0.94 | 0.95 | 0.95 | 0.95 | 0.96 | 0.95 |
| DTNO | RFNO | |||||
| Precision | Recall | F1-score | Precision | Recall | F1-score | |
| 1 | 0.97 | 0.96 | 0.96 | 0.97 | 0.97 | 0.97 |
| 2 | 0.97 | 0.96 | 0.97 | 0.97 | 0.97 | 0.97 |
| 3 | 0.95 | 0.96 | 0.95 | 0.98 | 0.98 | 0.98 |
| 4 | 0.96 | 0.96 | 0.96 | 0.97 | 0.96 | 0.97 |
| 5 | 0.96 | 0.97 | 0.97 | 0.98 | 0.97 | 0.98 |
| DTFO | RFFO | |||||
| Precision | Recall | F1-score | Precision | Recall | F1-score | |
| 1 | 0.98 | 0.98 | 0.98 | 0.99 | 0.99 | 0.99 |
| 2 | 0.98 | 0.98 | 0.98 | 0.99 | 0.99 | 0.99 |
| 3 | 0.98 | 0.98 | 0.98 | 0.99 | 1.00 | 0.99 |
| 4 | 0.98 | 0.98 | 0.98 | 0.99 | 0.99 | 0.99 |
| 5 | 0.98 | 0.98 | 0.98 | 0.99 | 0.99 | 0.99 |
According to Fig. 2, the six models, DTC, RFC, DTNO, RFNO, DTFO, and RFFO, perform well in classification, with overall accuracies typically falling within the range of 96 % to 98 %. RFC performs extremely well with minimal misclassification, indicating its ability to handle the data. DTC and RFFO perform just as well, but with more confusion among neighboring classes, especially between classes 1, 2, and 3. RFNO and DTNO also perform well, but confusion also lies largely between classes, with subtle differences. DTFO and RFFO, which may use different feature selections or hyperparameters, have slightly higher misclassification rates but still perform well overall. The overall tendency in these models is to misclassify the surrounding classes, for example, class 2 to class 1 or 3, showing the difficulty in classifying analogous classes in feature space. More accurate models, especially RFC and DTFO, have stronger boundary definitions and, therefore, can be deemed more reliable for actual applications with precise classification. Minor inaccuracy between models may be due to similar class features, data noise, or inadequate feature separation. Model specificity can be enhanced by tightening feature selection, enhancing data diversity, or using more sophisticated algorithms. All models, irrespective of minor differences, provide useful insights, and among them, RFC and DTFO excel with high accuracy and lower misclassification. The observed pattern highlights the importance of respecting class boundaries and feature differentiation in future work to further improve model robustness and prediction accuracy. Overall, these models are extremely effective, but continued fine-tuning and testing are recommended to maximize their performance in complex real-world contexts.
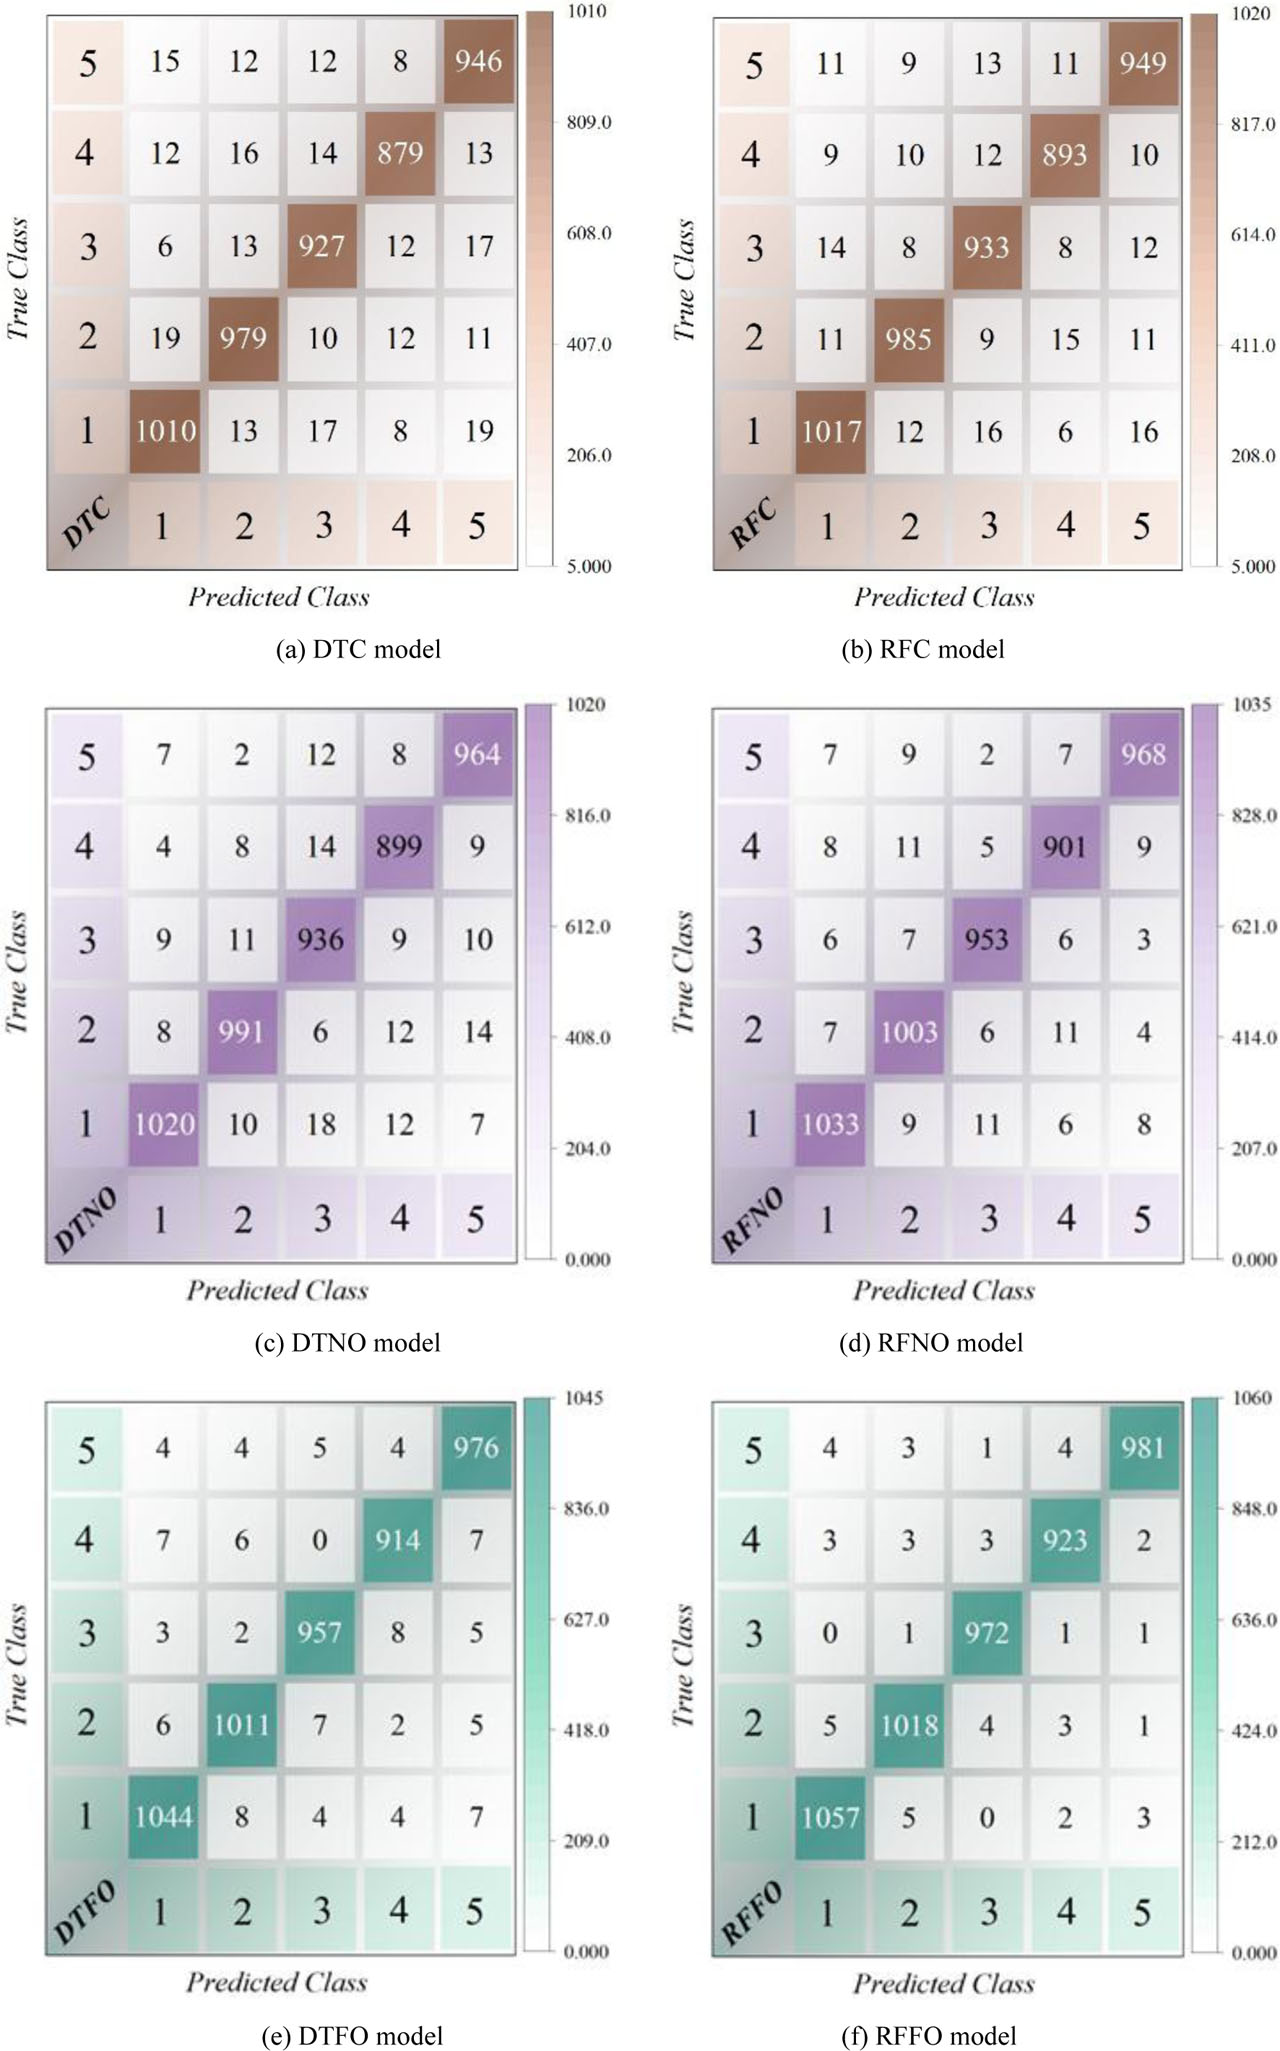
Fig. 2.
Confusion matrix for the accuracy of the developed models.
The ROC curves in Fig. 3, displayed for the models, show each model’s capacity to distinguish between the positive and negative classes across a range of false positive rates. All four models are revealed to follow the trend where the True Positive Rate (TPR) approaches 1 as the False Positive Rate (FPR) increases, characteristic of good-discriminating classifiers. The DTNO and DTFO curves are steeper and closer to the top-left, indicating that these models achieve higher TPRs at lower FPRs compared to RFFO and RFNO, whose curves are less steep. These indicate that DTFO and DTNO have a better ability to maintain high sensitivity with low false positives, which is critical in situations where false alarms are costly. The proximity of the ROC curves to the (0,1) ideal point indicates very good overall model performance, while the slope with higher values indicates successful discrimination thresholds. The minor fluctuations between the curves show that, while all models are good, the variants (DTFO, DTNO) are better than the base (F and R) models, especially at low FPR levels. This implies better true positive rate retention at the same false positive rate, which is equivalent to higher Area Under the Curve (AUC) values.
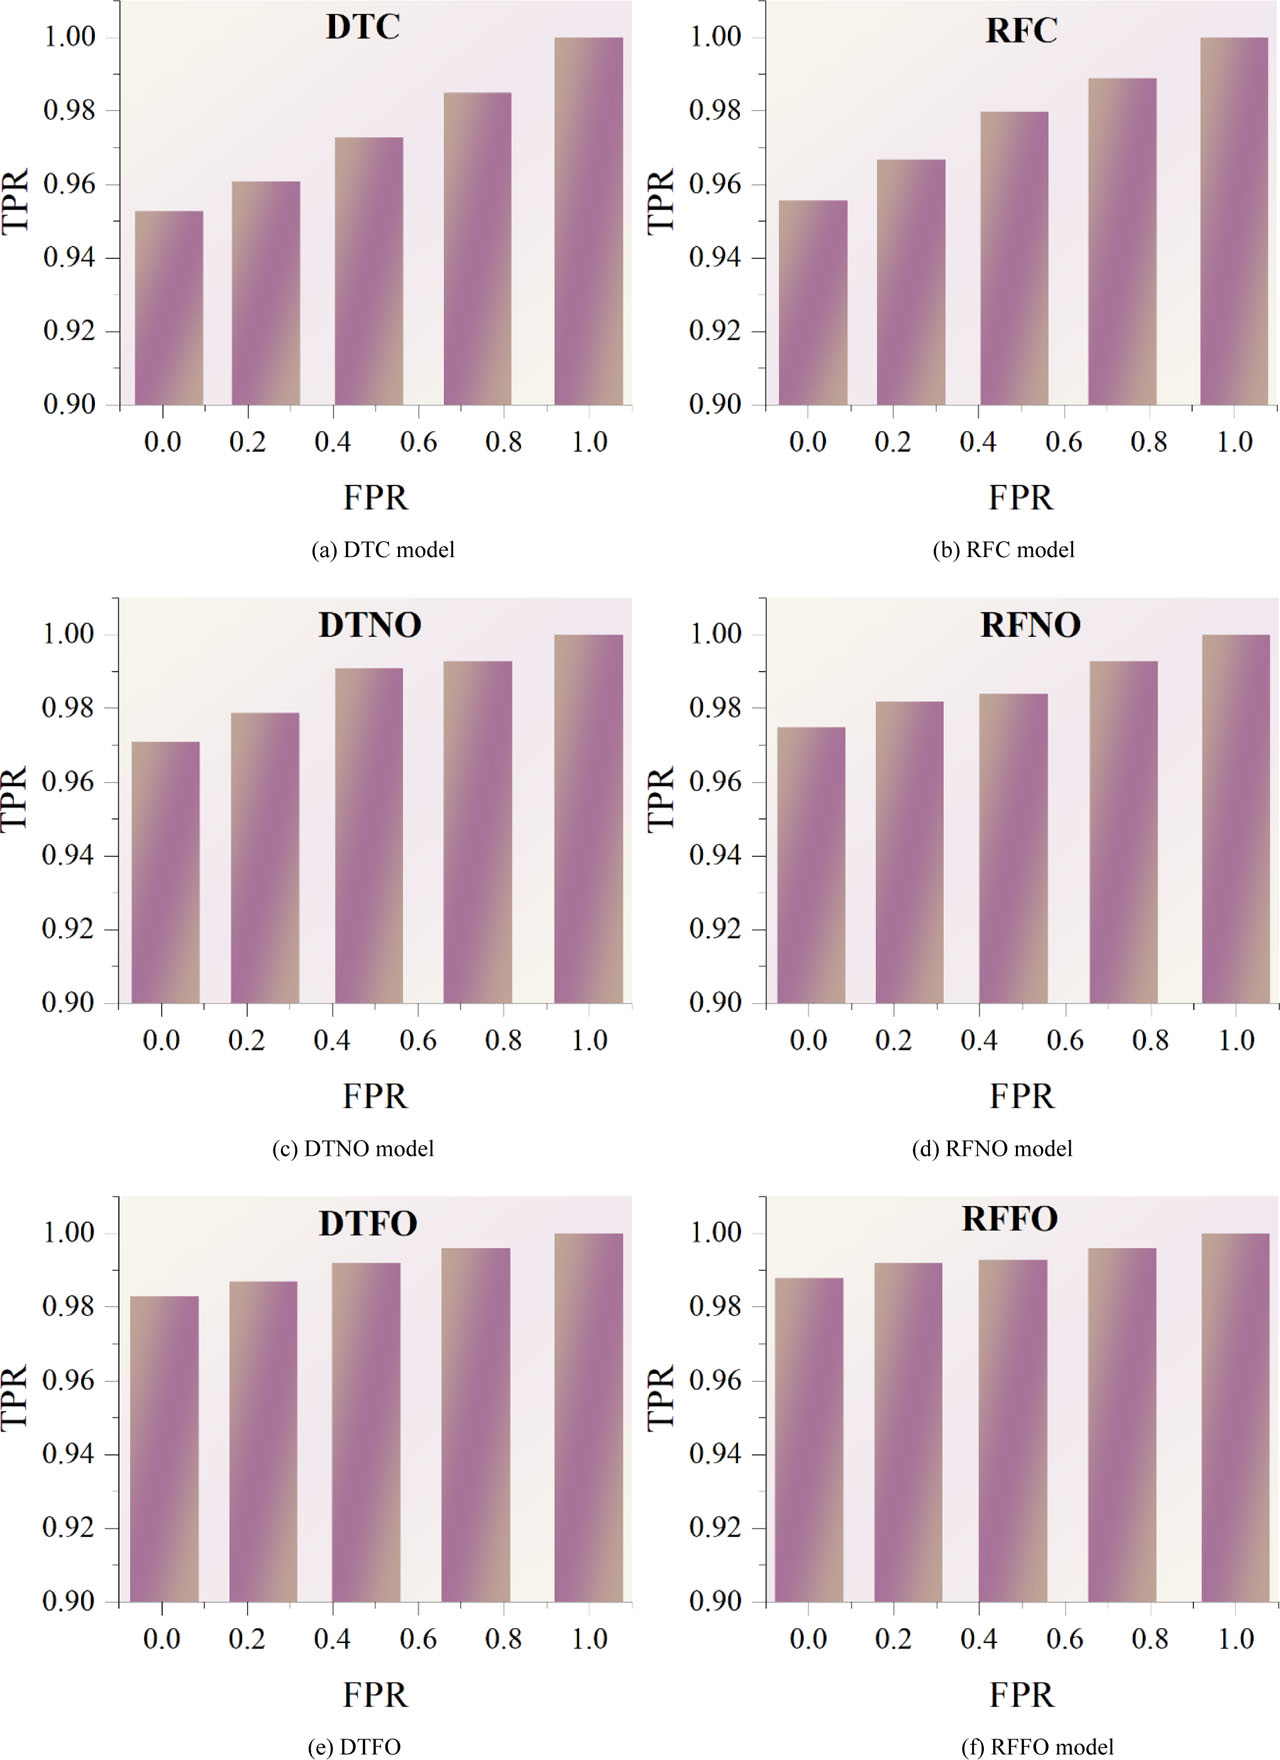
Fig. 3.
Comparison of TPR versus FPR for the studied models.
In a real-world context, the hierarchies of performance shown in these ROC plots are crucial for selecting the optimal model given the operational FPR limit. For instance, when low false positives are needed, the more nearly vertical models (DTFO and DTNO) are preferred. The variations in the ROC curves confirm that modifications or variations of the models improve their discriminative power, especially when setting thresholds to optimally balance sensitivity and specificity. By and large, these ROC curves provide a clear picture of the relative efficacies of the models, highlighting the robustness of DTFO and DTNO in achieving improved detection ratios with controlled false alarms.
The 3D bar chart in Fig. 4 shows the results of the sensitivity analysis performed on the built models, highlighting the impact of various input factors on the Class Activation Mapping (CAM) (a measure of model performance). The horizontal axis contains factors such as device type, experience, device help, accuracy, interface complexity, keypad confusion, etc., and the vertical axis contains the effect on CAM measured, the height, and color intensity representing the level of influence. The most significant ones are those corresponding to the highest and darkest color bars for both the first-order effect (S1) and the total effect (ST). From the analysis, mouse distance, clicks per minute, and interface complexity were identified as the top three factors with the largest contribution to model performance. Mouse distance strongly influences model accuracy as it reflects the intensity and nature of user interaction. Clicks per minute represent engagement frequency, indicating user activity level, while interface complexity captures the cognitive demand imposed by the interface. These three features collectively account for most of the variance in model output, confirming their dominant role in shaping user interaction patterns. Knowledge of these top drivers is informative for improving model robustness, indicating that a focus on user experience, session control, and device support can significantly enhance prediction accuracy and overall model quality. Tuning in these areas can potentially lead to notable advancement, making the system more robust across different user groups and scenarios. These findings are therefore instrumental to making informed model improvements and simplifying the placement process.
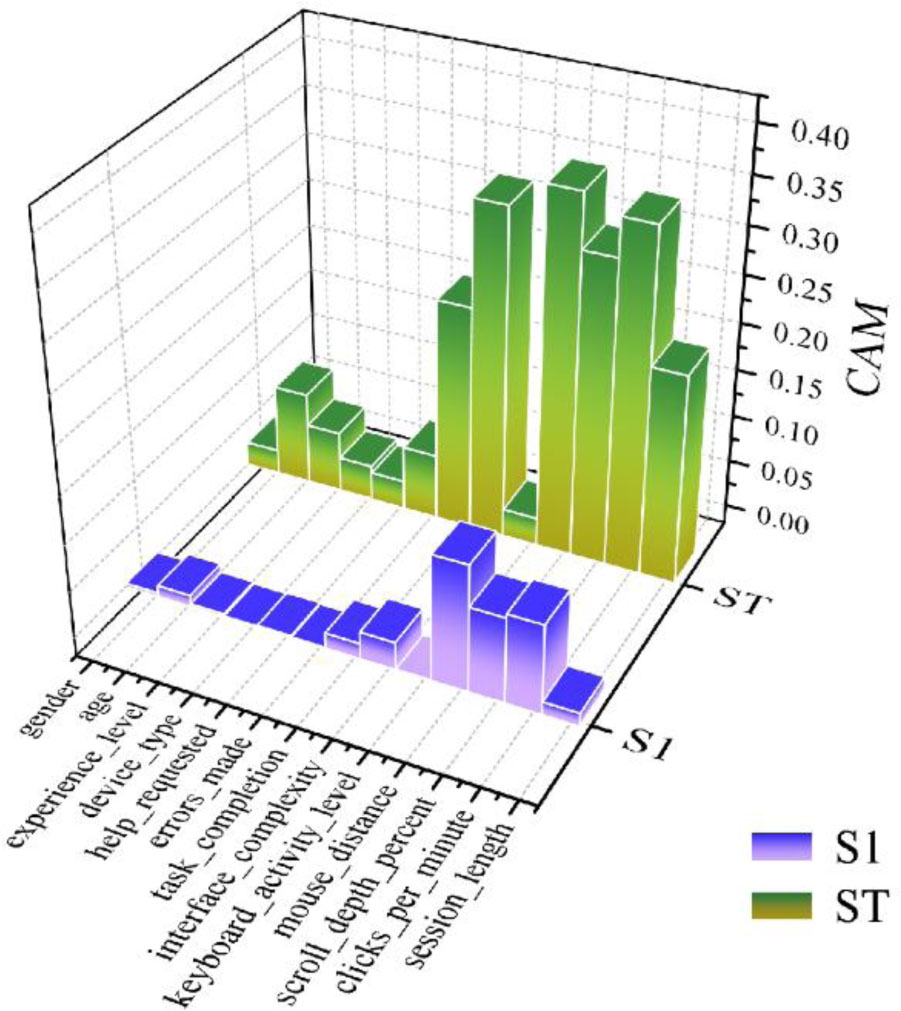
Fig. 4.
Sensitivity analysis of input variables using the CAM, showing that mouse distance, clicks per minute, and interface complexity are the three most influential factors affecting model performance.
5. Discussion
Predicting user interaction within HCI through the use of ML regression models has emerged as a viable means of introducing greater efficiency, flexibility, and intelligence into interactive systems. As user becomes increasingly complex and dynamic, the potential of a predictive and responsive approach to interaction patterns can be a strong implement for optimizing the user experience. The purpose of this study is to identify the factors with the greatest impact on the performance of the predictive model, and, consequently, to enable a more efficient and responsive system design. The practical implementation, actual use, dependability, restrictions, next steps in research, and the general importance of these findings are discussed below. The application of user behavior forecasting in HCI through ML regression models still has the potential to make systems more responsive, adaptive, and personalized. Understanding interaction patterns, systems can be designed to anticipate user requirements, reduce response time, and enrich the user experience. This predictive modeling enables the automatic adjustment of real-time interfaces, opening the way to a more effective and intuitive digital environment. The results of these models can be used across fields such as education, healthcare, virtual reality, and e-commerce, where user satisfaction and engagement are top priorities. Adaptive features using predictive intelligence allow the interfaces to be in an identical evolutionary process with users' tastes, which, in turn, means less cognitive overload and greater usability. Such advantages are particularly relevant in areas where continuous user interaction is required and real-time adaptation can not only improve task performance but also boost user satisfaction. Practical application of the approach in everyday situations is indicative of the increasing dependence on smart systems that have the ability to understand and even predict user behavior. The same goes for intelligent tutoring systems, where anticipation of user interaction allows for individualized learning paths tailored to each learner's pace and style. In a manner similar to health technologies, predictive modeling can be employed to monitor patient engagement through supportive interfaces. Hence, interventions can be brought in at their most effective times. User-facing platforms that utilize commercial recommender systems further enhance predictions by taking into account patterns of customer engagement, resulting in more relevant content and higher user retention. Besides, smart spaces can harvest the benefits of such predictive capability to the extent that they can enable more efficient energy use, enhanced security, and automated services by anticipating user activity.
From a reliability standpoint, the models designed to forecast HCI user behavior give a positive indication of their consistency when they face different situations. Their power is further strengthened when they are trained on heterogeneous datasets that are very diverse and contain different user activities and contexts. Although user interaction data is somewhat unpredictable, methods such as preprocessing, feature selection, and validation steps have been implemented to achieve accurate predictions that are transferable to other use scenarios. Still, the accuracy of such prediction models depends on the quality and representativeness of the input data. If the data do not include the whole range of user behavior, the ability to make predictions may weaken when new interaction patterns are introduced. The main problem with this issue is that human behavior is a dynamic, complex phenomenon that is neither easily measurable nor predictable. Changes in user desires, feelings, and environmental conditions that affect the interaction make the situation non-linear and, therefore, may challenge even the most advanced modeling techniques. Besides, the interpretability of ML models is an issue because the decision-making process in these systems is not always understandable. This opacity may hinder the interpretability of prediction generation, particularly in high-stakes domains where explainability is essential. Secondly, reliance on historical interaction records may introduce biases that affect the fairness and inclusiveness of predictive outcomes.
Future research must continue to develop predictive systems' contextual awareness by incorporating multi-modal streams of data, such as voice, gesture, and physiological signals. Merging this kind of information can provide a more complete understanding of user intent and state, improving the accuracy and versatility of the models. Additionally, research can focus on developing hybrid models that combine prediction and feedback-based learning, enabling systems to adapt to user feedback and changing interests. Ethical considerations relating to data privacy, consent, and user agency will also most likely occupy the center stage of future research, particularly as predictive systems become more embedded in daily life. The significance of this study is that it can identify the most important factors that contribute to the performance of predictive models in HCI applications. By identifying high-influence factors, the study contributes to the development of more refined model architectures. The predictive accuracy is also enhanced. This diagnostic approach represents a methodological advancement that enables more effective model development and deployment. Additionally, the results from this investigation can be used to inform the design of interaction systems in the future, making them more sensitive to user needs and more precise in their predictive capabilities.
6. Conclusion
The HCI seeks to design and evaluate user interfaces that enable unimpeded communication between computer systems and humans. HCI involves the study of user behavior, interaction strategies, and system responsiveness, with a focus on developing interactive interfaces to improve user experience. HCI is a cross-disciplinary field that draws on computer science, cognitive psychology, and design in an effort to achieve maximally usable and effective interfaces. Understanding user behavior, such as cursor movement, click path, and navigational difficulty, is essential to predicting future behavior and customizing digital environments, especially as systems become smarter and data-centric.
In this work, ML classification models, RFC, and DTC, were used to predict user interactions in HCI systems. To enhance performance, two nature-inspired optimizers, i.e., FO and NGO, were integrated into the models. The core objective was to improve predictive accuracy and robustness in classification through optimization. These hybrid approaches performed better, indicating the effectiveness of optimization methods in addressing non-linear user behavior patterns and multi-dimensional interaction characteristics.
The most important goal, however, was to determine which input features most effectively affect model performance. For this purpose, a sensitivity analysis was conducted using CAM, supported by the S1 and ST indexes. The results showed that interface complexity, mouse distance, and clicks per minute were the most effective features for predicting correctness, with importance values of over 0.30. These were referred to as central drivers of interaction dynamics and enabled an improved understanding of user behavior modeling. Effective though it is, sensitivity analysis employing CAM has its drawbacks. The CAM method is sensitive to the structure of the model and the data distribution, which can limit its applicability across diverse datasets. It also focuses more on spatial meaning than on temporal dynamics, which can deteriorate its performance in dynamic interaction situations. CAM can also neglect subtle inter-feature dependencies, leading to simplistic interpretations.
It is acknowledged that while the CAM method provides significant insights into feature importance, it has inherent limitations. Specifically, CAM is sensitive to the underlying structure of the predictive model and the distribution of the input data, which may affect the generalizability of the sensitivity scores. Furthermore, this approach primarily focuses on spatial features and may overlook the complex temporal dynamics inherent in user interactions. Additionally, while CAM excels at identifying high-impact individual variables, it might not fully capture subtle inter-feature relationships or complex non-linear dependencies between inputs. Future work will focus on integrating temporal analysis with methods for detecting higher-order feature interactions to address these limitations.
Acknowledgement
We would like to take this opportunity to acknowledge that there are no individuals or organizations that require acknowledgment for their contributions to this work.
Notes
[3] Funding
This research received no specific grant from any funding agency in the public, commercial, or not-for-profit sectors.
[4] Contributed by Authors' Contributions
LL performed Data collection. HS carried out data modeling and analysis. YW evaluated the first draft of the manuscript, editing, and writing.
[5] Ethical Approval
The research paper has received ethical approval from the institutional review board, ensuring the protection of participants' rights and compliance with the relevant ethical guidelines.
[6] Declaration of Generative AI Use
During the preparation of this manuscript, the authors used ChatGPT (OpenAI) for language editing and improving the readability of the text. The authors carefully reviewed, revised, and verified all content generated by the tool and take full responsibility for the accuracy and integrity of the