

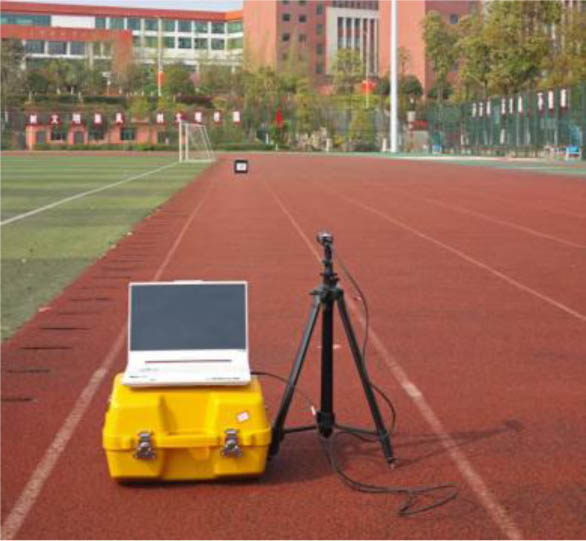
Fig. 1.
Test sets.
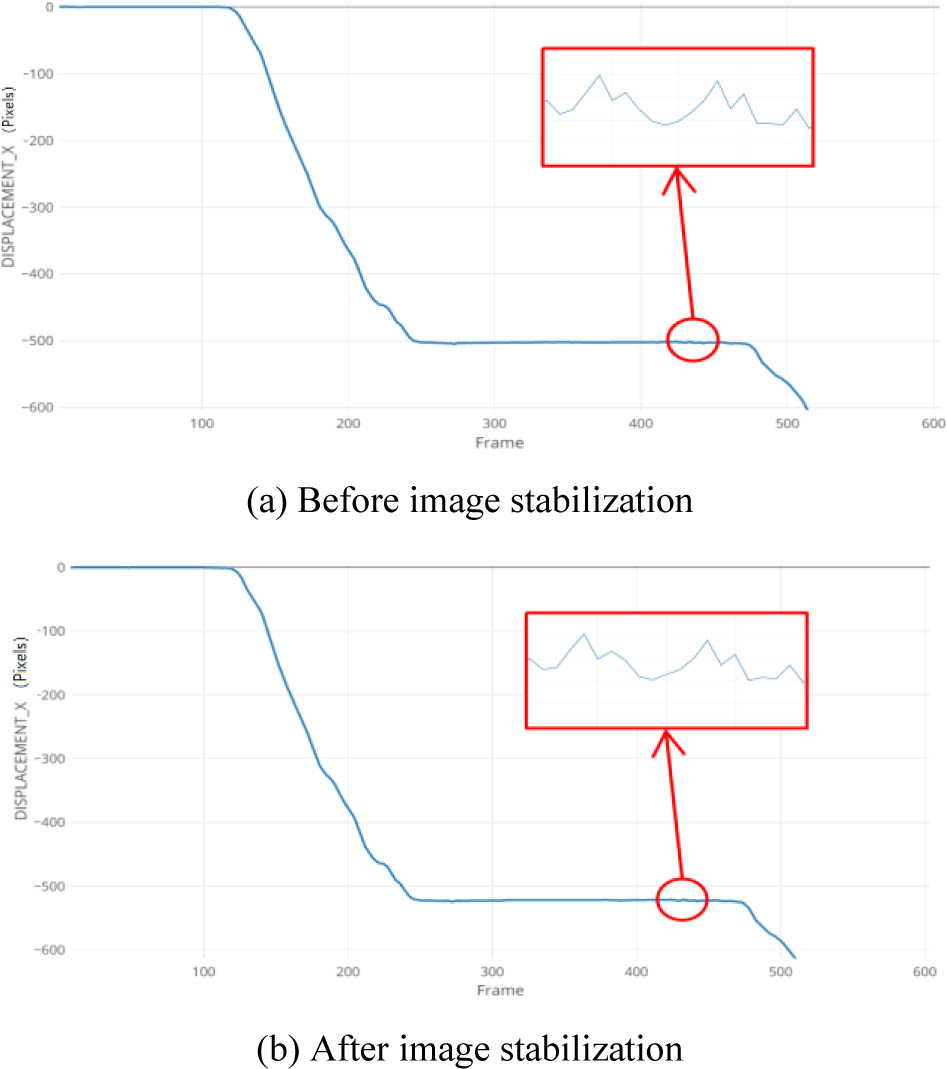
Fig. 2.
Comparison of the displacement curve between before and after image stabilization at 30 m.
Table 1.
Calculation parameters of tests at 30 m.
| Counts | L [mm] | L1 [mm] | L2 [mm] |
|---|---|---|---|
| 1 | 295 | 283.60 | 294.99 |
| 2 | 205 | 190.85 | 198.48 |
| 3 | 102 | 91.82 | 94.53 |
| 4 | 49 | 48.21 | 51.08 |
| 5 | 34 | 30.67 | 31.90 |
| 6 | 10 | 10.00 | 10.40 |
| 7 | 5 | 5.20 | 5.42 |
| 8 | 3 | 2.96 | 3.08 |
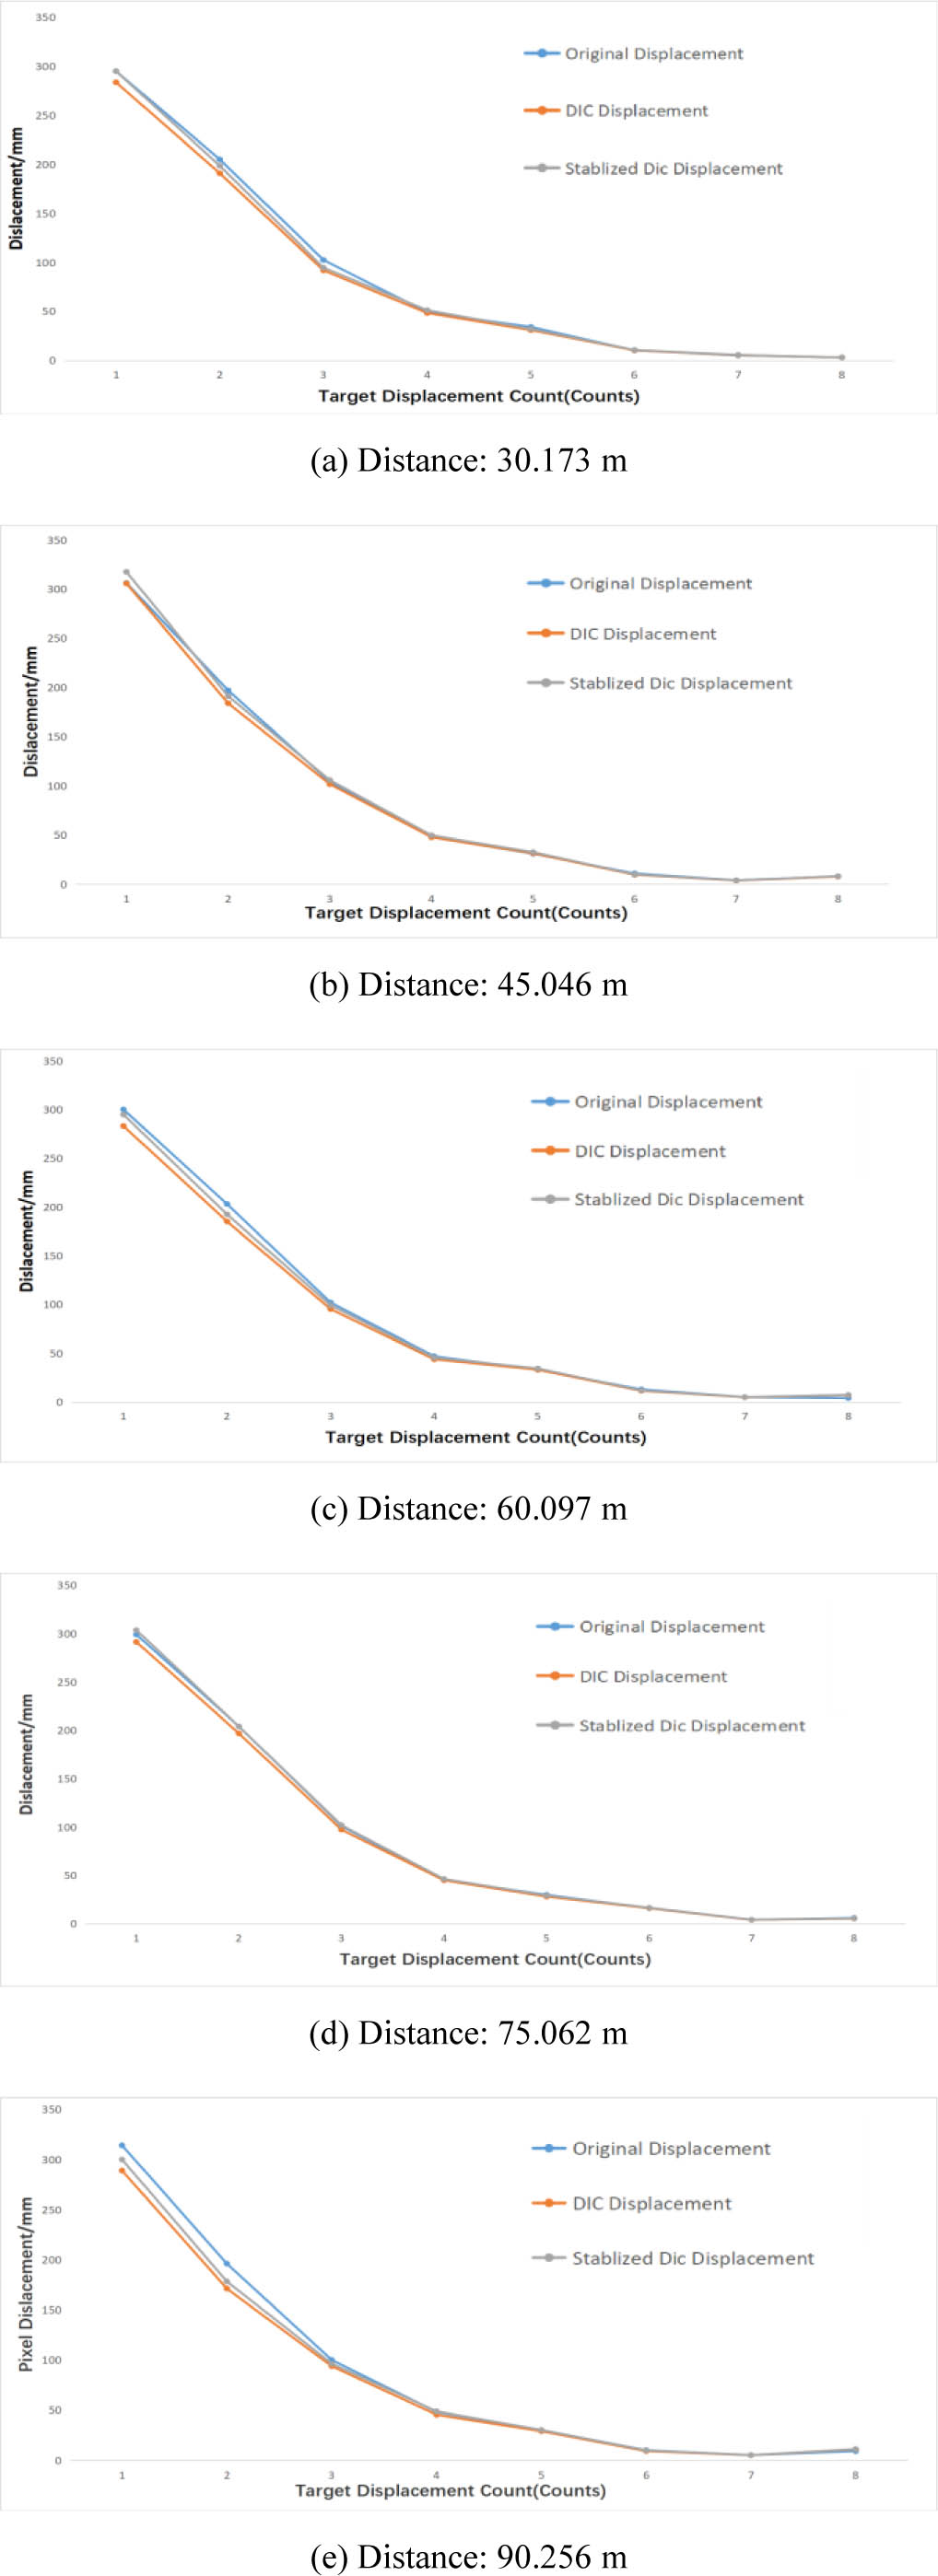
Fig. 3.
Displacement curves of each segment under varying distances.
Table 2.
Average relative errors at different distances.
| Distance [m] | ω1 [%] | ω2 [%] | φ [%] |
|---|---|---|---|
| 30.173 | 4.7 | 4.5 | 4.2 |
| 45.046 | 4.1 | 3.8 | 7.3 |
| 60.097 | 7.5 | 6.0 | 20.0 |
| 75.062 | 3.8 | 3.2 | 14.9 |
| 90.256 | 8.6 | 5.6 | 34.1 |
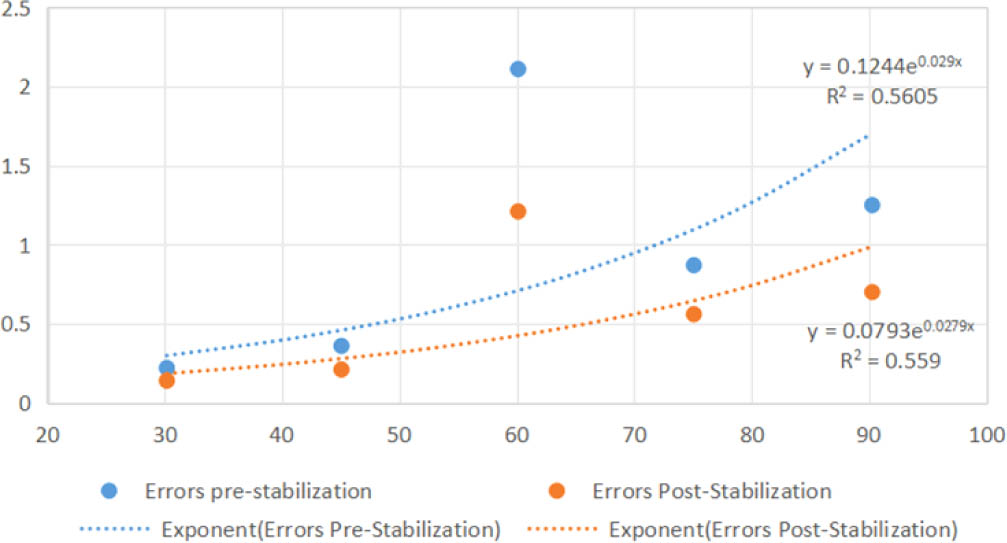
Fig. 4.
Exponential regression of mean relative error against test distance for raw DIC and stabilized DIC measurements.