
Frequency is one of the most accurate and stable physical quantities, widely utilized in critical domains such as aerospace, satellite navigation, and electronic systems to transmit essential information [1]–[2]. In recent years, there has been a growing trend in test and measurement technology to convert physical parameters such as temperature and voltage into frequency signals for high-precision analysis. With continuous advancements in the performance of frequency sources, including high-stability crystal oscillators, rubidium atomic clocks, hydrogen masers, and optical clocks, increasingly stringent requirements have been imposed on frequency measurement capabilities.
Frequency measurement methods can be broadly classified into two categories: direct frequency measurement and indirect frequency measurement based on phase comparison [3]–[4]. Direct frequency measurement provides a wide measurement range and is widely applicable across various frequencies. In contrast, phase varies more gradually than frequency, allowing phase-based indirect methods to achieve higher resolution. However, these indirect approaches typically require normalization procedures and are primarily effective at specific frequency points, resulting in a relatively limited measurement range. Currently, common direct measurement techniques include the direct counting method, phase-locked wideband frequency measurement method, and frequency difference multiplication method. Indirect methods that rely on phase comparison encompass the phase comparison method, beat frequency difference method, and dual-mixing time-difference method [5]–[6].
The direct frequency measurement method inherently incurs a ±1-count counting error in either the measured or the reference frequency signal, resulting in relatively low measurement resolution. The frequency difference multiplication method mitigates the impact of the ±1 counting error on measurement outcomes. However, it is applicable only to signals of similar frequencies and requires multiple frequency multipliers and mixers. This leads to increased circuit complexity and introduces additional device noise.
The conventional phase comparison method is restricted to measurements involving signals of identical frequencies and exhibits a measurement “dead zone” in the vicinity of the phase coincidence point [7]–[8]. In the time-frequency domain, standard frequency reference signals such as 10 MHz, 10.23 MHz, and 100 MHz are commonly utilized. Similarly, in the field of communications, frequencies such as 12.8 MHz and 16.384 MHz are frequently adopted. Consequently, it is necessary to employ a mixer to normalize the input frequencies, a process that inherently introduces additional device noise.
The phase detection broadband frequency measurement technology employs the phase coincidence point detection method to extend signal comparison from identical frequencies to arbitrary frequency relationships. However, in practical implementation, accurately identifying the phase coincidence point poses challenges, while analog approaches are often hindered by circuit complexity and significant device noise [9]–[10]. In certain specific frequency scenarios, auxiliary components such as frequency synthesizers or intermediate sources are required to support measurements.
Therefore, based on an analysis of the phase difference variation characteristics across signals of arbitrary frequencies, an accurate frequency detection technique is proposed. This method integrates the frequency relationship among arbitrary signals with the quantization phase accumulation effect, leveraging FPGA on-chip technology. It not only addresses the limitations inherent in conventional phase-based wideband frequency measurement approaches but also simplifies circuit architecture, reduces system cost, and enhances overall stability.
A large amount of experimental evidence shows that phase coincidences between two signals of different frequencies repeatedly occur at intervals corresponding to the group period, consistent with the principle of group period synchronization [11]–[12]. This phenomenon can be precisely frequency-measured by the variational method [13]–[15]. Assume two stable signals, fA and fB, whose periods are TA and TB, respectively. The two signals’ relationship is as follows:
In (3), A and B (A > B) are integers greater than zero, respectively. Tmin c is known as the least common multiple period, and Tmax c is called the most significant common factor period, as illustrated in Fig. 1.
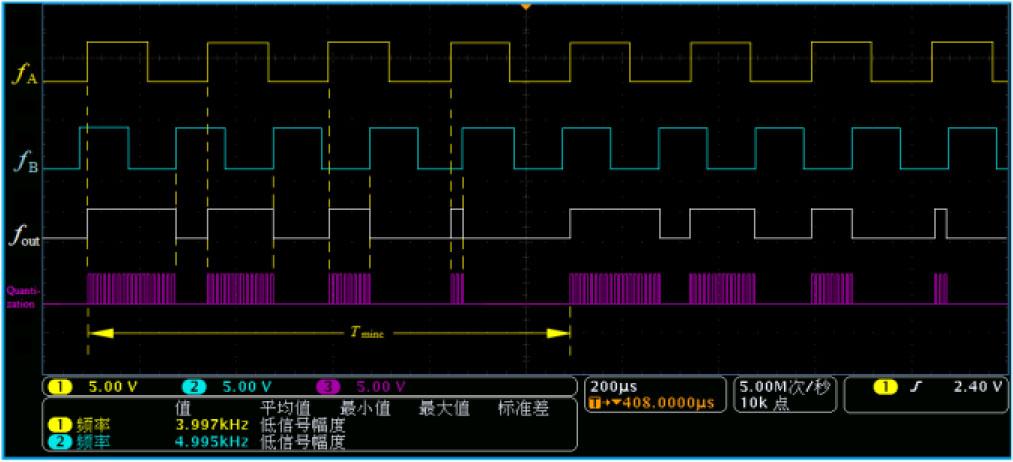
Quantization phase accumulation effect.
The conventional phase comparison approach cannot use the period of a specific frequency signal as a reference time for phase processing or for direct phase comparison between signals of differing frequencies. This inherent limitation necessitates frequency normalization in traditional phase measurement methods, thereby restricting their application to scenarios involving identical frequencies. Specifically, within the least common multiple period of the two signals, signal fA is designated as the measured signal and fB as the reference signal. For each rising edge of fB, the temporal difference between this edge and the nearest rising edge of fA is defined as the direct time interval between the two signals. Subsequently, the phase comparison results fout are quantized using a high-frequency clock.
As we can see, in a Tmin c,
When fA and fB are kept as integer multiples, the phase differences in a Tmin c are given by (5).
From (5), ΔP1, ΔP2, ... , and ΔPB are some phase differences in Tmin c, and n1, n2, n3, ⋯ , A are the TA numbers fA for fB front edge pulses. When the signals fA and fB do not keep integer multiples, let Db = TB − Δt, Δt is the phase drift caused by the frequency deviation Δf between the signals fA and fB. The phase differences in a Tmin c are described as follows. The phase differences within the first Tmin c are
The differences of phases within the second Tmin c are
The differences of phases within the third Tmin c are
The differences of phases within the (n-1)th Tmin c are
The differences of phases within the nth Tmin c are
Equations (6) to (10) show that the change of phase difference shows an obvious law in the phase comparison at different frequencies. Specifically, for adjacent Tmin c values, the phase difference corresponds to BΔt and is expressed as ΔPnB − ΔP(n−1)B = BΔ t. At the same position, the phase difference from the first to the nth Tmin c is also equal to this value. When nBΔt = TB, the time of the phase coincidence shows periodic changes. The time intervals between these periodic changes are defined as the group period Tgp, denoted as
Consequently, the Tgp can be determined by observing the time interval between the periodic changes of fout, and Δt can be calculated by nBΔt = TB.
Thus, the signal Db can be calculated using the formula Db = TB + Δt.
From (12), it can be observed that the actual measurement error is considerable. A ±1-word count error at a count of fout leads to the measured value becoming an integer multiple of Tgp. Although the period Tgp is small, such an error remains unacceptable in precision-critical applications. Based on the analysis of Tmin c and Tgp, the variation pattern of the phase difference was determined. A group period is established when two identical phase differences occur simultaneously. Within each group period, TA and Db are computed to derive N1 and N2, respectively, yielding (14). The left-hand and right-hand sides of (14) represent integer multiples of the group period, thereby indicating periodic consistency in the measurement framework.
According to the variation law of the group period, precise frequency links are established between signals of different frequencies, and the period of the measured signal is determined using the reference signal. Due to the inherent regularity between the two signals, the coincidence points of the same phase will recur. If the fout signal between fA and fB is processed, and then the phase quantization result of the phase coincidence point is detected by a high-frequency clock, the phase coincidence information can be easily obtained. Simultaneously counting fA and fB and the phase coincidence point, generating a gate using the phase coincidence point, and then counting fA and fB within the same gate time can overcome measurement errors caused by counting errors.
If the count of the phase coincidence point has a ±1-word counting error, with a 50 % probability, the closing signal will inevitably appear at an integer multiple of the group period. Therefore, multiplying both sides of (14) by an integer coefficient k can mitigate the impact of the counting error.
Therefore, in frequency measurement, although a ±1-count counting error at the phase coincidence point does not affect the measurement accuracy, it may extend the gate time and consequently reduce the measurement speed.
According to the principle of frequency detection based on phase coincidence points, the key to improving frequency detection accuracy lies in accurately identifying and measuring these phase coincidence points. The phase of the shaped signals fA and fB is compared, yielding fout phase coincidence points. Then extract the front and back edges of these phase coincidence points and perform high-frequency clock counting between these edges. The same counting result serves as the trigger signal for opening and closing, and is then transmitted to the MCU (microcontroller unit) for data processing and execution. The frequency detection scheme for this system is shown in Fig. 2.
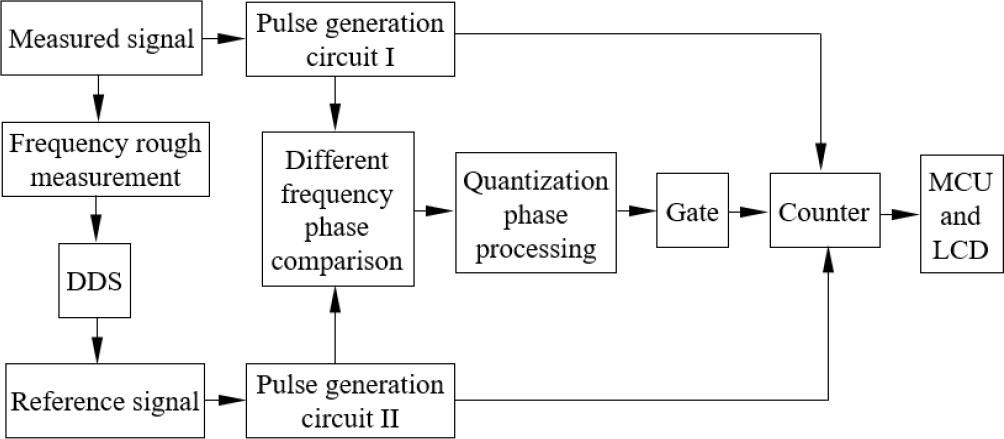
Frequency detection design scheme based on quantization phase accumulation effect.
The E8663D signal generator is used to produce test signals, specifically sine waves with an amplitude of 3.3 V. The reference signal is provided by the OSA 8607B high-stability crystal oscillator. Both the measurement and reference signals are connected to the FPGA via its global clock pin. In this experiment, 100 MHz signals are generated through the phase-locked loop (PLL) inside the FPGA. The 100 MHz signal serves as the delay mechanism for the reference and measured signals, generating a narrow pulse signal. Initially, these narrow pulses were transmitted to phase comparison modules at different frequencies to create a set of periodic compositions. Subsequently, the high-frequency clock generated by the internal phase-locked loop of the FPGA is used to quantify and count the output fout. Select the time of the phase overlap point as the starting signal of the counter to begin counting the pulses of signals fA and fB. The coincidence point of the same phase serves as the stop signal for the counter, and pulse counting of the reference and measurement signals is completed within the gate time. Finally, the pulse counts from the reference and measurement signals are transmitted to the data processing module through the serial port instantiated by the FPGA. The data processing module uses (14) to calculate the frequency measurement result of the measured signal.
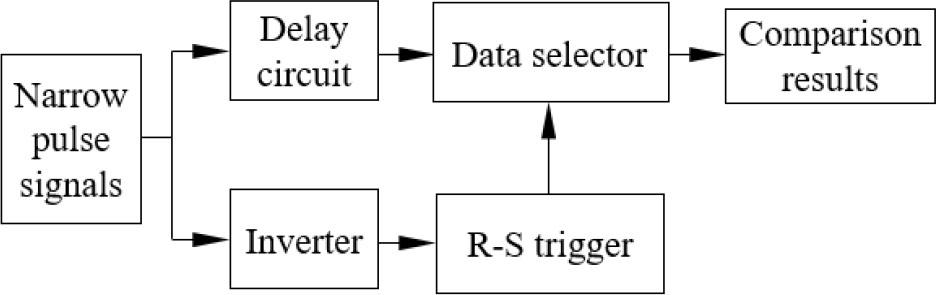
Because the FPGA can directly identify the chip inside the sine wave and transform it into a square wave pulse signal, the two-phase comparison signals can be directly transmitted to the FPGA clock pin, without the need for a signal shaping circuit, as shown in Fig. 3.
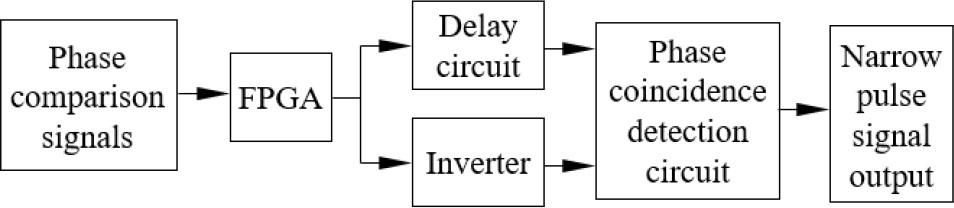
Narrow pulse generation circuit.
In Fig. 3, the delay circuit is composed of D flip-flops within the FPGA. By adjusting the clock period of the D flip-flop, the pulse width becomes better suited to the required delay. In addition to introducing inherent delay, this circuit also reduces noise in the comparison signal. The square wave pulse signal is sent to an inverter, which generates a signal with a phase opposite to the original square wave pulse. These inverse and delayed square wave pulse signals are then transmitted to a phase coincidence detection circuit composed of “AND” logic gates, resulting in narrow pulse signals at the same frequency as the square wave pulses. Converting the comparison signals into narrow pulses of the same frequency facilitates the formation of phase coincidence points, synchronizes the phase coincidence fuzzy region with the group period interval, and enhances the stability of the gate, thereby improving the accuracy of frequency detection, as shown in Fig. 4.
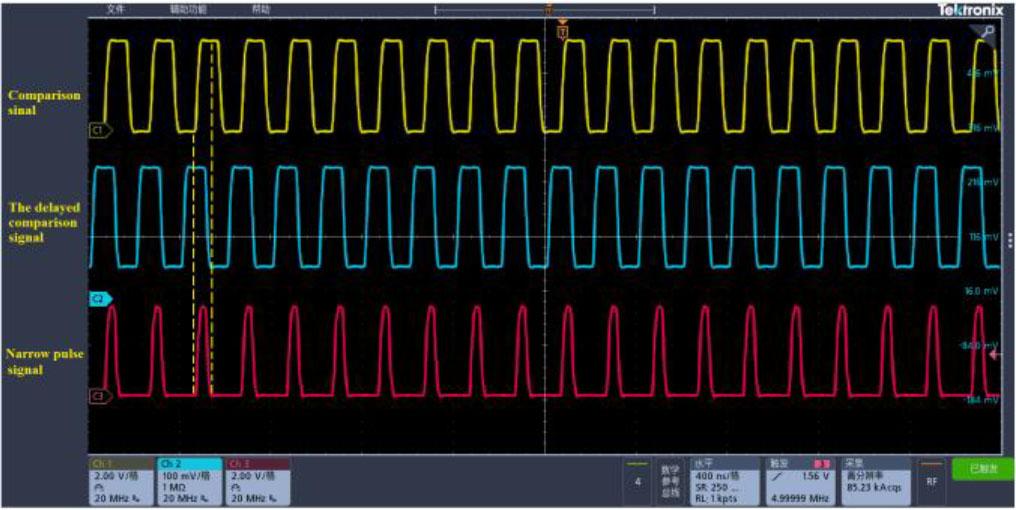
Narrow pulse signal generation results.
Fig. 5 shows the different frequency phase comparison scheme.
Phase synchronization signal generation scheme.
After the pulse signal is generated, the measured signal and the reference signal are simultaneously converted into narrow pulses of the same frequency. This conversion promotes phase difference processing by reducing the uncertainty associated with the prolonged rise time of the sine wave signal, thereby enhancing the stability of phase comparison. By inputting narrow pulses with the same frequency as the reference signal and the signal to be measured into phase comparison processing modules designed for different frequencies, the phase comparison results can be obtained. The process of generating these phase comparison results is as follows: The reference signal fA and the measurement signal fB are respectively sent to the R and S terminals of the R-S flip-flop. When fB and fA exhibit different levels, especially when fB = 0, fA = 1 or fB = 1, fA = 0, the R-S flip-flop outputs a high-level “1” signal. If both fB and fA are at a low level of “0”, the output remains in the hold state. Conversely, when both signals are at a high level of “1”, it indicates that the phase difference between the reference and measured pulse signals is zero, or completely coincident. At this point, the R-S flip-flop outputs a low level of “0” signal. As shown in Fig. 6, the theoretical analysis is in good agreement with the experimental results. In Fig. 6, fA is the measured signal, fB is the reference signal, and fout is the comparison of the phases at different frequencies.
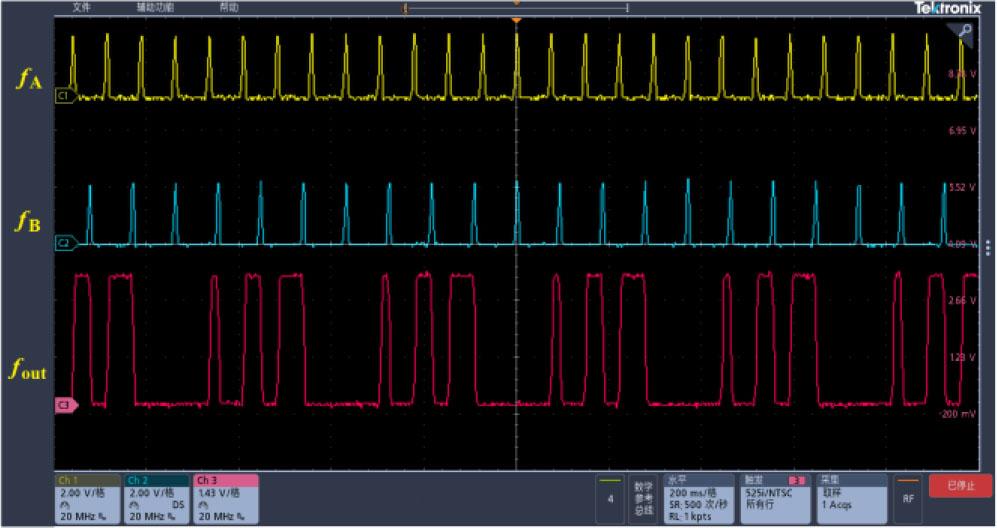
Phase synchronization signal generation results.
After the fout frequency is extracted in Fig. 6, the phase comparison results are quantified using the high-frequency clock in the FPGA chip. This process makes the processing of fout frequency and the selection of gate signals more convenient, as shown in Fig. 7.
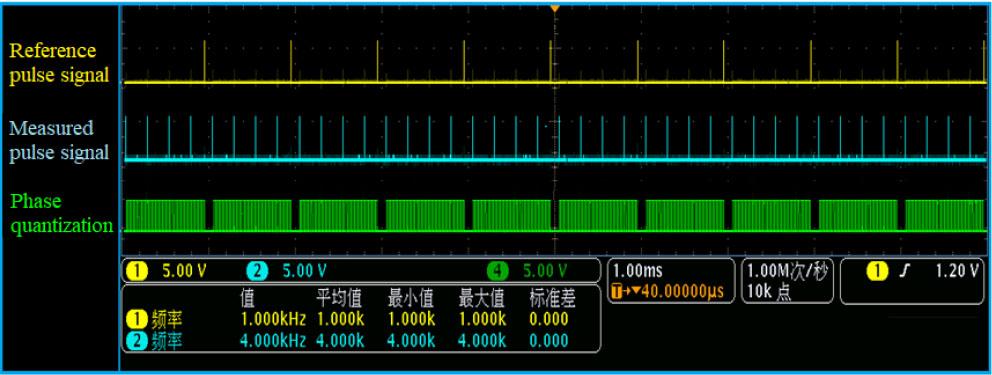
Phase quantization processing results.
As illustrated in Fig. 7, each phase coincidence point is quantified during the phase comparison process. The phase-locked loop integrated into the FPGA generates a high-frequency quantization clock, used to count the quantized phase coincidence points. A counting gate is established when two consecutive counting results coincide. Quantifying phase coincidence points facilitates the processing of phase coincidence fuzzy bands. By calculating the width of the coincidence region, the peak value within the blurred area can be accurately identified. The temporal occurrence of this peak is then employed as the switching instant for the counting gate, thereby enabling seamless counting. Consequently, variations in the gapless counter value reflect the uncertainty inherent in frequency measurement.
A high-precision frequency detection system based on the quantized phase cumulative effect has been developed. The system operates over a measurement range of 1 to 20 MHz, achieving a frequency detection accuracy of 10−13 at 1 s. To validate measurement accuracy, a 5071A cesium atomic clock, which provides a 10 MHz external reference signal, was used as the reference standard. The test signals were generated by the E8663D RF signal generator, which exhibits a frequency stability of 2 × 10⁻¹¹ at 1 s. System operation is straightforward: first, the RF output of the signal generator is connected to the input port of the frequency detection system. Subsequently, the signal generator is configured to produce test frequencies such as 16.384 MHz and 10.354 MHz, which are then delivered to the system input. Upon pressing the “Measure” button, the system displays the measured frequency, frequency stability, and frequency deviation on the LCD screen. The experimental results of the frequency measurements are summarized in Table 1.
Frequency measurement experiment results.
| The measured frequency [MHz] | Measurement results [Hz] | Frequency differences [Hz] | Frequency uncertainty [at 1 s] |
|---|---|---|---|
| 2.397 | 2396999.751 | 0.316 | 4.17 × 10⁻¹³ |
| 10.354 | 10353999.173 | 0.836 | 2.12 × 10⁻¹³ |
| 11.260 | 11259997.522 | 0.461 | 3.24 × 10⁻¹³ |
| 11.713 | 11712997.238 | 0.623 | 4.25 × 10⁻¹³ |
| 12.071 | 12070997.334 | 0.772 | 3.27 × 10⁻¹³ |
| 12.880 | 12879996.872 | 0.128 | 2.32 × 10⁻¹³ |
| 12.125 | 12124996.773 | 0.232 | 2.81 × 10⁻¹³ |
| 13.160 | 13159996.576 | 0.459 | 4.31 × 10⁻¹³ |
| 15.312 | 15311996.243 | 0.756 | 2.23 × 10⁻¹³ |
| 15.694 | 15693996.236 | 0.714 | 2.17 × 10⁻¹³ |
| 16.384 | 16383999.722 | 0.230 | 2.38 × 10⁻¹³ |
| 18.023 | 18022996.334 | 0.778 | 5.03 × 10⁻¹³ |
The frequency measurement uncertainty of the system, as indicated in Table 1, reaches 10−13 at 1 s. Since the two comparison signals originate from different frequency sources, their phase noise cumulatively affects the system's measurement error, leading to jitter in the phase comparison results. Within the gate time, the counting of the two comparison signals introduces errors, which are then processed by a microcontroller to reduce the system's frequency uncertainty. Although phase comparison results are not directly used for frequency detection, this approach suppresses measurement errors to some extent. In practical applications, increasing the FPGA system's clock frequency and optimizing the upper computer algorithm can reduce frequency uncertainty, thereby minimizing additional noise influence and achieving measurement results with frequency uncertainty better than 10−13 at 1 s or even higher. Additionally, the stability of the frequency relationship between the reference and measured signals is an important factor, as it directly affects the generation of the group period and phase quantization. It will cause the jitter of the measurement gate and reduce the accuracy of the frequency measurement.
Compared to traditional frequency measurement methods, the frequencies listed in Table 1 were measured using three different instruments: the HP5390A frequency stability analyzer using the traditional beat method, and the 5110A frequency stability analyzer using the double mixing time difference method. The experimental results indicate that the frequency measurement accuracy is less than 10−13 at 1 s, with a frequency deviation of less than 1 Hz. Additionally, the HP5335A universal counter has a frequency measurement resolution of 1 Hz, a time resolution of 1 ns in the counter, and a measurement range of 1–200 MHz. It is also an excellent instrument for frequency measurement at present [15]. The K+K FXE phase frequency counter, a comprehensive, commercial, universal frequency counter currently available on the market, achieves a frequency measurement accuracy of 4 × 10⁻¹³ at 1 s and has been widely adopted in time-frequency analysis. The precision index of the proposed method is comparable to that of the K+K FXE frequency counter. Therefore, compared to traditional frequency detection methods, which are characterized by complex structures, large sizes, high equipment costs, and relatively low comparison accuracy, the frequency measurement scheme presented in this paper offers a simpler structure, ease of integration, lower equipment costs, higher comparison accuracy, a wider application range, and broader prospects. This method primarily focuses on short-term stability or frequency measurement between precision frequency source signals, rather than long-term frequency stability of frequency sources as a primary metric within its application scope.
The accurate frequency detection technology based on the cumulative effect of quantization phase proposed in this paper does not depend on circuit optimization or advancements in microelectronic devices to improve measurement accuracy. Instead, it leverages the intrinsic correlations and variation patterns among frequency signals. These principles are applied to the interoperability processing of periodic signals, enabling accurate phase detection and effective handling of non-normalized frequencies. By utilizing phase measurements in accordance with the phase distribution characteristics across different frequency signals, the method implements a selection gate mechanism that effectively addresses challenges in identifying phase comparison outcomes and mitigating randomness. In addition, the system is highly sensitive to noise. During experimentation, the phase noise performance of the E8663D RF signal generator was significantly superior to that of the TSG4102A generator. Consequently, the frequency deviation measured using the E8663D as the signal source was substantially lower than that obtained with the TSG4102A, resulting in a considerable improvement in overall measurement accuracy. Experimental results demonstrate that the proposed approach achieves a frequency detection accuracy on the order of 10−13 at 1 s. Compared with conventional frequency measurement techniques — such as time cursor, phase comparison, and analog interpolation methods [16]–[19] — the proposed technology offers superior measurement accuracy, a simplified system architecture, reduced development costs, and enhanced system stability. With ongoing advances in modern electronics and improvements in FPGA integration, the performance of this frequency measurement system is expected to further improve, thereby expanding its potential applications in the field of high-precision time and frequency metrology.