
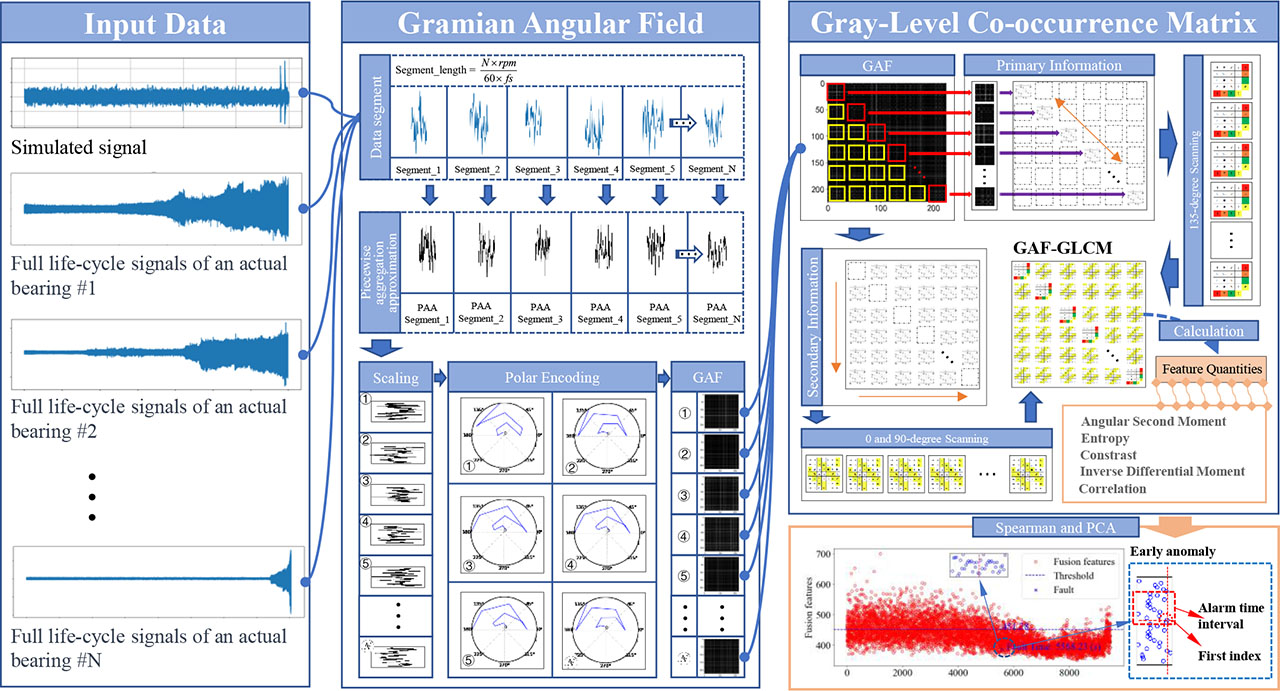
Fig. 1.
The diagram of the proposed GGLCM method.
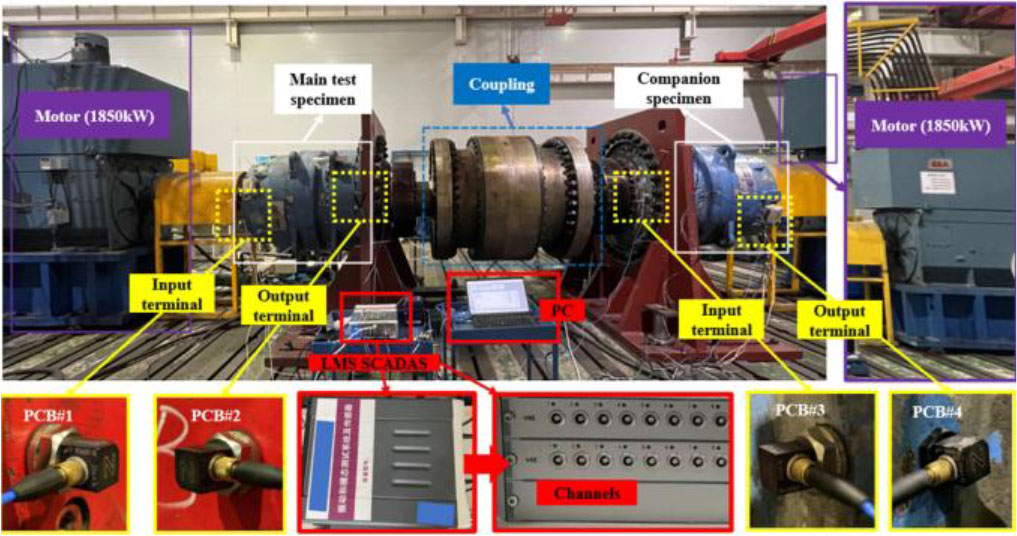
Fig. 2.
NGC overloaded gearbox fatigue life test bench.
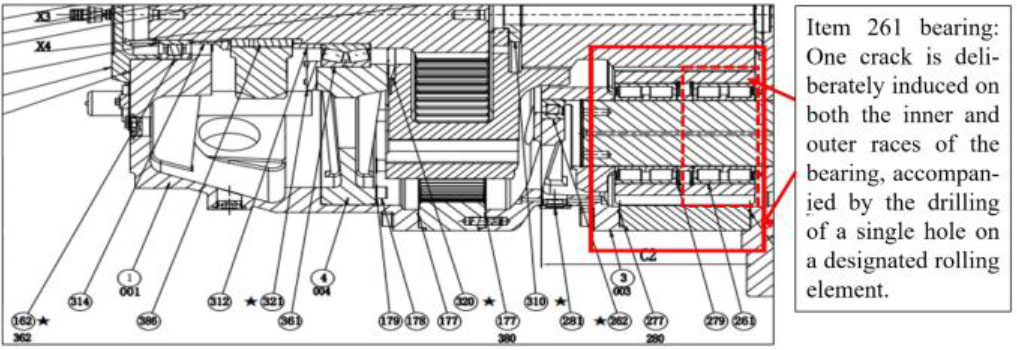
Fig. 3.
Schematic diagram of fault implantation.
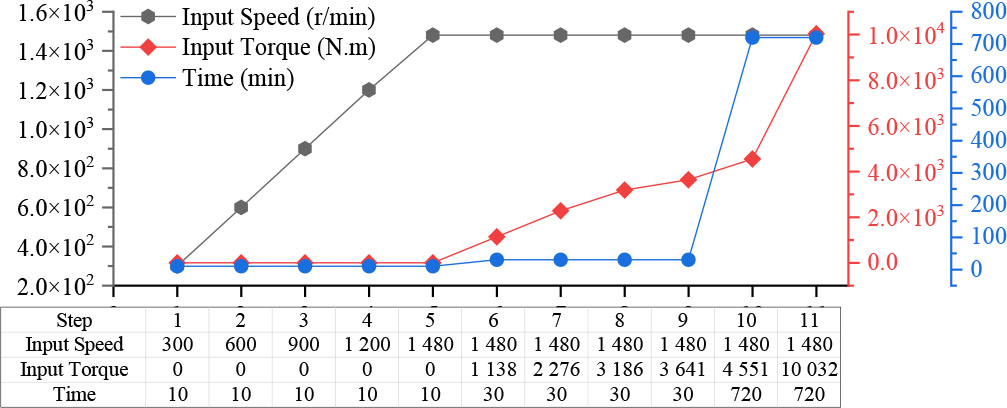
Fig. 4.
Fatigue life test procedure of a steel press gearbox.
Table 1.
The parameters of the test gearbox.
| Parameters | Parameter values |
|---|---|
| Type | MPGH2H900K63H |
| Rotation speed ratio | 62.402 |
| Rated power [kW] | 710 |
| Input rotation speed [rpm] | 1 490 |
| Maximum input torque [N·m] | 10 032 |
| Maximum output torque [kN·m] | 626 |
| Lubricating oil type | ISO VG 320 |
| Oil flow rate of lubrication station [l/min] | 125 |
| Oil mass [l] | 230 |
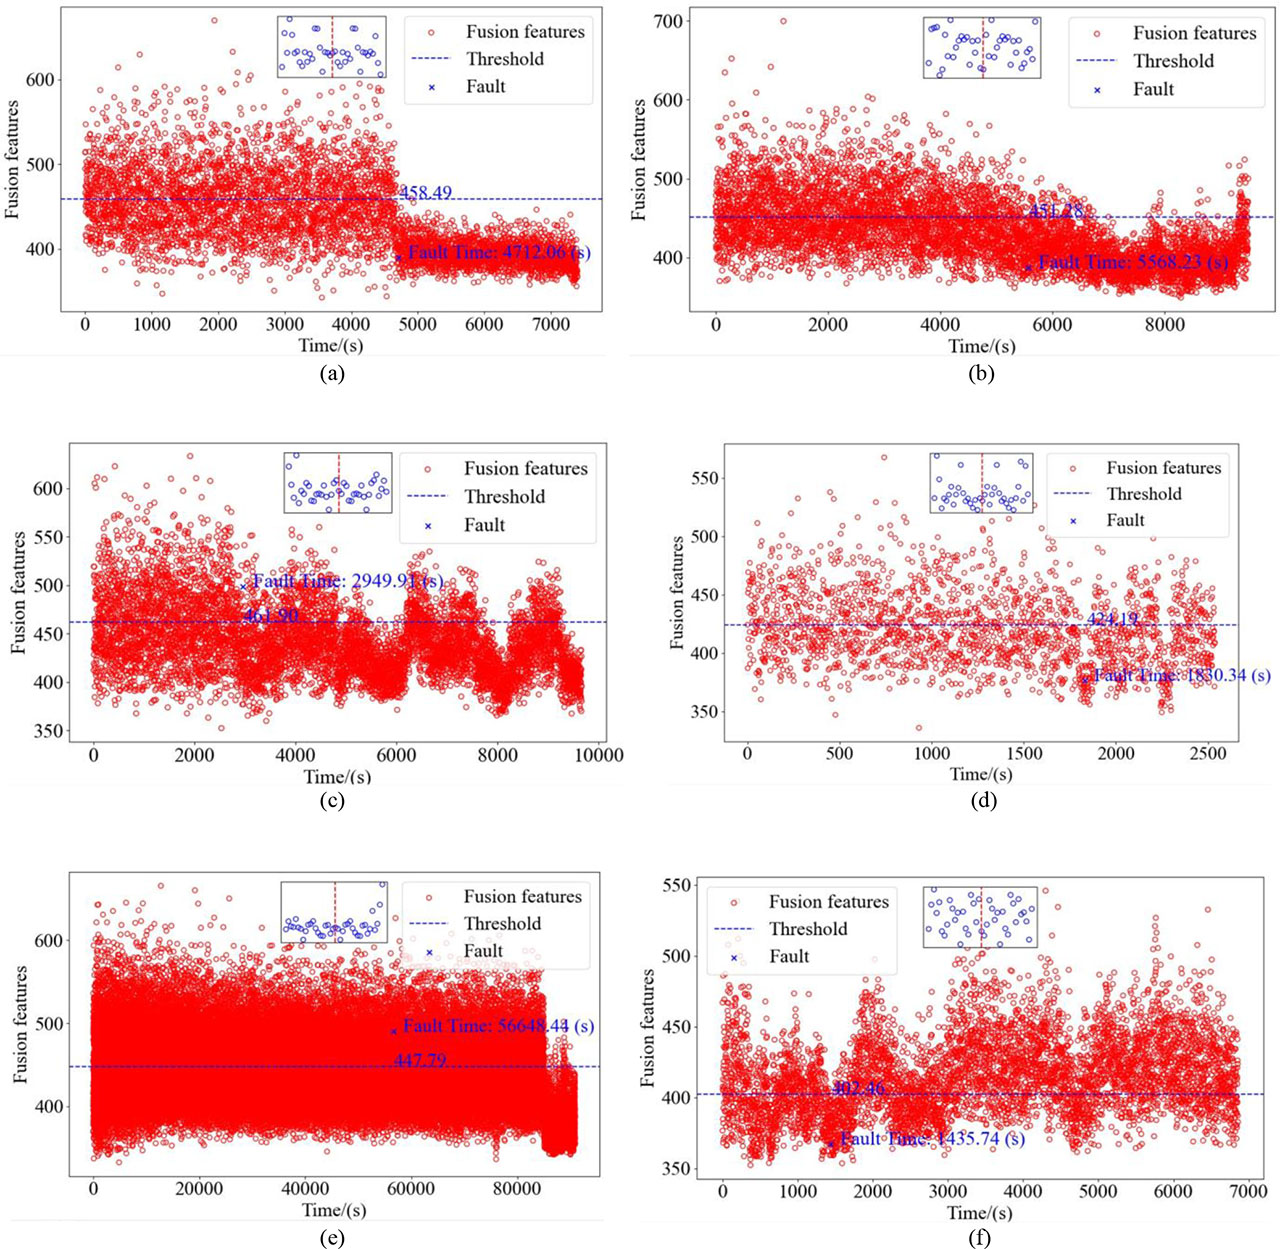
Fig. 5.
The temporal evolution of variable (the results of early anomaly detection on XJTU-SY). (a) Bearing1_1, (b) Bearing1_3, (c) Bearing2_2, (d) Bearing2_4, (e) Bearing3_1, (f) Bearing3_4.
Table 2.
The detailed results for XJTU-SY datasets.
| Subject | Input ratio [%] | YFactual [s] | YFest [s] | Acc* [%] | ||||||
|---|---|---|---|---|---|---|---|---|---|---|
| +10 % | +20 % | +30 % | +0 % | +10 % | +20 % | +30 % | ||||
| Bearing1_1 | 70 | 4 393.95 | 4 712.06 | 4 712.06 | 4 712.06 | 4 712.06 | 95.69 | 95.69 | 95.69 | 95.69 |
| Bearing1_3 | 70 | 5 578.64 | 5 568.23 | 5 568.23 | 5 568.23 | 5 568.23 | 99.81 | 99.81 | 99.81 | 99.81 |
| Bearing2_2 | 70 | 2 848.64 | 2 949.91 | 2 949.91 | 2 949.91 | 2 949.91 | 96.44 | 96.44 | 96.44 | 96.44 |
| Bearing2_4 | 70 | 1 798.43 | 1 830.34 | 1 830.34 | 1 830.34 | 1 830.34 | 98.22 | 98.22 | 98.22 | 98.22 |
| Bearing3_4 | 70 | 55 195.86 | 56 648.44 | 56 648.44 | 56 648.44 | 56 648.44 | 97.37 | 97.37 | 97.37 | 97.37 |
| Bearing3_5 | 70 | 1 346.31 | 1 435.74 | 1 435.74 | 1 435.74 | 1 435.74 | 93.36 | 93.36 | 93.36 | 93.36 |
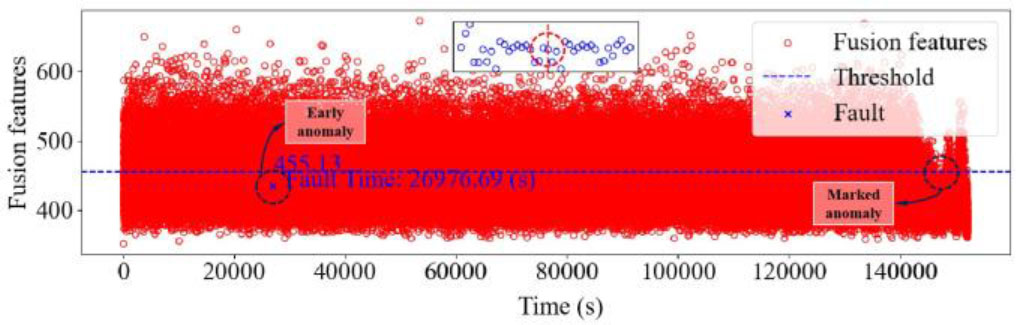
Fig. 6.
The detection result on the NGC dataset.
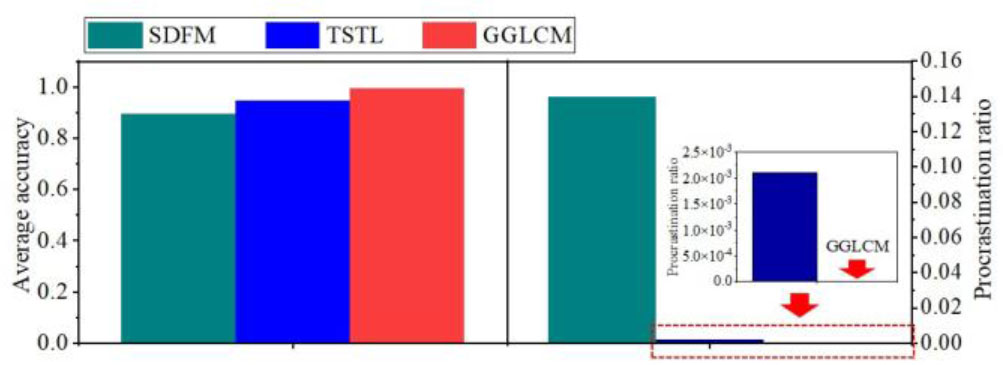
Fig. 7.
Performance comparison of three SOTA methods.