
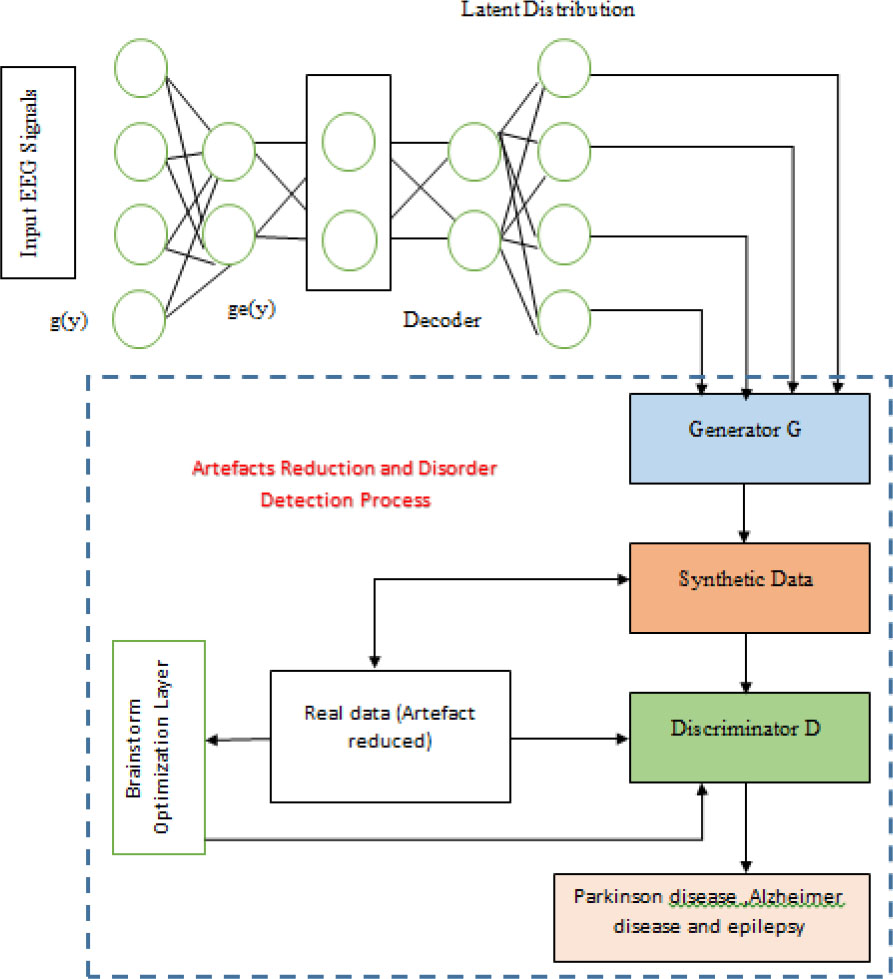
Fig. 1.
BSO-VAE-GAN architecture for artifact reduction.
Table 1.
Accuracy performance of the proposed BrOpt_VAGAN model.
| Mixtures of artifact components | Accuracy [%] | Error [%] | |
|---|---|---|---|
| Pseudo-clean | brain | 98.5 | 12.41 |
| eye | 96.2 | 11.53 | |
| muscle | 97.3 | 12.74 | |
| Noisy input | brain | 98.6 | 11.84 |
| eye | 95.9 | 11.90 | |
| muscle | 93.5 | 12.56 |
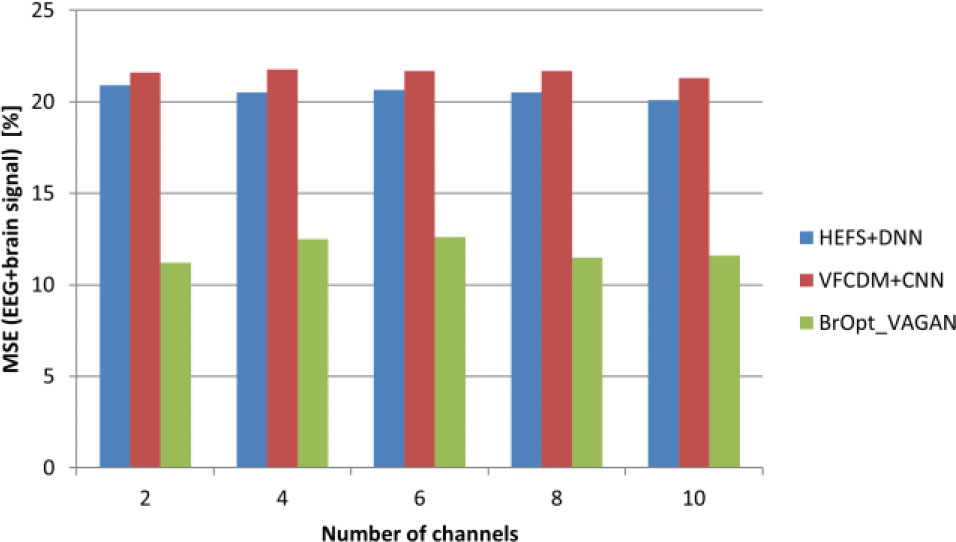
Fig. 2.
Comparison of MSE with the EEG+brain signal artifact.
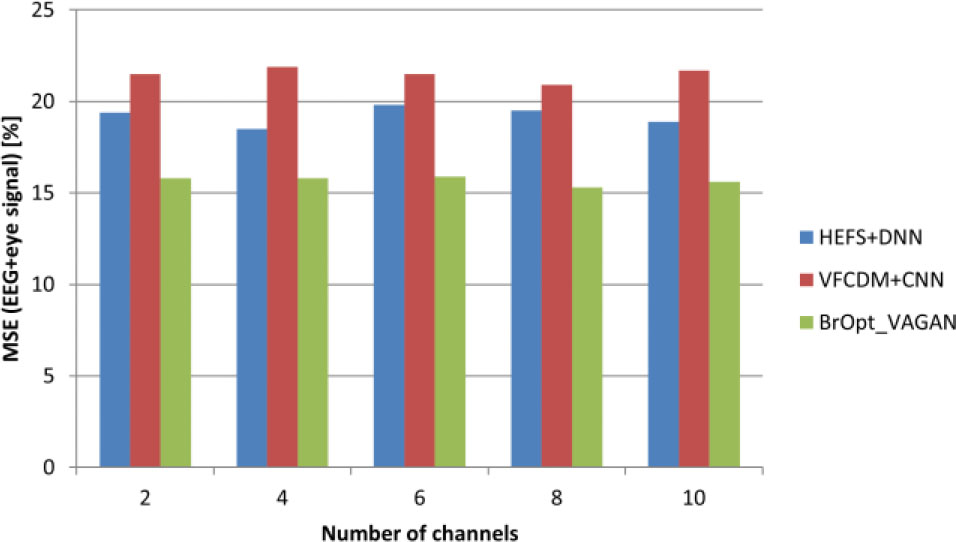
Fig. 3.
Comparison of MSE with the EEG+eye signal artifact.
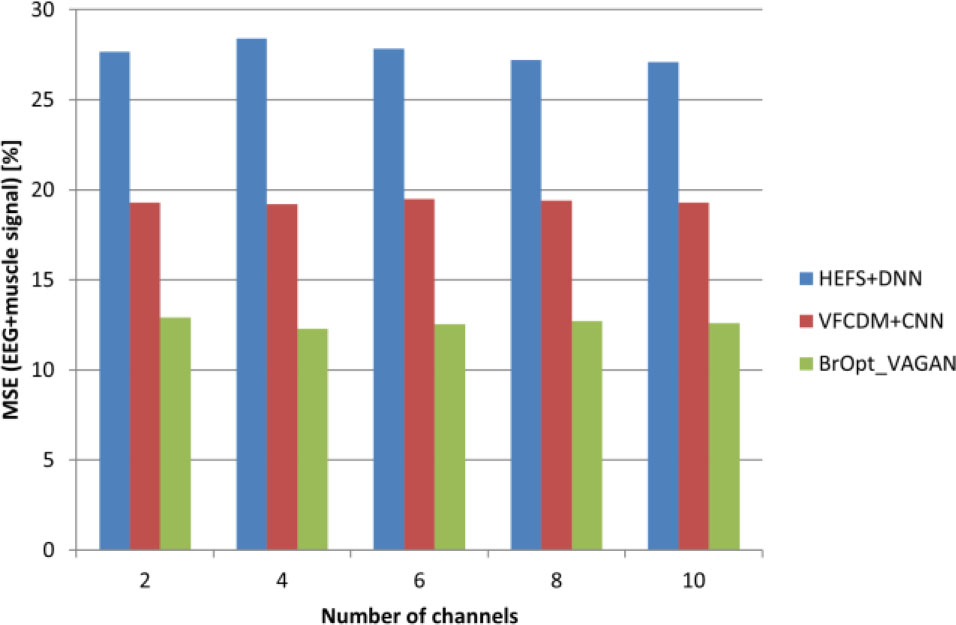
Fig. 4.
Comparison of MSE with the EEG+muscle signal artifact.