
Table 1
Mix proportions and fibre contents.
| Mix | OPC | GGBFS | Fly ash | Water | Fine aggregate | Coarse aggregate | BF (vol.%) | SF (vol.%) | PCE | Accel. |
|---|---|---|---|---|---|---|---|---|---|---|
| OC | 480.0 | 0.0 | 0.0 | 182.4 | 865.0 | 720.0 | 0.0 | 0.0 | 4.8 | 28.8 |
| LC0 | 264.0 | 144.0 | 72.0 | 182.4 | 865.0 | 720.0 | 0.0 | 0.0 | 4.8 | 28.8 |
| LC-B10 | 264.0 | 144.0 | 72.0 | 182.4 | 865.0 | 720.0 | 0.1 | 0.0 | 4.8 | 28.8 |
| LC-B20 | 264.0 | 144.0 | 72.0 | 182.4 | 865.0 | 720.0 | 0.2 | 0.0 | 4.8 | 28.8 |
| LC-S50 | 264.0 | 144.0 | 72.0 | 182.4 | 865.0 | 720.0 | 0.0 | 0.5 | 4.8 | 28.8 |
| LC-S100 | 264.0 | 144.0 | 72.0 | 182.4 | 865.0 | 720.0 | 0.0 | 1.0 | 4.8 | 28.8 |
| LC-H1 | 264.0 | 144.0 | 72.0 | 182.4 | 865.0 | 720.0 | 0.1 | 0.5 | 4.8 | 28.8 |
| LC-H2 | 264.0 | 144.0 | 72.0 | 182.4 | 865.0 | 720.0 | 0.1 | 1.0 | 4.8 | 28.8 |
Binder, water, aggregate, PCE, and accelerator contents are expressed in kg/m3. BF and SF contents are volume fractions. PCE denotes polycarboxylate ether.
Table 2
Specimen and measurement matrix.
| Technique | Specimen | Geometry | Independent n | Condition |
|---|---|---|---|---|
| Slump, air, and wet density | Fresh shotcrete | Batch sample | 3 per mix | Immediately after mixing |
| Rebound | Sprayed panel | 1,000 mm × 1,000 mm × 150 mm | 3 per mix | Immediately after spraying |
| Compressive strength | Sprayed-panel core | Ø100 × 100 mm | 9 per mix and age | 7, 28, and 90 days; parallel to spray direction |
| Splitting tensile strength | Companion cast cylinder | 100 mm × 200 mm | 9 per mix | 28 days |
| Flexural load–CMOD | Notched beam | 100 mm × 100 mm × 400 mm | 9 per mix | 28 days |
| SHPB compression | Sprayed-panel core disc | 50 mm × 25 mm | 9 per mix and rate | 28 days; 40, 80, and 120 s⁻1 plus companion quasi-static discs |
| Instrumented drop weight | Panel | 300 mm × 300 mm × 60 mm | 9 per mix | 28 days |
| High-speed DIC | Drop-weight panel face | 250 mm × 250 mm field | 9 per mix | 20,000 frames/s |
| AE | Drop-weight panel | Four sensors | 9 per mix | 45 dB threshold |
| X-ray diffraction (XRD)–Rietveld | Hydration-stopped powder | <75 µm | 3 per mix | 28 days |
| Fourier-transform infrared spectroscopy (FTIR) and Thermogravimetric analysis/ Derivative thermogravimetry (TGA/DTG) | Hydration-stopped powder | <75 µm | 3 per mix | 28 days |
| Mercury intrusion porosimetry | Matrix fragment | 5–8 mm | 3 per mix | 28 days |
| X-ray micro-computed tomography (micro-CT) | Registered companion-panel core | 25 mm × 50 mm | 3 selected groups | Before/after one 12 J subcritical impact |
| SEM–EDS | Fracture surface | 10 mm fragment | 3 selected groups | 28 days after impact |
| Nanoindentation | Polished matrix/ interfacial transition zone (ITZ) | 20 mm mount | 3 selected groups | 28 days; 25 µm grid spacing |
Independent n refers to specimens assigned across three independently produced batches; analytical fields and images within one specimen were not treated as independent replicates.
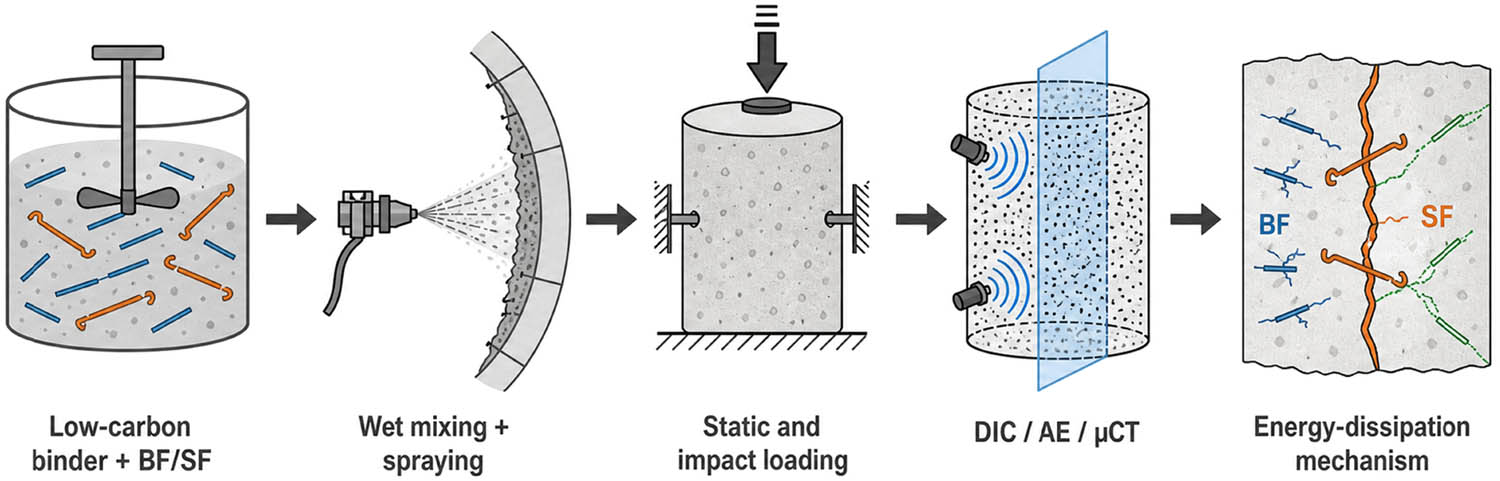
Figure 1
Experimental workflow and proposed multiscale impact-damage mechanism. The single schematic links independent batching and spraying to fresh-state, static, high-rate, repeated-impact, and microstructural measurements, followed by hierarchical statistical integration.
Table 3
Key performance results.
| Mix | 28 days compressive strength (MPa; model 95% CI) | Flexural strength (MPa; model 95% CI) | SEA at 80 s−1 (MJ/m³; model 95% CI) | Drop-weight energy (kJ; model 95% CI) | Embodied carbon (kg CO₂e/m3) | Reduction vs OC (%) |
|---|---|---|---|---|---|---|
| OC | 49.2 (47.1–51.3) | 5.24 (4.92–5.56) | 1.08 (1.00–1.16) | 0.55 (0.47–0.64) | 424.5 | 0.0 |
| LC0 | 45.5 (42.5–48.5) | 5.06 (4.83–5.28) | 0.94 (0.80–1.08) | 0.56 (0.53–0.60) | 258.9 | 39.0 |
| LC-B10 | 51.5 (48.7–54.3) | 5.85 (5.60–6.11) | 1.33 (1.26–1.41) | 0.82 (0.71–0.92) | 261.9 | 38.3 |
| LC-B20 | 48.1 (46.3–50.0) | 5.37 (5.13–5.61) | 1.47 (1.37–1.57) | 0.74 (0.66–0.81) | 264.9 | 37.6 |
| LC-S50 | 50.5 (47.4–53.5) | 7.15 (6.78–7.52) | 1.76 (1.65–1.87) | 1.16 (1.05–1.28) | 277.8 | 34.6 |
| LC-S100 | 59.1 (56.2–61.9) | 8.17 (7.42–8.92) | 2.18 (2.01–2.34) | 1.58 (1.48–1.68) | 296.6 | 30.1 |
| LC-H1 | 59.0 (56.6–61.4) | 8.62 (8.21–9.02) | 2.71 (2.53–2.88) | 1.87 (1.77–1.97) | 280.7 | 33.9 |
| LC-H2 | 63.1 (60.2–65.9) | 9.90 (9.47–10.33) | 3.05 (2.80–3.30) | 2.31 (2.19–2.44) | 299.6 | 29.4 |
Mechanical and impact values are hierarchical-model estimated marginal mean values with 95% confidence intervals (n = 9 specimens across three independent batches); embodied carbon is the deterministic material-stage mixture inventory and reduction is relative to OC.
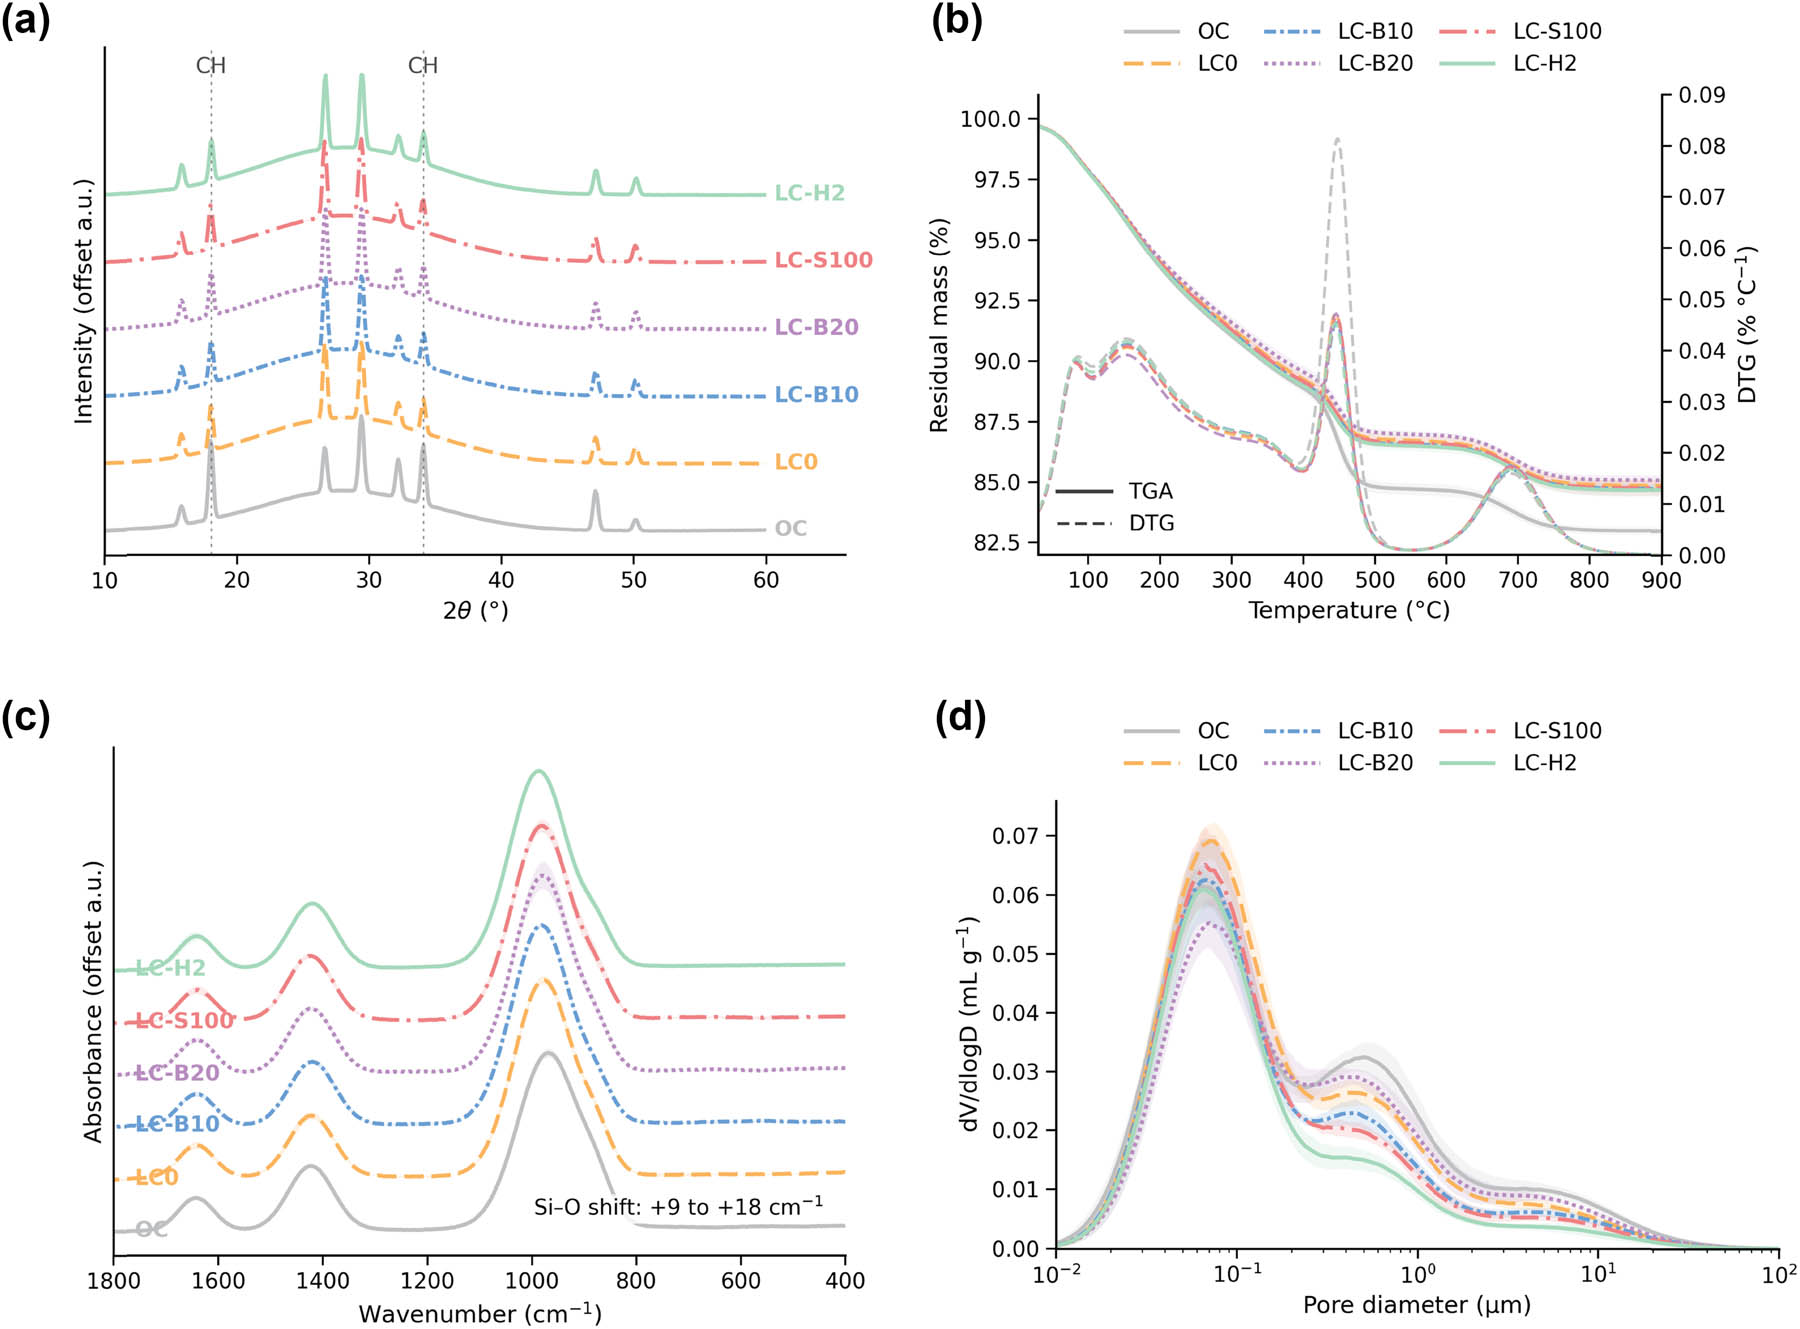
Figure 2
Hydration products and pore structure at 28 days. (a) XRD patterns with principal crystalline reflections; (b) paired TGA residual-mass curves and dashed DTG rates; (c) FTIR spectra in the Si–O stretching region; (d) normalised mercury-intrusion distributions over pore diameter. Curves are representative of three independently batched specimens per mixture (n = 3).
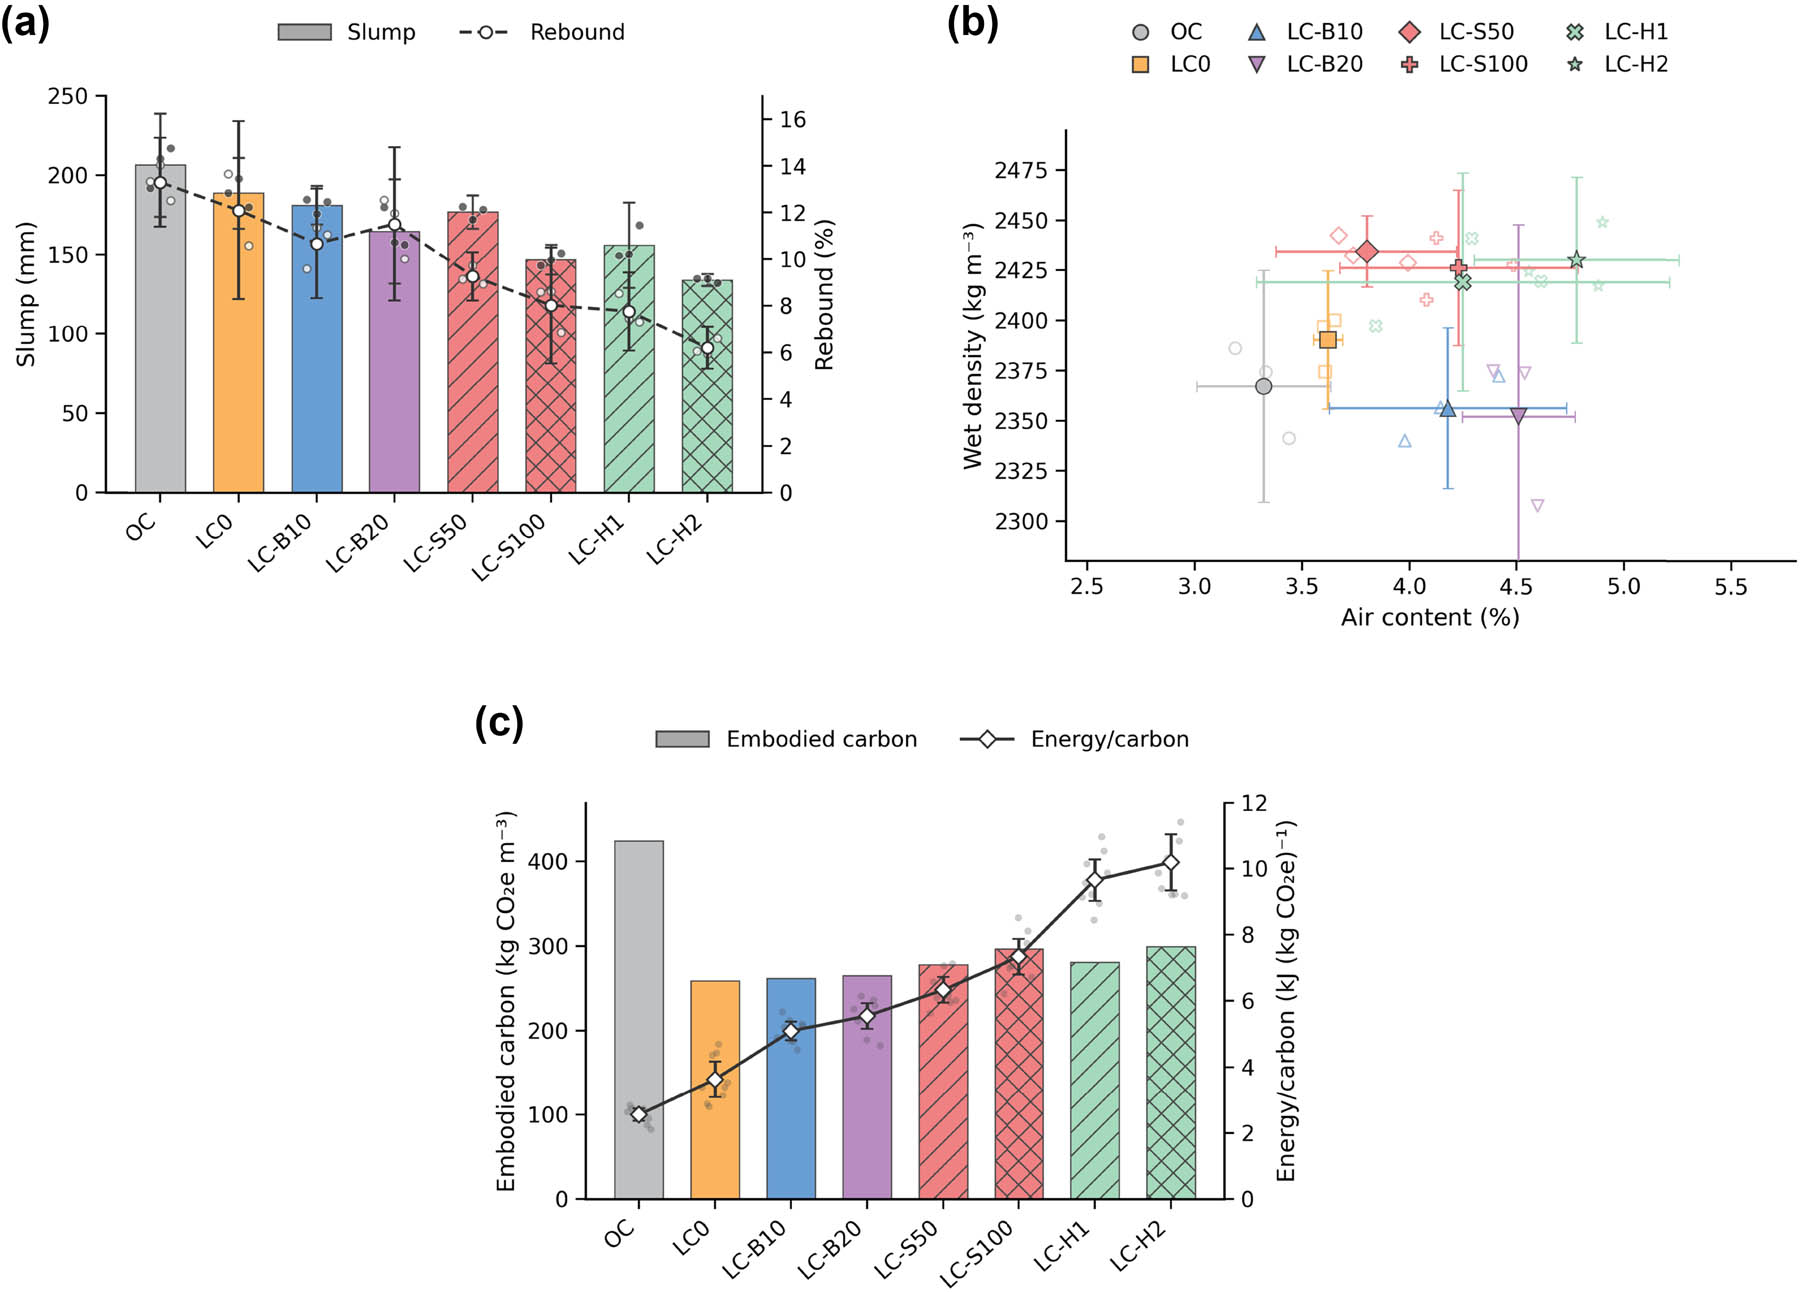
Figure 3
Fresh-state performance and carbon efficiency. (a) Slump bars and rebound curves with mean value ±95% CI; (b) mean air content plotted against mean wet density; (c) material-stage embodied carbon and SEA per unit carbon. Fresh-state summaries represent three independent batches per mixture (n = 3).
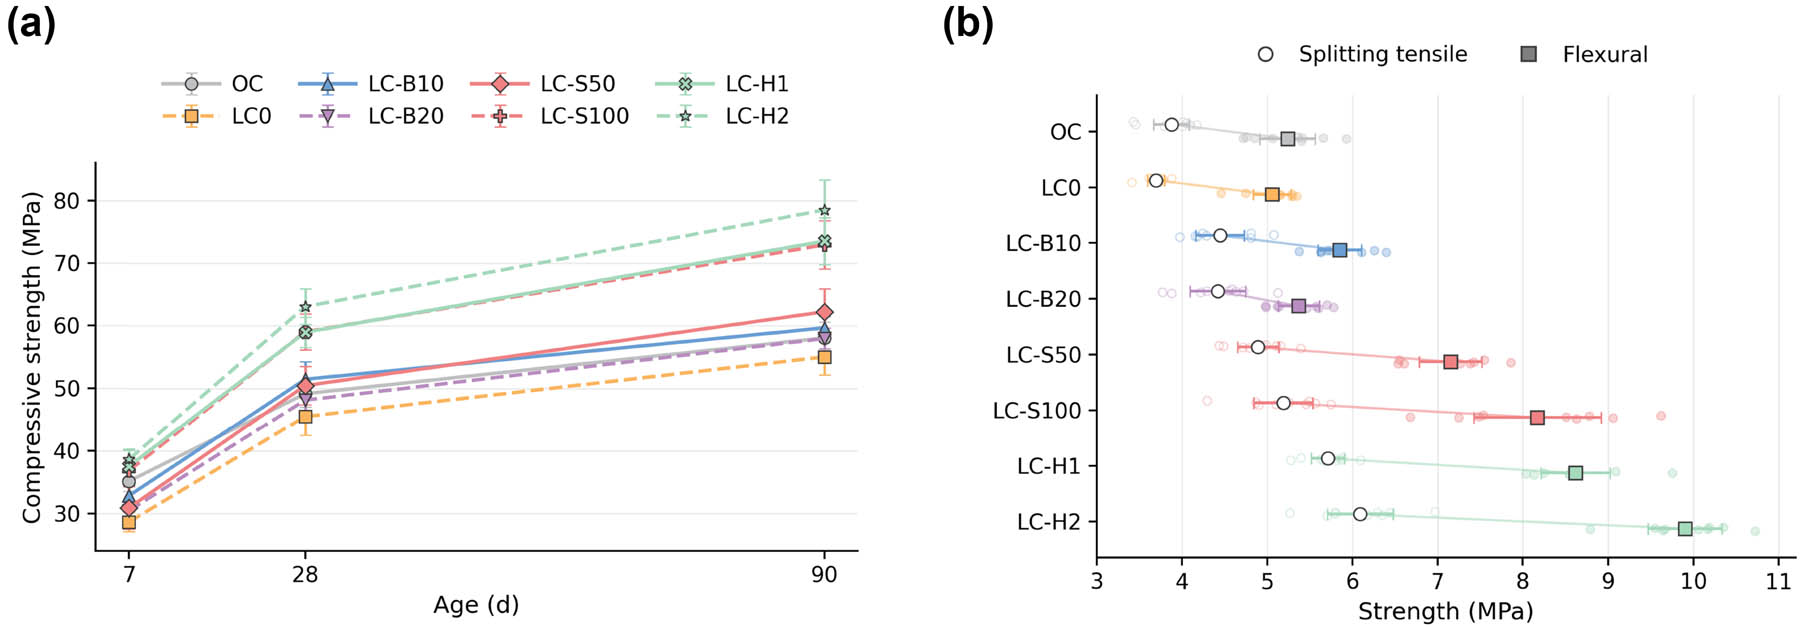
Figure 4
Quasi-static mechanical performance. (a) Compressive-strength development at 7, 28, and 90 days; (b) 28 days splitting tensile and flexural strengths. Error bars are 95% CI from nine specimens distributed across three batches.
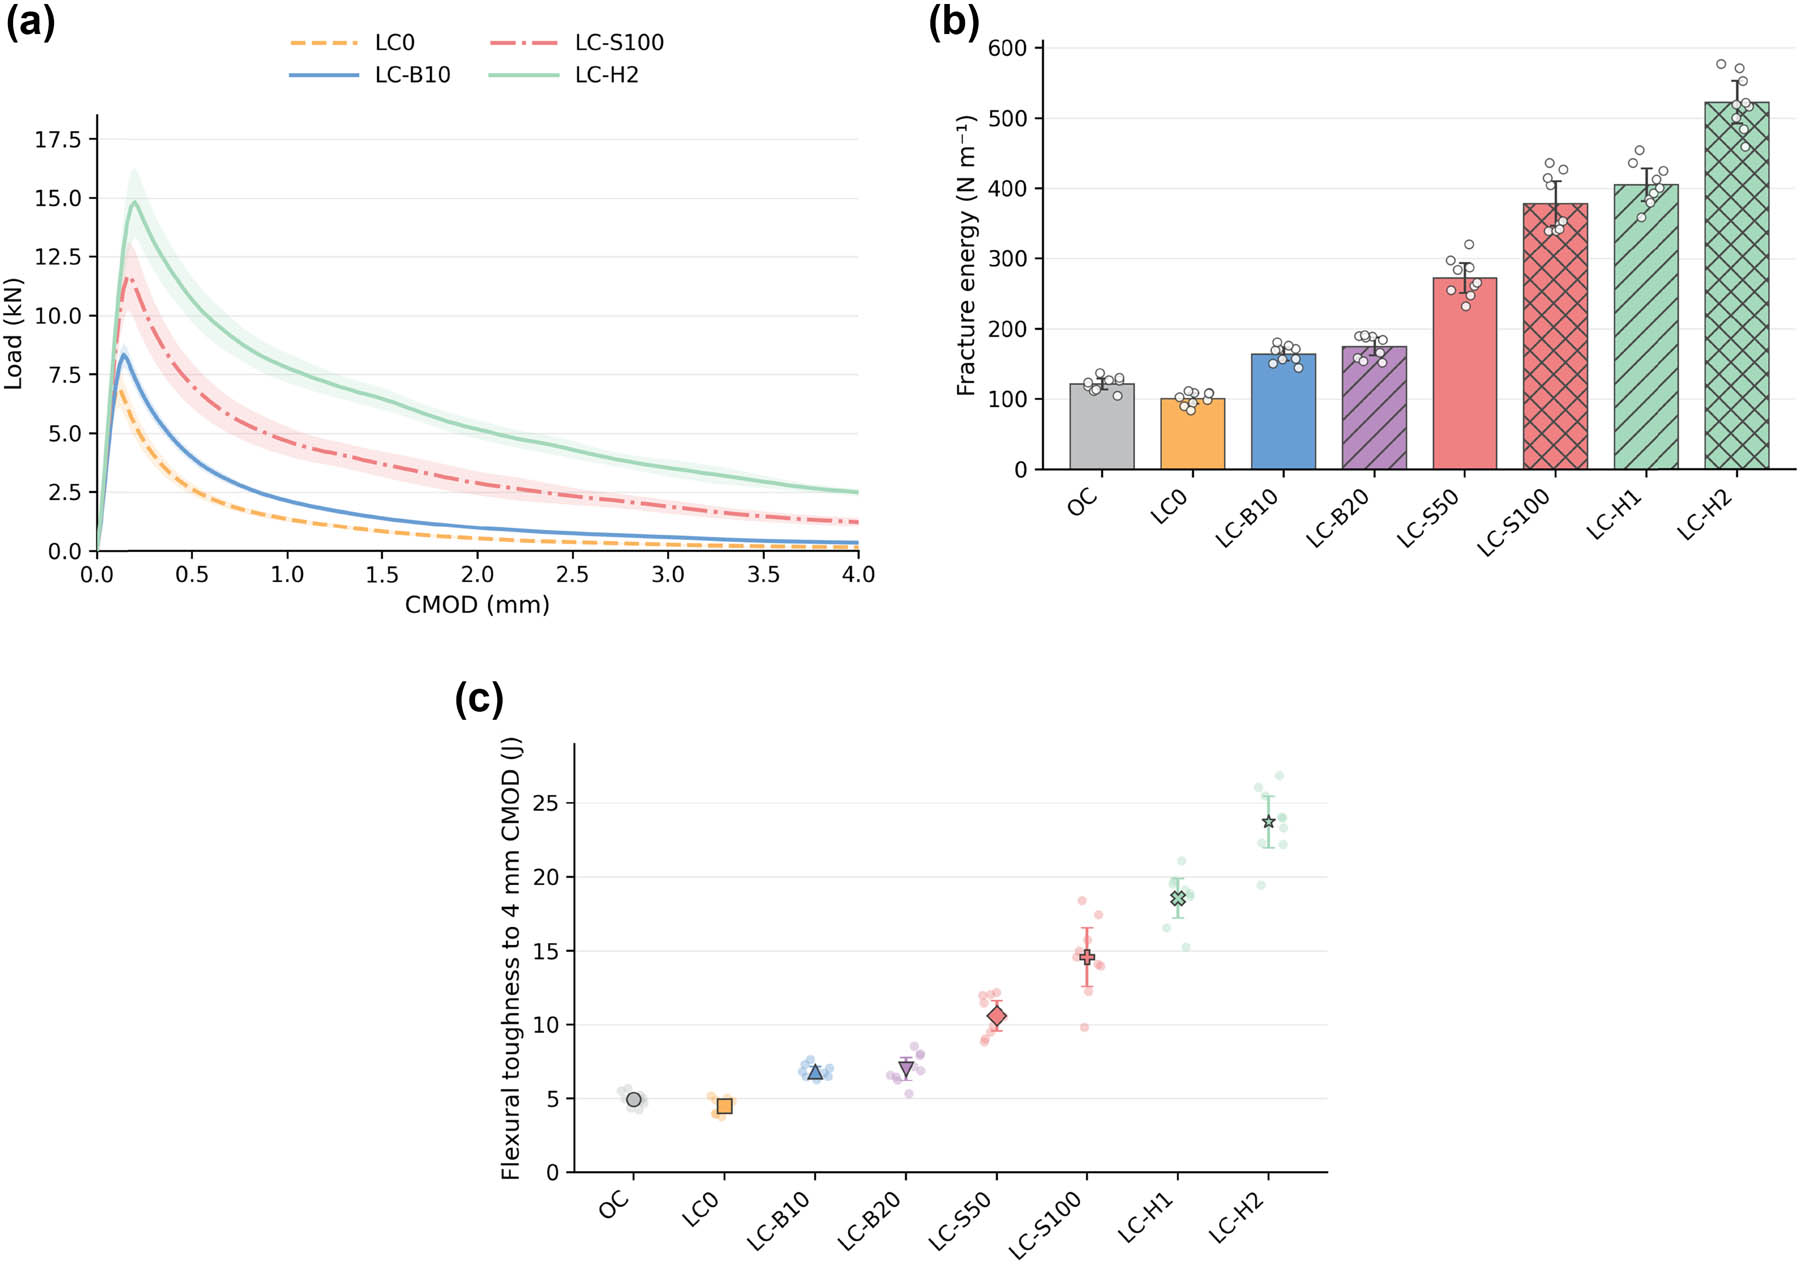
Figure 5
Flexural fracture response. (a) Representative load–CMOD curves; (b) fracture energy; (c) toughness integrated to 4 mm CMOD. Bars and points show specimen observations and 95% CI (n = 9).
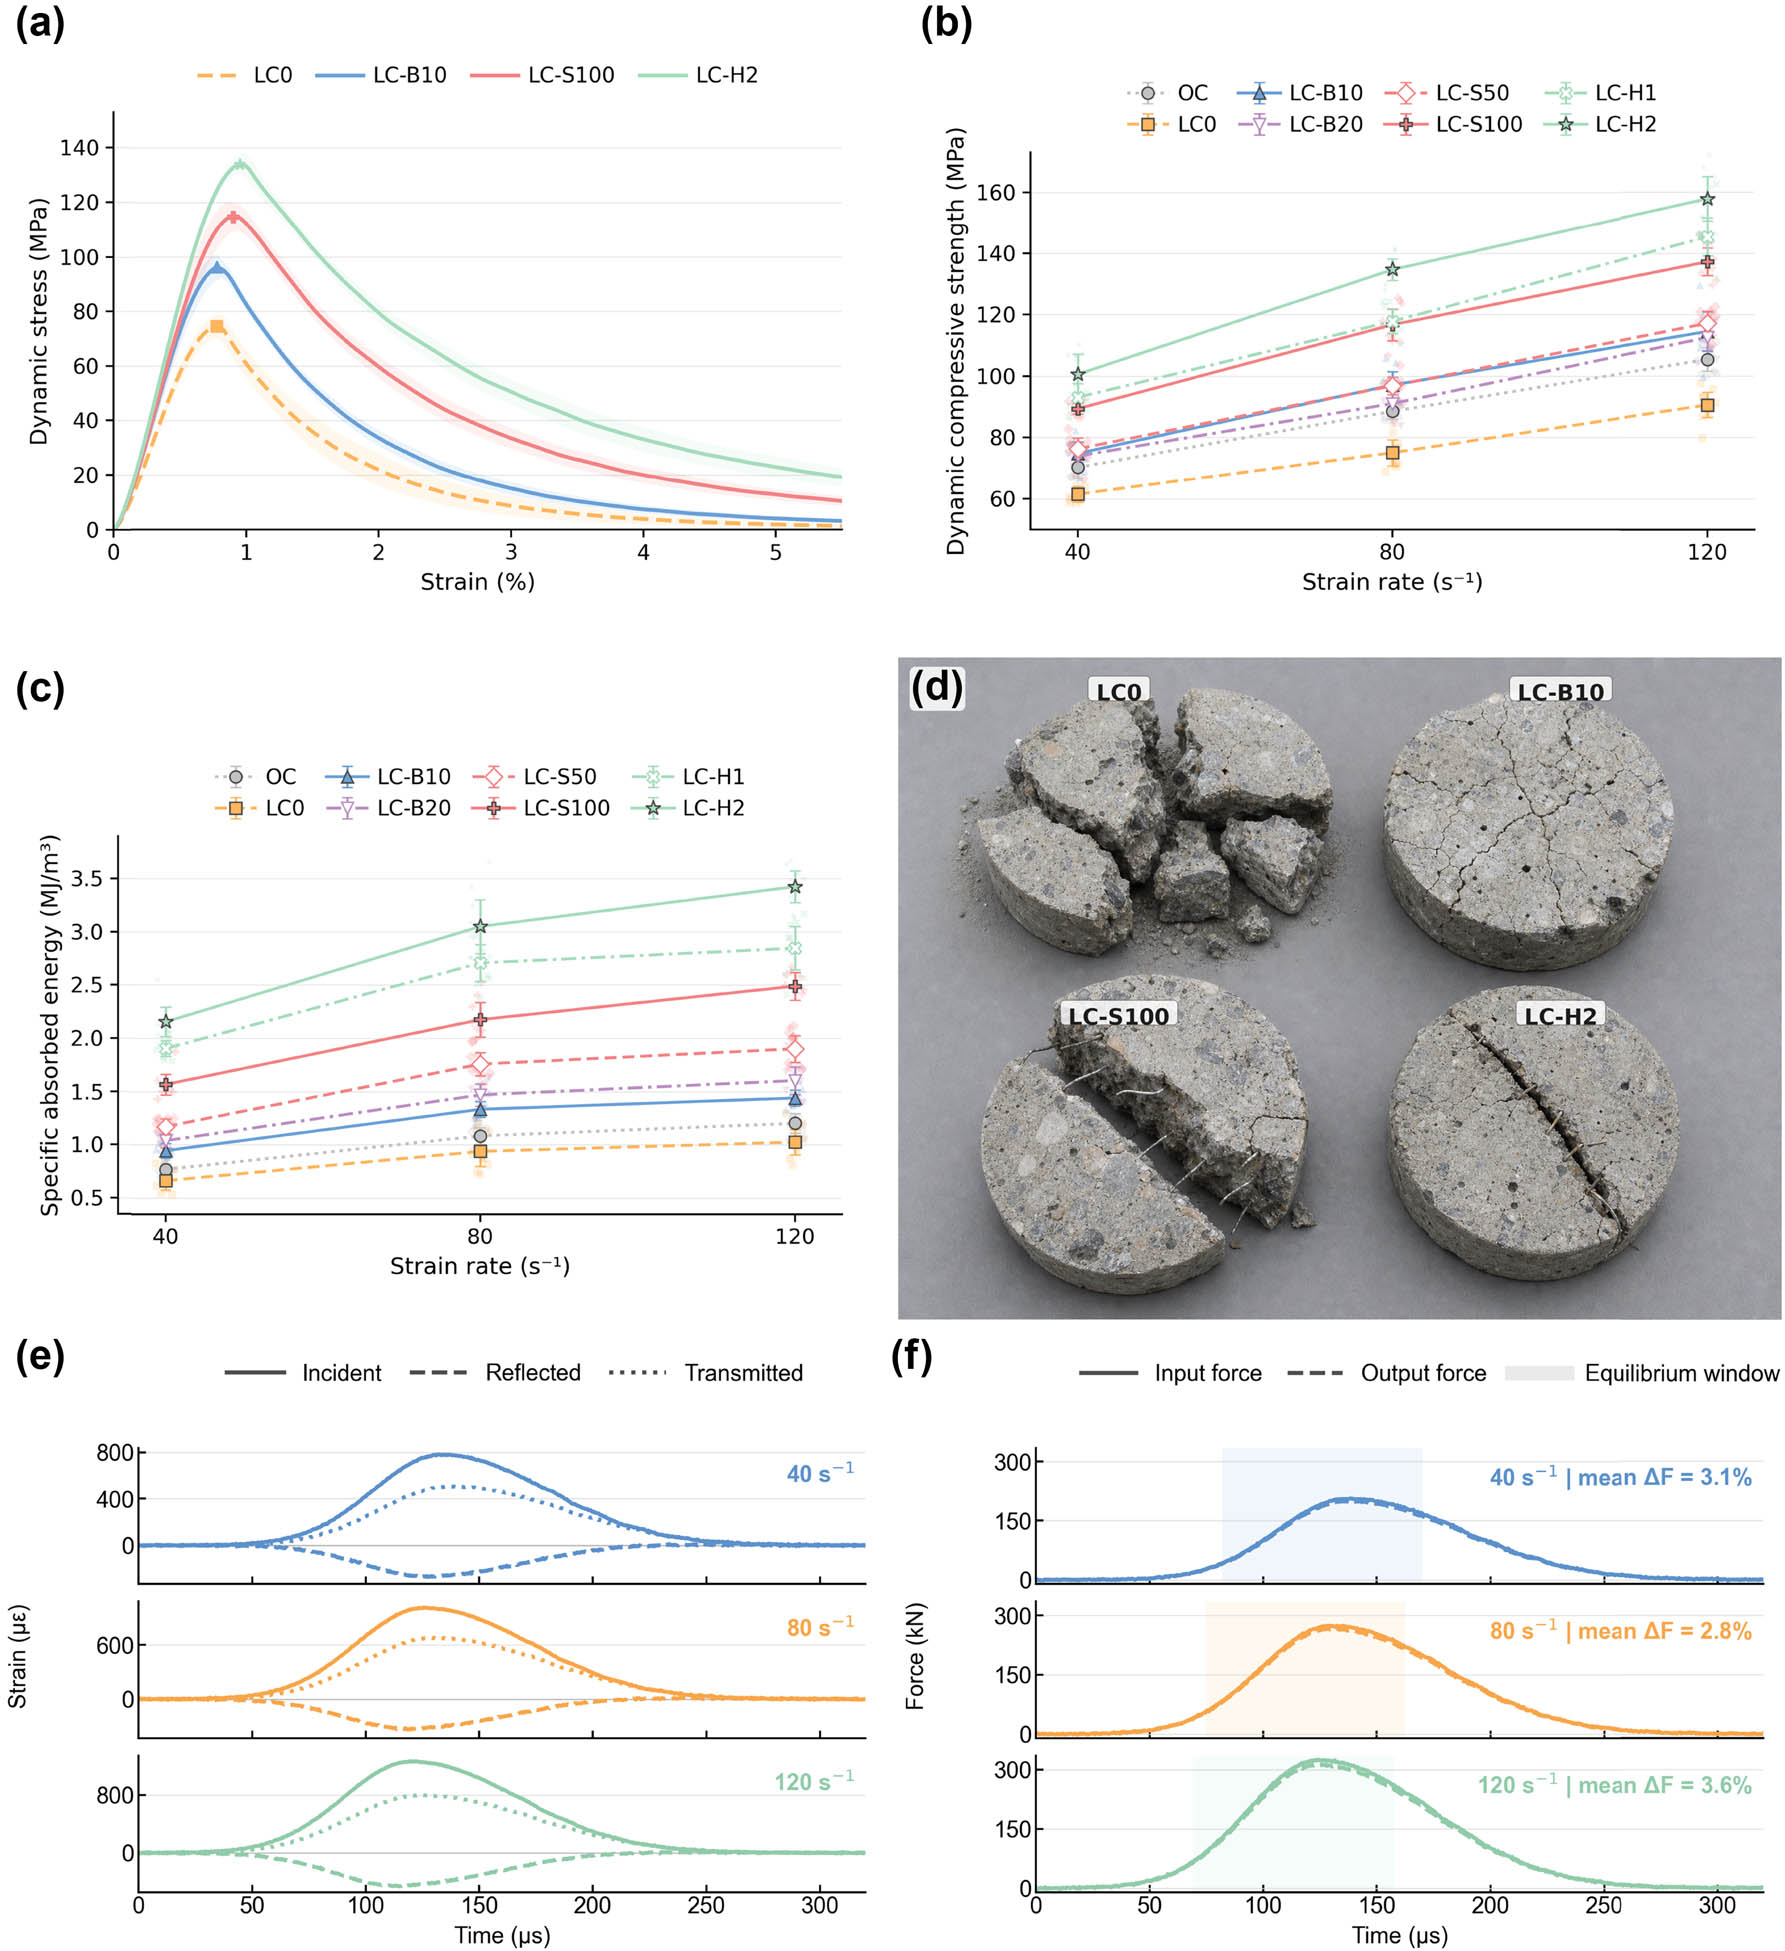
Figure 6
SHPB response and failure morphology. (a) Representative dynamic stress–strain curves at 80 s−1; (b) dynamic compressive strength vs strain rate; (c) SEA vs strain rate; (d) post-impact failure maps at 80 s−1; (e) representative incident, reflected, and transmitted strain waves at 40, 80, and 120 s−1; (f) corresponding input and output force-equilibrium histories. Error bars are hierarchical-model 95% CI (n = 9 specimens per mixture and rate across three batches); maps use a common damage scale.
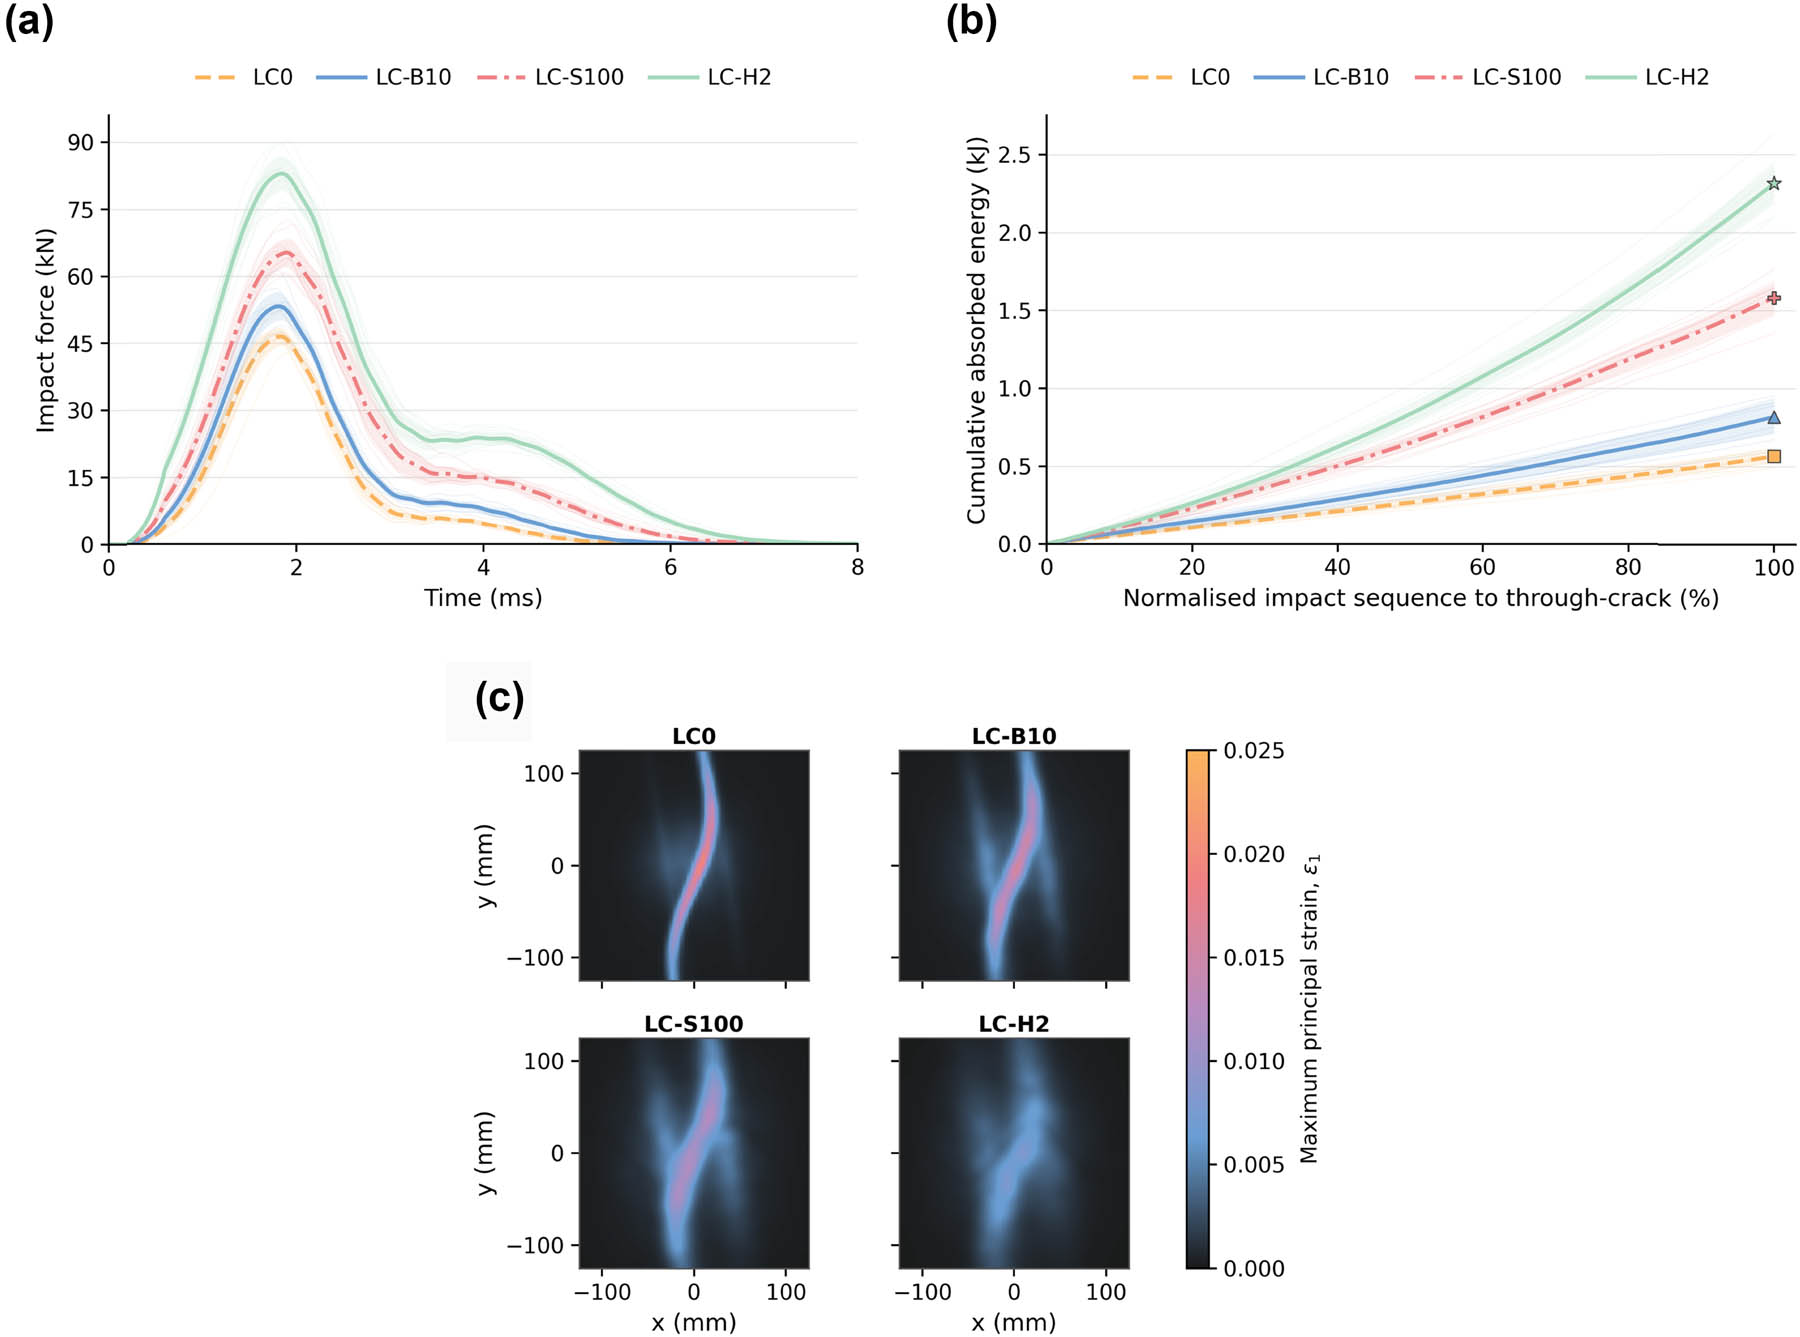
Figure 7
Instrumented drop-weight response and full-field deformation. (a) Representative force–time histories; (b) cumulative absorbed-energy histories; (c) DIC maximum-principal-strain fields near peak response. Summary values derive from nine panels per mix across three batches.
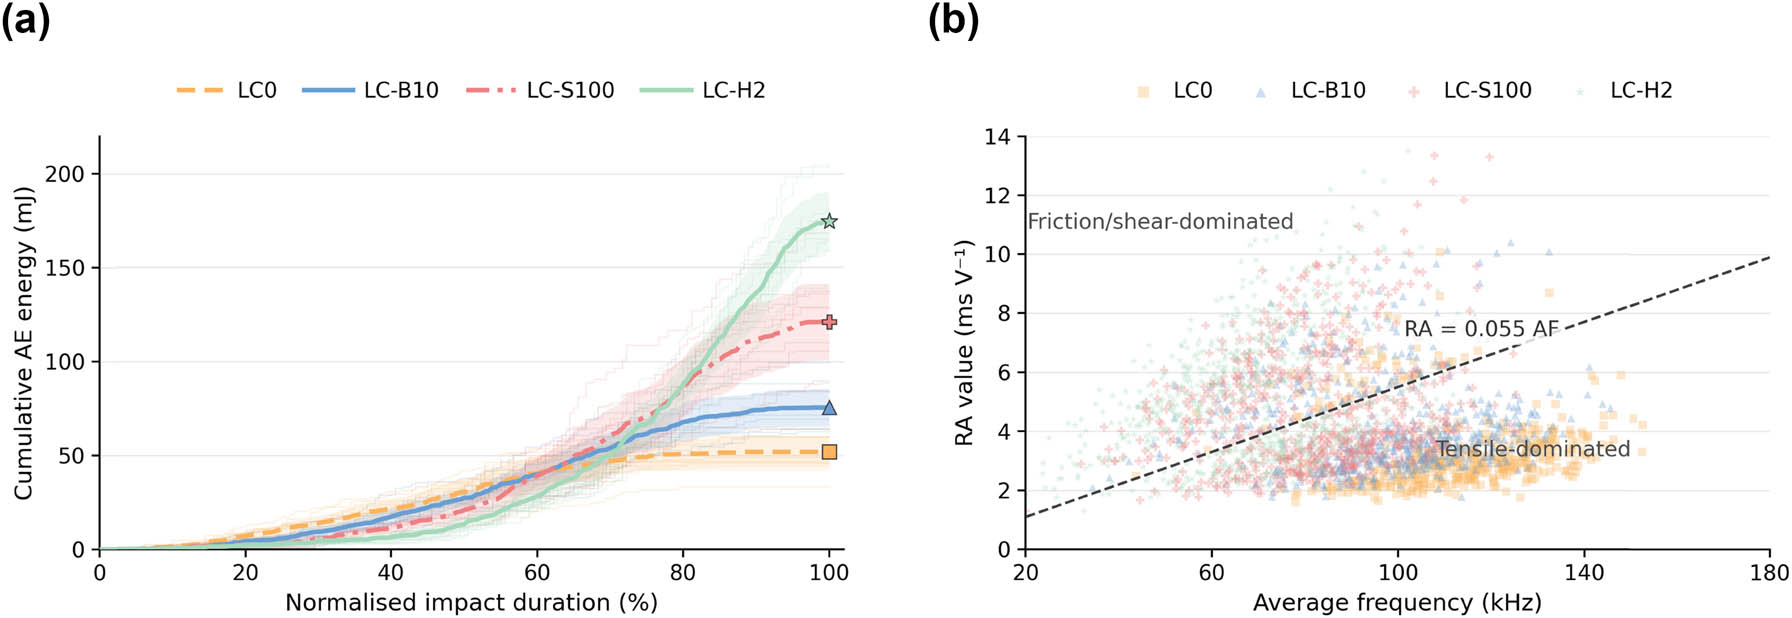
Figure 8
AE evolution during drop-weight impact. (a) Cumulative AE energy normalised by impact duration; (b) RA vs average frequency distributions identifying tensile-dominated and frictional or shear-dominated activity. Each mixture combines nine panels; trend curves are descriptive, whereas inferential tests use panel-level outcomes.
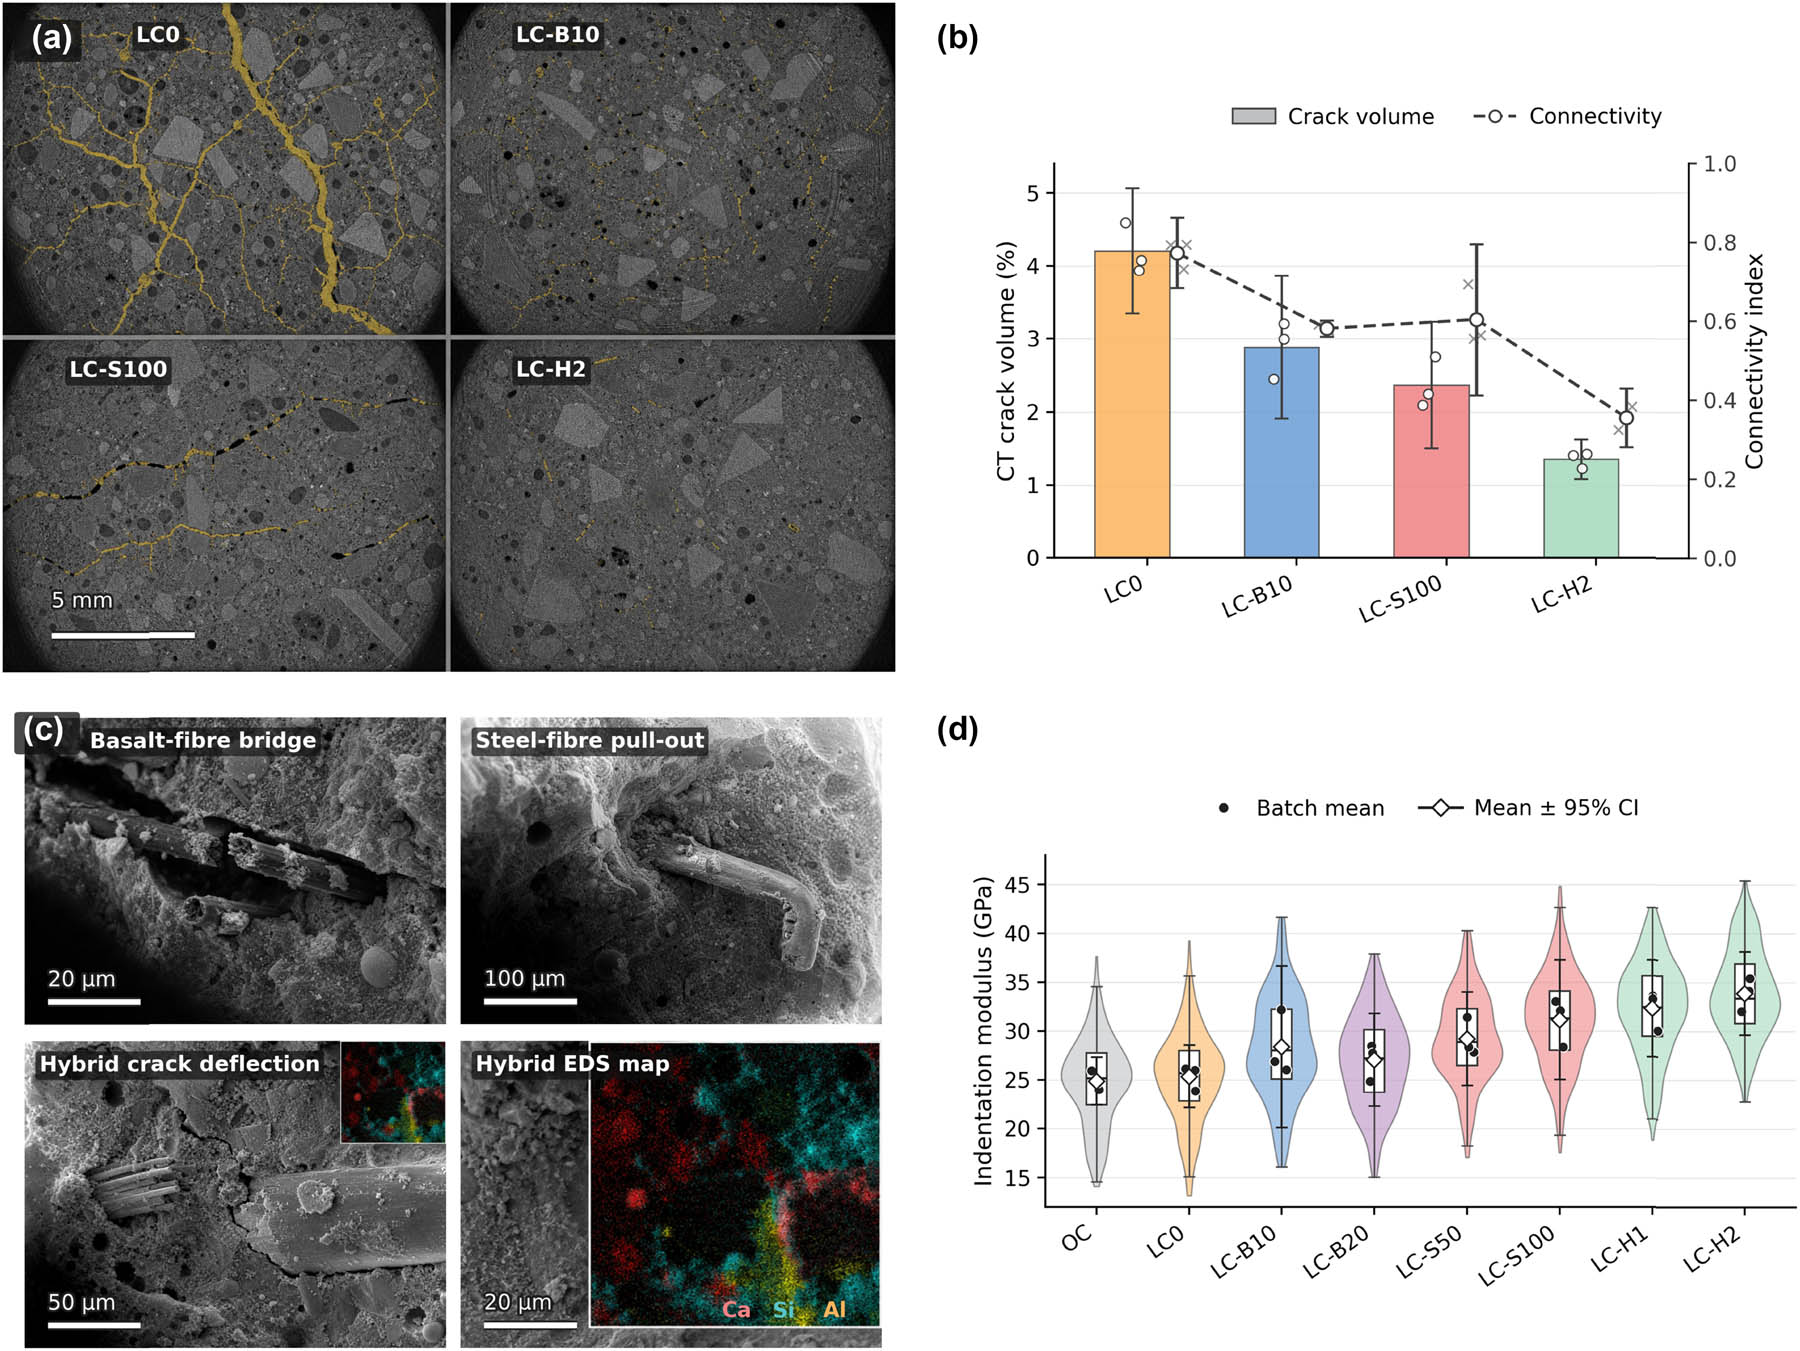
Figure 9
Three-dimensional cracking and fibre–matrix interfaces. (a) Micro-CT crack projections; (b) crack volume and connectivity; (c) representative SEM–EDS interface fields; (d) nanoindentation modulus distributions. Microstructural summaries represent three independently batched specimens per selected mix; box plots display medians, quartiles, and 1.5-IQR whiskers.