
1. Introduction
Shotcrete forms a thin, rapidly installed structural skin that transfers fractured-rock loads to bolts, ribs, and the surrounding rock mass. Its effectiveness in a deep roadway depends on adhesion, early strength, deformability, and the ability to remain coherent after local cracking. ACI guidance treats material selection, delivery, nozzle operation, and curing as one coupled process because changes made to fresh-state delivery can alter the in-place structure [1]. Recent mine-focused work likewise shows that fibre-reinforced shotcrete should be assessed by post-crack load retention rather than compressive strength alone [2]. This distinction becomes critical under rockburst or equipment impact, where a brittle matrix may reach a high peak stress yet release little energy before fragmentation.
Spraying creates directional compaction, fibre alignment, rebound, and layer interfaces that are absent from conventionally cast concrete. Measurements on plain and steel-fibre shotcrete have confirmed that coring direction can therefore produce systematic strength anisotropy [3]. Fibre additions also change fresh rheology and plastic-shrinkage cracking, so an impact-resistant formulation can fail operationally if the nozzle stream segregates or rebounds excessively [4]. A useful roadway mixture must consequently balance fresh-state stability, matrix decarbonisation, static strength, and dynamic energy absorption within one experimental design.
Basalt and steel fibres (SFs) act at different crack scales. Direct tests on steel–basalt hybrid concrete show that basalt fibre geometry and dosage affect both mechanical response and environmental resistance [5]. Compression studies further indicate that hybridisation improves confinement only within a workable dosage window; excessive fine fibres can introduce voids and weak bundles [6]. Flexural and microstructural observations identify complementary small- and large-crack bridging [7]. The present work therefore does not claim the general concept of sequential fibre action as new.
The durability literature supports basalt fibre (BF) as a mineral reinforcement but also documents alkaline-interface and dispersion limitations [8]. Multiscale hybrid fibre models explain why fibre spacing, orientation, and pull-out resistance must be considered together instead of treating total fibre volume as the controlling variable [9]. Previous split Hopkinson pressure bar (SHPB) and notched-beam studies have already established rate-sensitive and fracture benefits of other hybrid fibre systems [10,11]. The specific contribution here is the application of basalt–steel hybridisation to a sprayed, clinker-reduced slag–fly-ash matrix and the integration of high-rate compression, repeated impact, digital image correlation (DIC), acoustic emission (AE), three-dimensional crack topology, and interfacial measurements within one independent-batch design. This scope distinguishes the study from prior work on conventionally cast hybrid fibre concrete.
Carbon reduction adds a second constraint. Life-cycle assessments show that replacing clinker with supplementary cementitious materials usually lowers cradle-to-gate impact, but transport, activators, curing, and reinforcement can offset part of the saving [12]. Long-term exposure data for fly-ash and slag concretes also show that lower early strength does not imply inferior service performance because continued reaction refines transport paths [13]. The present study compared eight mixtures and tested whether a moderate basalt dosage combined with SF would produce a positive, scale-dependent energy excess while retaining a substantial carbon advantage. Three independent batches, pre-specified primary outcomes, hierarchical statistics, and a multitechnique damage analysis were used to evaluate that hypothesis without treating individual images or indents as independent specimens.
2. Experimental methods
The ordinary Portland cement control (OC) contained 480 kg/m3 CEM I 42.5 R ordinary Portland cement (OPC). All low-carbon mixtures used the same binder content and water-to-binder ratio of 0.38, replacing OPC with 30% ground granulated blast-furnace slag (GGBFS) and 15% Class F fly ash by mass. X-ray fluorescence compositions (mass %, reported as OPC/GGBFS/fly ash) were SiO2 20.8/34.6/55.2, Al2O3 5.1/13.8/26.4, Fe2O3 3.2/0.8/6.8, CaO 63.5/41.2/5.0, MgO 2.4/7.6/1.5, SO3 2.7/0.4/0.6, and loss on ignition 2.1/0.9/3.5. Their Blaine fineness were 358/425/318 m2/kg and densities were 3.12/2.88/2.25 g/cm3. Natural river sand (0–4 mm; fineness modulus 2.62; 1.3% absorption; saturated-surface-dry density 2,650 kg/m3) and crushed limestone (4–10 mm; 0.7% absorption; saturated-surface-dry density 2,680 kg/m3) formed the aggregate skeleton; batch water was corrected for measured moisture. The polycarboxylate ether (PCE) reducer had 40% solids and density 1.08 g/cm3. The alkali-free aluminium-sulphate accelerator had 49.2% solids, density 1.42 g/cm3, pH 2.7, and 0.8% Na2O-equivalent alkali. PCE and accelerator were fixed at 4.8 and 28.8 kg/m3, respectively. Chopped silane-sized BFs (Kamenny Vek, Russia) were 18 mm long and 16 µm in diameter, with density 2.70 g/cm3, tensile strength 3.1 GPa, and elastic modulus 89 GPa. Hooked-end SFs (Dramix 3D 55/30 BG, NV Bekaert SA, Belgium) were supplied in glued bundles and were 30 mm long and 0.55 mm in diameter, with density 7.85 g/cm3, tensile strength 1.35 GPa, and elastic modulus 200 GPa. Table 1 reports all eight formulations.
Table 1
Mix proportions and fibre contents.
| Mix | OPC | GGBFS | Fly ash | Water | Fine aggregate | Coarse aggregate | BF (vol.%) | SF (vol.%) | PCE | Accel. |
|---|---|---|---|---|---|---|---|---|---|---|
| OC | 480.0 | 0.0 | 0.0 | 182.4 | 865.0 | 720.0 | 0.0 | 0.0 | 4.8 | 28.8 |
| LC0 | 264.0 | 144.0 | 72.0 | 182.4 | 865.0 | 720.0 | 0.0 | 0.0 | 4.8 | 28.8 |
| LC-B10 | 264.0 | 144.0 | 72.0 | 182.4 | 865.0 | 720.0 | 0.1 | 0.0 | 4.8 | 28.8 |
| LC-B20 | 264.0 | 144.0 | 72.0 | 182.4 | 865.0 | 720.0 | 0.2 | 0.0 | 4.8 | 28.8 |
| LC-S50 | 264.0 | 144.0 | 72.0 | 182.4 | 865.0 | 720.0 | 0.0 | 0.5 | 4.8 | 28.8 |
| LC-S100 | 264.0 | 144.0 | 72.0 | 182.4 | 865.0 | 720.0 | 0.0 | 1.0 | 4.8 | 28.8 |
| LC-H1 | 264.0 | 144.0 | 72.0 | 182.4 | 865.0 | 720.0 | 0.1 | 0.5 | 4.8 | 28.8 |
| LC-H2 | 264.0 | 144.0 | 72.0 | 182.4 | 865.0 | 720.0 | 0.1 | 1.0 | 4.8 | 28.8 |
Binder, water, aggregate, PCE, and accelerator contents are expressed in kg/m3. BF and SF contents are volume fractions. PCE denotes polycarboxylate ether.
Dry powders and aggregates were mixed for 90 s before 80% of the water and PCE were introduced. Fibres were dispersed gradually during a further 120 s; the remaining water was then added and mixing continued for 90 s. A wet-mix pump delivered each batch through a 50 mm hose to a robotic nozzle positioned 1.2 m normal to plywood moulds. Accelerator entered at the nozzle. The nozzle trajectory, air pressure, delivery rate, and operator programme remained fixed. Rebound was collected from a protected floor sheet and expressed as a percentage of delivered material. Spraying and sampling followed EFNARC process controls [14]. Panels were immediately covered with polyethylene film and wet geotextile, demoulded after 24 h, and fog-cured at 20 ± 2°C and relative humidity ≥95%. Cores and beams were cut at 21 days and returned to the same curing environment until testing. Three complete batches were produced on separate days for every mixture; batch, rather than an individual specimen field, image, or instrument reading, defined the highest independent experimental level.
Compressive specimens were 100 mm diameter cores drilled normal to the sprayed panel face (parallel to the spraying direction), trimmed to 100 ± 2 mm length, moisture-conditioned, and tested at 7, 28, and 90 days in accordance with ASTM C1604/C1604M [15]. Splitting tensile strength used companion 100 mm × 200 mm cylinders cast from the wet mixture sampled immediately before nozzle accelerator injection and tested at 28 days according to ASTM C496/C496M [16]; these cylinders were not described as sprayed-panel cores. Flexural specimens were 100 mm × 100 mm × 400 mm beams sawn from sprayed panels, loaded in three-point bending over a 300 mm span. A 25 mm deep, 3 mm wide midspan notch left a 75 mm ligament; a clip gauge on knife edges measured crack-mouth opening displacement (CMOD). Loading was 0.05 mm/min to 0.10 mm CMOD and 0.20 mm/min thereafter to 4.0 mm CMOD. The geometry and CMOD interpretation followed EN 14651 and RILEM TC 162-TDF [17,18], with the stated smaller beam depth treated as an adaptation rather than strict standard conformity. Fracture energy was G F = [∫0 δu P(δ)dδ + mgδ u]/[b(h − a 0)], including self-weight, with δ u corresponding to 4.0 mm CMOD; flexural toughness T 4 = ∫0 4 mmP d(CMOD) was reported separately without ligament normalisation. Nine specimens per mixture and condition were tested, three from each batch.
Dynamic compression used 50 mm diameter, 25 mm thick discs obtained from 50 mm cores drilled normal to the sprayed panel face at 21 days and returned to fog curing until 28 days. Both faces were lapped to ≤0.02 mm parallelism and ≤0.05° angular deviation; petroleum jelly provided a reproducible low-friction interface. A 50 mm SHPB and copper pulse shapers produced a smooth incident pulse. Stress and strain rate were calculated as σ s(t) = E b A b ε t(t)/A s and ε̇ s(t) = −2C b ε r(t)/L s; the reported rate was the mean between 20 and 80% of peak stress. Equilibrium required |F in − F out|/[(F in + F out)/2] ≤ 5%, where F in = E b A b(ε i + ε r) and F out = E b A b ε t. Three nominal rate bands (40, 80, and 120 s−1) were obtained by striker velocity; nine valid discs were retained for every mixture–rate combination following round-robin signal controls [19]. Specific absorbed energy was SEA = ∫0 εu σ(ε)dε, where ε u is the first post-peak point at which a five-point moving-average stress fell below 0.20σ pk and remained below that level for ≥20 µs. Baseline and dispersion corrections were applied, and negative unloading or oscillatory increments were excluded from the monotonic dissipated-energy accumulation. Companion 50 mm × 25 mm discs from the same core orientation were loaded quasi-statically at 10−4 s−1 to calculate the dynamic increase factor (DIF), avoiding comparison with the 100 mm shotcrete cores. Their mean strengths for OC, LC0, LC-B10, LC-B20, LC-S50, LC-S100, LC-H1, and LC-H2 were 54.0, 50.1, 56.8, 52.9, 55.6, 65.0, 64.9, and 69.4 MPa, respectively (n = 9 each). The thickness-to-maximum-aggregate ratio was only 2.5, so absolute dynamic strengths and DIFs are interpreted within this geometry.
Instrumented drop-weight tests used 300 mm × 300 mm × 60 mm panels simply supported over a 250 mm clear span. A hemispherical 50 kg tup was dropped from 0.50 m, giving a theoretical incident potential energy mgh = 0.245 kJ per blow. Panels were fully unloaded for 60 s between blows and reseated at the same marked position and orientation; they were not inverted. A through-crack was defined after unloading as a continuous rear-face crack ≥0.10 mm wide extending from the impact zone to a support line or free edge. Testing ended at that condition or 40 blows. Absorbed energy for blow i was E i = ∫F idu i; the reported endpoint was cumulative ΣE i through and including the terminal blow. Force, displacement, and tup acceleration were sampled at 100 kHz. A camera at 20,000 frames/s recorded a stochastic speckle pattern. Two-dimensional DIC used calibrated 21-pixel subsets, a 7-pixel step, a 0.245 mm/pixel scale, a 15-pixel Gaussian strain filter, 0.012-pixel zero-displacement noise, and ±120 µε strain uncertainty. Four broadband AE sensors were coupled to the rear face, sampled at 2 MHz, and triggered at 45 dB. The synchronised AE–DIC approach followed established multitechnique monitoring practice [20]. Table 2 summarises geometry, replication, and timing.
Table 2
Specimen and measurement matrix.
| Technique | Specimen | Geometry | Independent n | Condition |
|---|---|---|---|---|
| Slump, air, and wet density | Fresh shotcrete | Batch sample | 3 per mix | Immediately after mixing |
| Rebound | Sprayed panel | 1,000 mm × 1,000 mm × 150 mm | 3 per mix | Immediately after spraying |
| Compressive strength | Sprayed-panel core | Ø100 × 100 mm | 9 per mix and age | 7, 28, and 90 days; parallel to spray direction |
| Splitting tensile strength | Companion cast cylinder | 100 mm × 200 mm | 9 per mix | 28 days |
| Flexural load–CMOD | Notched beam | 100 mm × 100 mm × 400 mm | 9 per mix | 28 days |
| SHPB compression | Sprayed-panel core disc | 50 mm × 25 mm | 9 per mix and rate | 28 days; 40, 80, and 120 s⁻1 plus companion quasi-static discs |
| Instrumented drop weight | Panel | 300 mm × 300 mm × 60 mm | 9 per mix | 28 days |
| High-speed DIC | Drop-weight panel face | 250 mm × 250 mm field | 9 per mix | 20,000 frames/s |
| AE | Drop-weight panel | Four sensors | 9 per mix | 45 dB threshold |
| X-ray diffraction (XRD)–Rietveld | Hydration-stopped powder | <75 µm | 3 per mix | 28 days |
| Fourier-transform infrared spectroscopy (FTIR) and Thermogravimetric analysis/ Derivative thermogravimetry (TGA/DTG) | Hydration-stopped powder | <75 µm | 3 per mix | 28 days |
| Mercury intrusion porosimetry | Matrix fragment | 5–8 mm | 3 per mix | 28 days |
| X-ray micro-computed tomography (micro-CT) | Registered companion-panel core | 25 mm × 50 mm | 3 selected groups | Before/after one 12 J subcritical impact |
| SEM–EDS | Fracture surface | 10 mm fragment | 3 selected groups | 28 days after impact |
| Nanoindentation | Polished matrix/ interfacial transition zone (ITZ) | 20 mm mount | 3 selected groups | 28 days; 25 µm grid spacing |
Independent n refers to specimens assigned across three independently produced batches; analytical fields and images within one specimen were not treated as independent replicates.
The selected microstructural subset (LC0, LC-B10, LC-S100, and LC-H2) was pre-specified to isolate the fibre-free, basalt-only, steel-only, and hybrid states at the principal single-fibre dosages. Hydration-stopped powders were examined by XRD from 10° to 60° 2θ with Rietveld refinement, FTIR from 400 to 1,800 cm−1, and thermogravimetry from 30 to 900°C under nitrogen. Mercury intrusion porosimetry covered 0.01–100 µm. For micro-CT, 25 mm × 50 mm cores were drilled normal to sacrificial companion panels, baseline-scanned at 18 µm voxel size, subjected in an instrumented confinement fixture to one subcritical 12 J axial impact, and rescanned in the same orientation. Non-local-means filtering used radius 3 voxels; an Otsu-derived threshold was constrained to the normalised grey range 0.31–0.46 and fixed at 0.385 within each registered pair. Components <27 voxels were removed. Crack connectivity was the largest connected crack volume divided by total crack volume. Reprocessing at threshold ±5% gave coefficients of variation of 3.8% for crack volume and 2.9% for connectivity [21,22]. Polished and fracture surfaces were examined by field-emission scanning electron microscopy-energy-dispersive X-ray spectroscopy (SEM-EDS). Nanoindentation used 10 × 10 grids on three specimens per selected mixture, 25 µm spacing, 20 mN peak load, and 10 s hold. Indents centred within 50 µm of a fibre boundary were classified as fibre-ITZ; matrix indents were ≥150 µm from a fibre or pore. Invalid curves, pore hits, and boundary overlaps were excluded, leaving 286, 279, 283, and 281 valid indents for LC0, LC-B10, LC-S100, and LC-H2. Inference used specimen-level grid summaries; individual indents were descriptive subsamples.
The carbon calculation was a material-stage inventory per cubic metre of shotcrete, not a full assessment of concrete production and delivery. It included the adopted production factors for OPC, GGBFS, fly ash, sand, coarse aggregate, water, PCE, accelerator, and fibres, but excluded mixing and spraying energy. Transport embedded in the supplier and declarations and Inventory of Carbon and Energy (ICE) factors was retained; no separate project-specific transport leg was added, so constituent delivery to batching, transport of fresh shotcrete or equipment to the underground site, installation, use, repair, and end of life were outside the boundary. Factors (kg CO2e/kg) were OPC 0.820, GGBFS 0.070, fly ash 0.020, sand 0.0048, coarse aggregate 0.0052, water 0.00034, PCE 1.88, accelerator 0.62, BF 1.10, and recycled SF 0.48, compiled under EN 15804 conventions from supplier declarations and ICE v3 background data [23,24]. GGBFS and fly ash were treated as secondary co-products carrying the non-zero burdens in the adopted factors; source allocation conventions were retained without adding separate upstream ironmaking or electricity-generation burdens or avoided-burden credits. Fibre mass was V f ρ f, using 2,700 kg/m3 for basalt and 7,850 kg/m3 for steel; for example, 1.00 vol.% steel equalled 78.5 kg/m3. No avoided-burden credit beyond the recycled-steel factor was applied. The two primary outcomes were SEA at 80 s−1 and cumulative drop-weight energy to through-cracking. Restricted-maximum-likelihood mixed models used mixture (and age or rate where applicable) as fixed effects and batch nested within mixture as a random intercept; denominator degrees of freedom used Satterthwaite approximation. Estimated intraclass correlations were 0.21, 0.18, 0.14, and 0.17 for 28 days compression, flexure, SEA, and drop-weight energy. Fixed mixture effects were F(7,16) = 29.4, 112.6, 186.3, and 94.8, respectively (all p < 0.001). The 24 pre-specified contrasts were the six fibre mixtures vs LC0 for each of these four outcomes; Holm adjustment was applied within this family. Impact counts used a negative binomial generalised linear model. Hedges’ g, 95% confidence intervals, HC3 covariance, Welch tests, 10,000 label permutations, and 10,000 bias-corrected and accelerated (BCa) batch-resampling bootstrap samples provided sensitivity analyses. Synergy was Δ syn = (Y H − Y LC0) − [(Y B − Y LC0) + (Y S − Y LC0)], with null H 0: Δ syn = 0; the BCa interval resampled whole batches. The estimate can include porosity or ITZ differences and is therefore an excess-performance metric, not proof of fibre-only interaction. Fragmentation index was FI = 1 − A max/A 0 (0 = coherent; 1 = fully fragmented), obtained from calibrated overhead images using Otsu thresholding, watershed separation, and a 2 mm2 minimum fragment area; threshold ±5% gave 3.4% repeatability coefficient of variation (CV) (Figure 1).
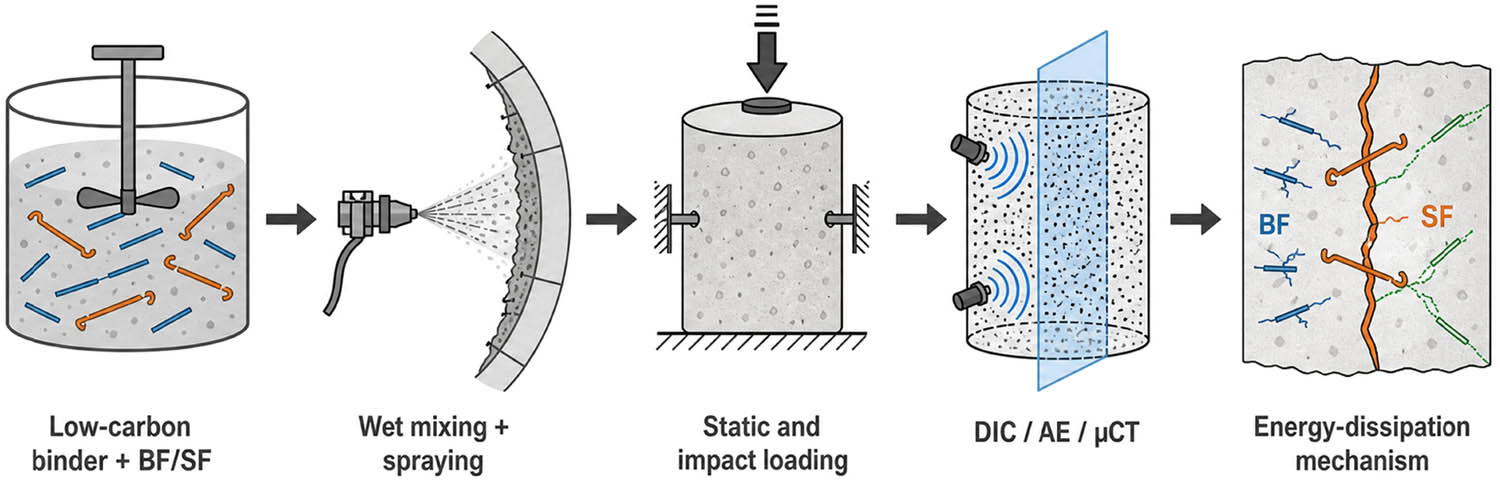
Figure 1
Experimental workflow and proposed multiscale impact-damage mechanism. The single schematic links independent batching and spraying to fresh-state, static, high-rate, repeated-impact, and microstructural measurements, followed by hierarchical statistical integration.
3. Results and discussion
The eight mixtures produced a coherent but non-monotonic performance envelope. Table 3 displays the principal results and their 95% confidence intervals, which also show substantial overlap for several neighbouring formulations. Replacing 45% of the cement reduced the 28 days compressive strength from 49.2 MPa in OC to 45.5 MPa in LC0, but the low-carbon matrix recovered strength at 90 days and reduced embodied carbon by 39.0%. Fibre reinforcement then separated peak-strength and energy responses. LC-B10 restored the 28 days strength to 51.5 MPa, whereas doubling BF to 0.20% lowered it to 48.1 MPa. SF produced larger increases, and LC-H2 reached 63.1 MPa. The contrast was much greater for energy: SEA at 80 s⁻1 rose from 0.94 MJ/m³ in LC0 to 3.05 MJ/m³ in LC-H2, while drop-weight energy rose from 0.56 to 2.31 kJ. Thus, the ranking based on compressive strength alone would have understated the benefit of hybrid crack bridging.
Table 3
Key performance results.
| Mix | 28 days compressive strength (MPa; model 95% CI) | Flexural strength (MPa; model 95% CI) | SEA at 80 s−1 (MJ/m³; model 95% CI) | Drop-weight energy (kJ; model 95% CI) | Embodied carbon (kg CO₂e/m3) | Reduction vs OC (%) |
|---|---|---|---|---|---|---|
| OC | 49.2 (47.1–51.3) | 5.24 (4.92–5.56) | 1.08 (1.00–1.16) | 0.55 (0.47–0.64) | 424.5 | 0.0 |
| LC0 | 45.5 (42.5–48.5) | 5.06 (4.83–5.28) | 0.94 (0.80–1.08) | 0.56 (0.53–0.60) | 258.9 | 39.0 |
| LC-B10 | 51.5 (48.7–54.3) | 5.85 (5.60–6.11) | 1.33 (1.26–1.41) | 0.82 (0.71–0.92) | 261.9 | 38.3 |
| LC-B20 | 48.1 (46.3–50.0) | 5.37 (5.13–5.61) | 1.47 (1.37–1.57) | 0.74 (0.66–0.81) | 264.9 | 37.6 |
| LC-S50 | 50.5 (47.4–53.5) | 7.15 (6.78–7.52) | 1.76 (1.65–1.87) | 1.16 (1.05–1.28) | 277.8 | 34.6 |
| LC-S100 | 59.1 (56.2–61.9) | 8.17 (7.42–8.92) | 2.18 (2.01–2.34) | 1.58 (1.48–1.68) | 296.6 | 30.1 |
| LC-H1 | 59.0 (56.6–61.4) | 8.62 (8.21–9.02) | 2.71 (2.53–2.88) | 1.87 (1.77–1.97) | 280.7 | 33.9 |
| LC-H2 | 63.1 (60.2–65.9) | 9.90 (9.47–10.33) | 3.05 (2.80–3.30) | 2.31 (2.19–2.44) | 299.6 | 29.4 |
Mechanical and impact values are hierarchical-model estimated marginal mean values with 95% confidence intervals (n = 9 specimens across three independent batches); embodied carbon is the deterministic material-stage mixture inventory and reduction is relative to OC.
The phase and pore measurements explain why the low-carbon matrix lost modest early strength without becoming intrinsically weak. In Figure 2a, LC0 and LC-H2 retained lower portlandite-associated intensity than OC and showed a broader amorphous contribution, consistent with continuing slag and fly-ash reaction. The TGA and derivative curves in Figure 2b gave lower portlandite-related mass loss for low-carbon mixtures but comparable bound-water loss after 28 days. The main Si–O stretching band shifted by approximately 9–18 cm⁻1 in Figure 2c, indicating polymerisation of calcium-aluminosilicate hydrate. Basalt fibre recycled-concrete research similarly connects continued secondary reaction with a denser paste around well-dispersed filaments [25]. Work on basalt fibre reactive powder concrete reports an optimum rather than unlimited dosage because fibre bundles can counteract matrix densification [26]. The present LC-B20 response follows that pattern: its capillary-pore fraction was 40.5%, compared with 31.1% in LC-B10, even though both contained the same binder.
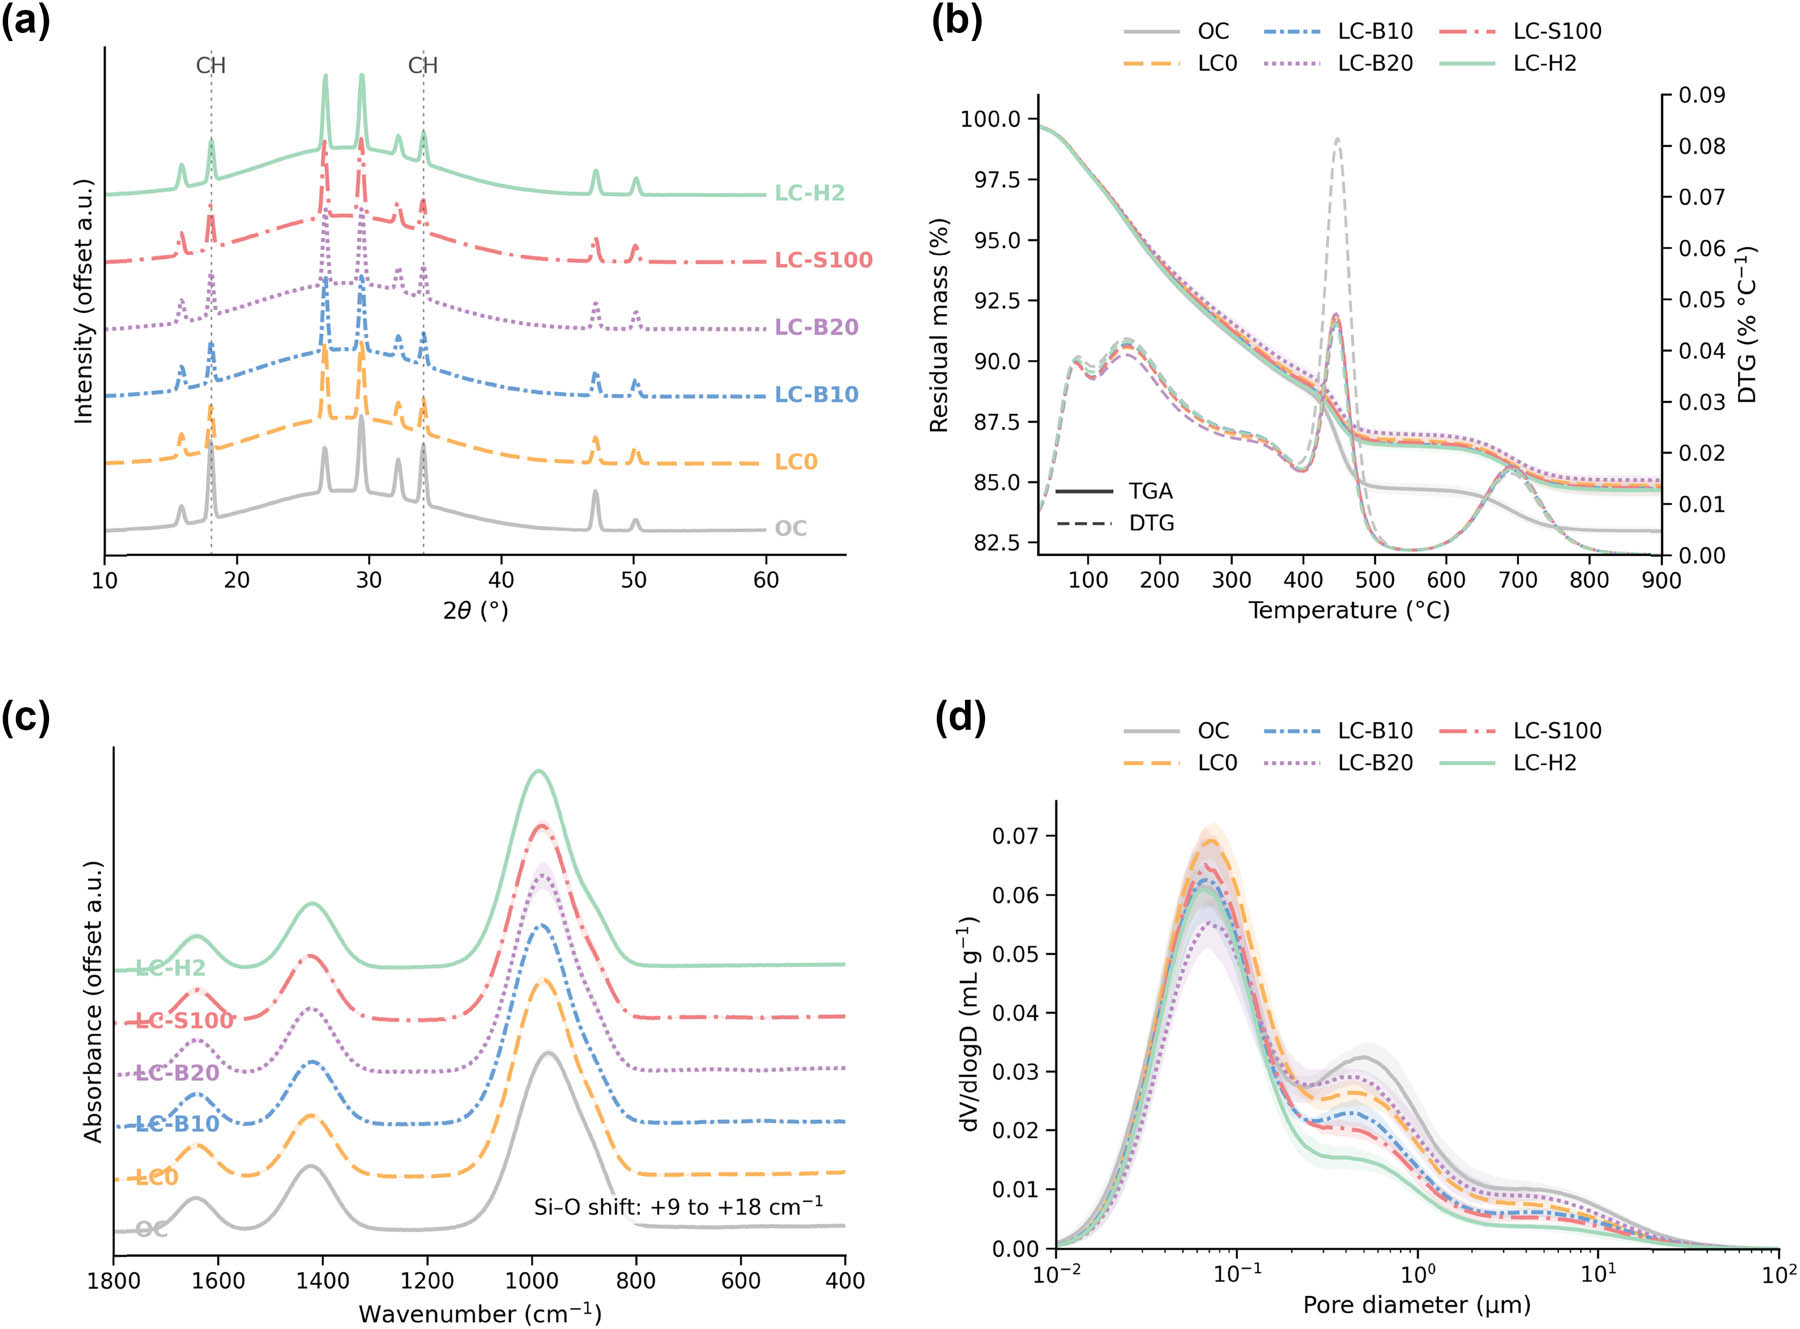
Figure 2
Hydration products and pore structure at 28 days. (a) XRD patterns with principal crystalline reflections; (b) paired TGA residual-mass curves and dashed DTG rates; (c) FTIR spectra in the Si–O stretching region; (d) normalised mercury-intrusion distributions over pore diameter. Curves are representative of three independently batched specimens per mixture (n = 3).
The fibre surface altered this matrix response locally. SEM fields showed reaction products attached to rough basalt filaments in LC-B10, while smooth or clustered segments in LC-B20 were bordered by narrow voids. Surface-modification experiments have demonstrated that the chemical and topographic state of BF changes interfacial adhesion and transfers directly to composite strength [27]. Here, the mean nanoindentation modulus increased from 25.3 GPa in LC0 to 28.4 GPa in LC-B10 but fell to approximately 27.0 GPa in LC-B20. This difference cannot be explained by bulk hydration alone because the two mixtures shared identical powder proportions. Instead, additional filament surface at 0.20% increased water demand and the probability of touching fibres. The intrusion size distributions in Figure 2d therefore represent a competition between crack-arresting inclusions and mixing-induced defects. Hybridisation resolved part of that competition: LC-H2 reached 33.9 GPa while retaining the lowest measured porosity, 10.7%.
Fresh-state measurements imposed a practical upper boundary on fibre content. Slump decreased from 206.4 mm for OC and 188.8 mm for LC0 to 181.2 and 164.6 mm for LC-B10 and LC-B20, respectively. SFs reduced slump to 176.9 mm at 0.50% and 146.8 mm at 1.00%; LC-H2 reached 133.9 mm. Air content simultaneously increased from 3.62% in LC0 to 4.78% in LC-H2. These changes were not treated as incidental because nozzle flow determines in-place fibre orientation and compaction. The low-rebound accelerator literature shows that accelerator chemistry and mixture cohesion jointly control rebound rather than accelerator dosage alone [28]. With the accelerator held constant, rebound decreased from 13.3% in OC to 12.1% in LC0 and 6.21% in LC-H2, as shown in Figure 3a. Steel hooks and the hybrid fibre network retained coarse particles at impact, even as their drag reduced slump.
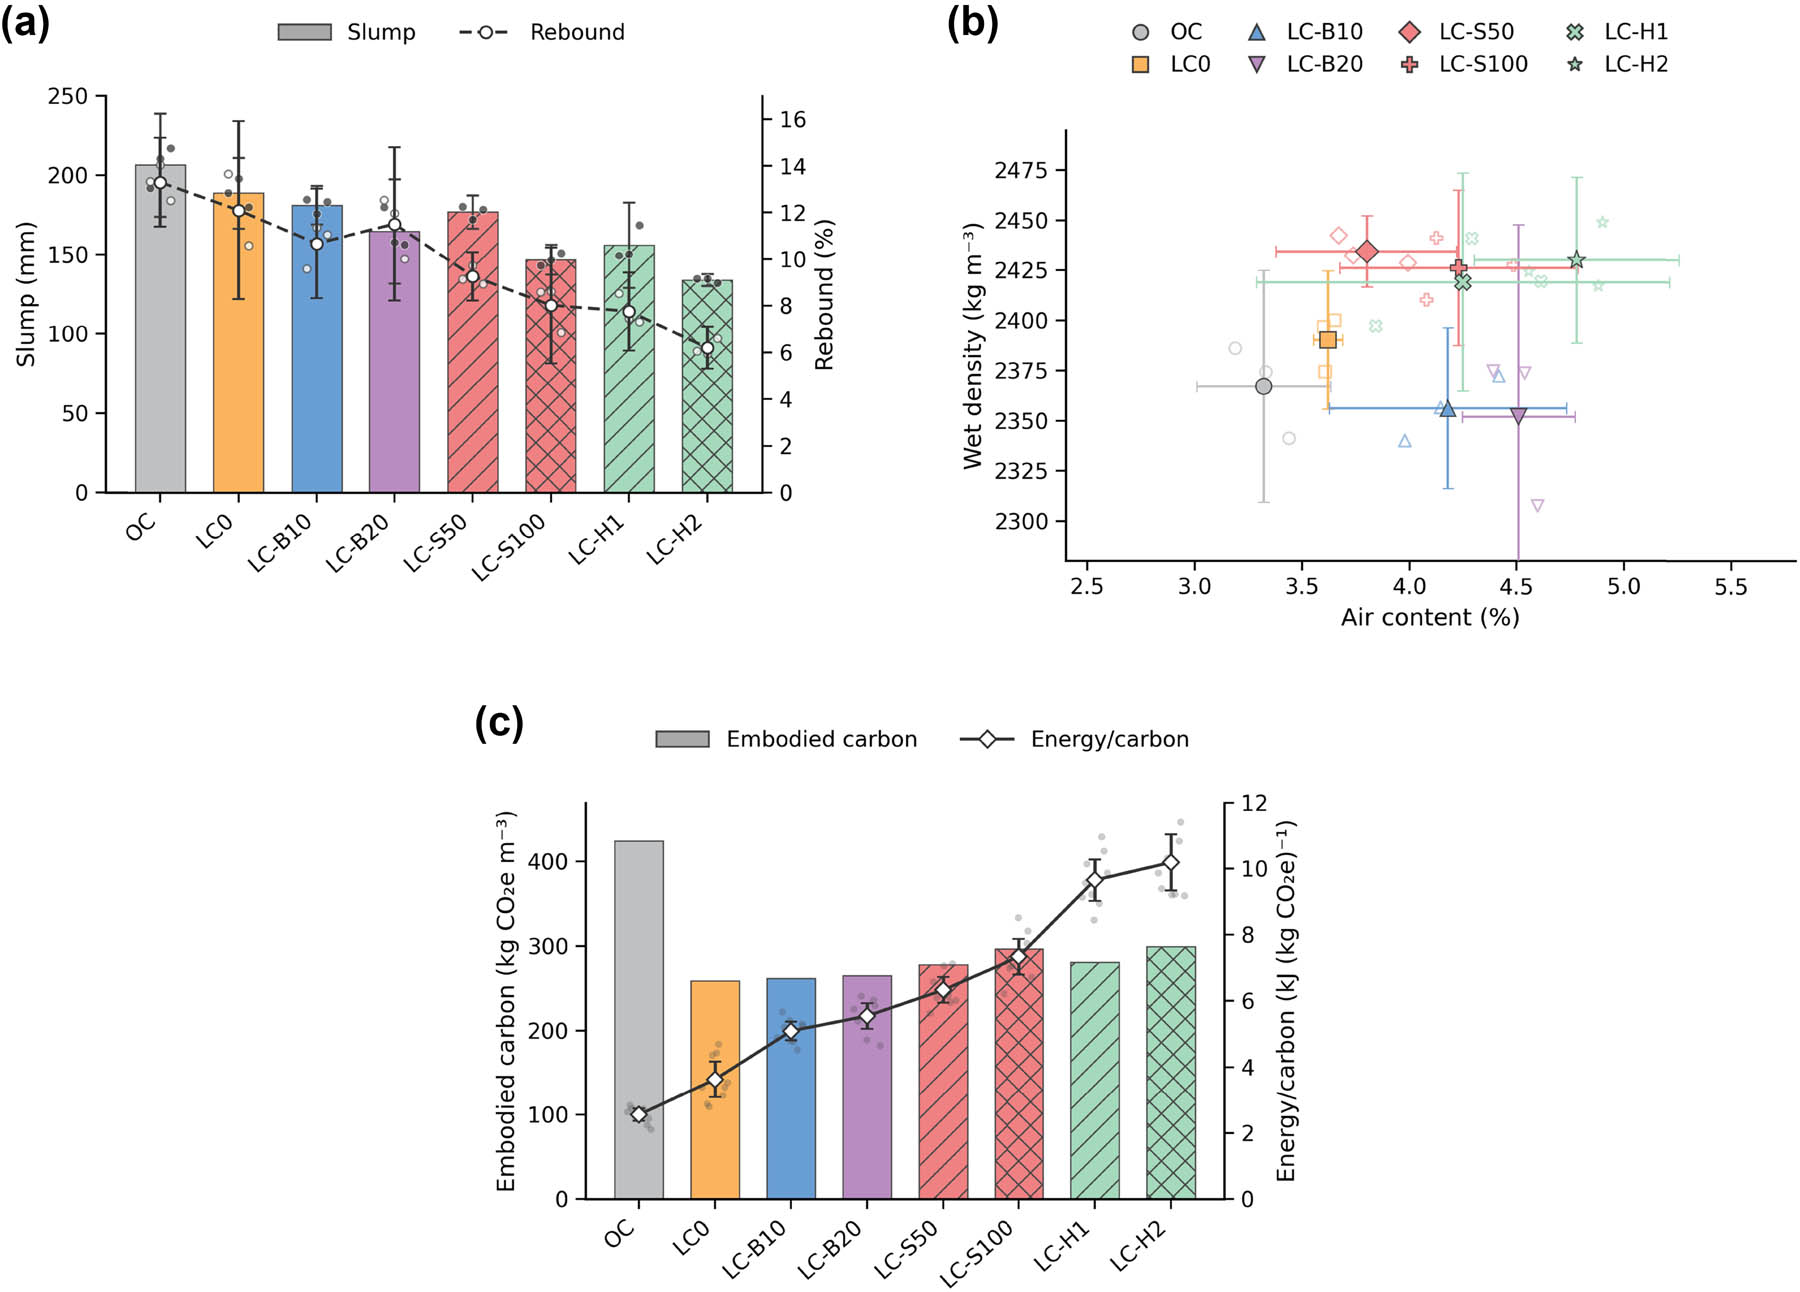
Figure 3
Fresh-state performance and carbon efficiency. (a) Slump bars and rebound curves with mean value ±95% CI; (b) mean air content plotted against mean wet density; (c) material-stage embodied carbon and SEA per unit carbon. Fresh-state summaries represent three independent batches per mixture (n = 3).
The air–density relation in Figure 3b distinguishes basalt and steel effects. BF raised entrapped air and slightly lowered wet density; SF increased density despite a small air rise because its mass dominated. LC-B20 combined 4.51% air with 2,352 kg/m3 wet density and therefore carried a higher risk of fibre-rich pockets than LC-B10. LC-H2 was successfully delivered and sprayed under the fixed robotic programme, but its 134 mm slump cannot establish pumpability. Pump pressure, yield stress, plastic viscosity, blockage, fibre filtering, build-up, adhesion, hose length, temperature, and accelerator compatibility were not measured. Slag–fly-ash systems can mitigate autogenous shrinkage [29], but that benefit does not validate field delivery. LC-H2 is therefore described only as sprayable under the tested setup; full-scale pumping and nozzle trials are required before application-specific acceptance.
Carbon results in Figure 3c demonstrate why the high steel dosage did not erase the binder benefit. OC embodied 424.5 kg CO₂e/m³, whereas LC0 embodied 258.9 kg CO₂e/m³. Addition of basalt resulted in a small change in that value: LC-B10 and LC-B20 remained 38.3% and 37.6% below OC. Recycled steel increased LC-S100 and LC-H2 to 296.6 and 299.6 kg CO₂e/m³, but the reductions relative to OC were still 30.1% and 29.4%. The energy-to-carbon index rose from 3.63 to 10.18 kJ/kg CO₂e between LC0 and LC-H2 because the 15.7% carbon increase within the low-carbon family accompanied a 225% increase in specific energy. This comparison does not imply that more steel always reduces life-cycle impact. It shows that a functional unit based only on one cubic metre penalises fibre additions without crediting retained lining capacity. A service-based assessment should include reduced repair, mesh replacement, and rockfall interruption, which were outside the present boundary.
Static strength developed differently with age. Figure 4a shows that OC had the highest 7 days strength among the fibre-free matrices because its clinker fraction reacted rapidly. LC0 was 7.4% lower at 28 days, but its 90 days gain was 21.0%, compared with 18.1% for OC. The mixed-effects model confirmed a mix-by-age interaction (p < 0.001), and the HC3 sensitivity model retained the same direction after the compressive residuals showed mild non-normality (Shapiro–Wilk p = 0.039). LC-B10 increased 28 days strength by 5.96 MPa over LC0 (Hedges’ g = 1.51; Holm-adjusted p = 0.012). LC-B20 increased it by only 2.63 MPa (g = 0.77; adjusted p = 0.110), so its interval included no reliable improvement. The contrast between those basalt dosages agrees with the pore and fresh-state evidence: microcrack restraint improved apparent capacity at 0.10%, whereas extra air and bundling consumed much of the benefit at 0.20%.
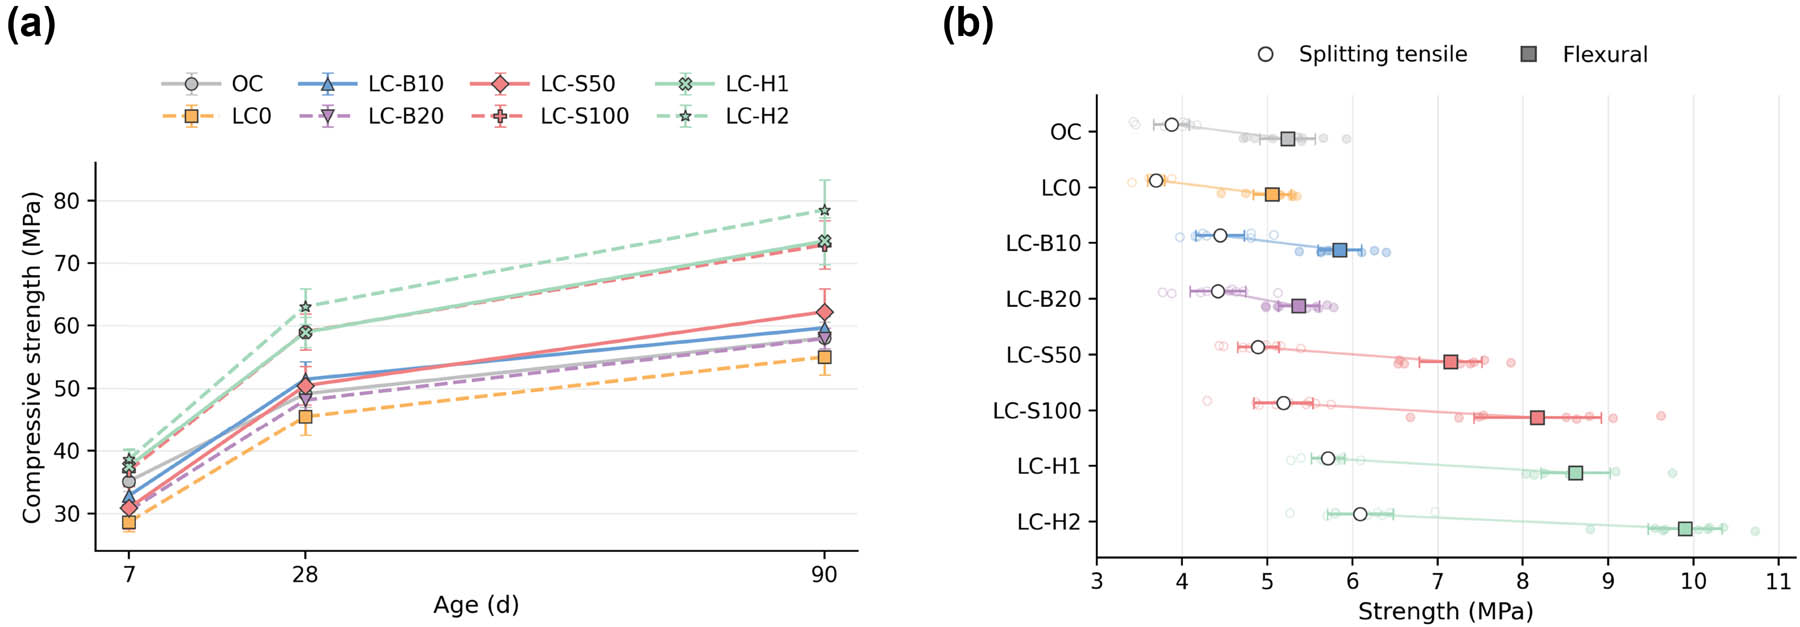
Figure 4
Quasi-static mechanical performance. (a) Compressive-strength development at 7, 28, and 90 days; (b) 28 days splitting tensile and flexural strengths. Error bars are 95% CI from nine specimens distributed across three batches.
Steel and hybrid fibres produced progressively greater strength after the matrix had developed sufficient bond. The dataset in Table 3 was rechecked and is used consistently here: LC-S50 and LC-S100 reached 50.5 and 59.1 MPa at 28 days, while LC-H1 and LC-H2 reached 59.0 and 63.1 MPa. The hybrid advantage is consistent with delayed splitting and more distributed pre-peak cracking, but the present measurements do not isolate fibre confinement from matrix and orientation effects. Studies of steel–basalt concrete under compression likewise report that fibre interaction is most visible in strain capacity and damage pattern, while peak stress depends on workability and interface quality [6]. LC-H2 exceeded OC by 28.3% despite 45% supplementary cementitious material in its binder.
Tensile and flexural responses separated the mixtures more clearly than compression. Figure 4b shows splitting strengths of 3.69 MPa for LC0, 4.45 MPa for LC-B10, 5.19 MPa for LC-S100, and 6.09 MPa for LC-H2. Flexural strength followed the same ordering but with a wider range, increasing from 5.06 to 9.90 MPa between LC0 and LC-H2. The fine basalt filaments intercepted cracks before they formed a single fracture plane, while the hooked SFs carried load after local matrix separation. Published steel-basalt flexural observations identify the same division of labour between small and large cracks [7]. The 0.02 MPa difference between LC-B10 and LC-B20 in splitting strength, despite the higher filament count in LC-B20, again indicates that effective spacing matters more than nominal fibre volume once clustering begins.
The load–CMOD curves in Figure 5a reveal the mechanical consequence of that division. LC0 reached its peak near 0.12 mm and then lost most load within the first millimetre. LC-B10 softened more gradually but retained limited load beyond 2 mm because straight, fine filaments either ruptured or pulled out over short embedment lengths. LC-S100 showed a lower initial slope than the densest hybrid but carried a pronounced post-peak tail. LC-H2 combined the largest peak with the slowest decay. Its residual flexural strength averaged 7.41 MPa, compared with 1.84 MPa for LC0. This retained capacity is more relevant to a cracked roadway lining than the uncracked peak because convergence and local rock detachment continue after initial cracking.
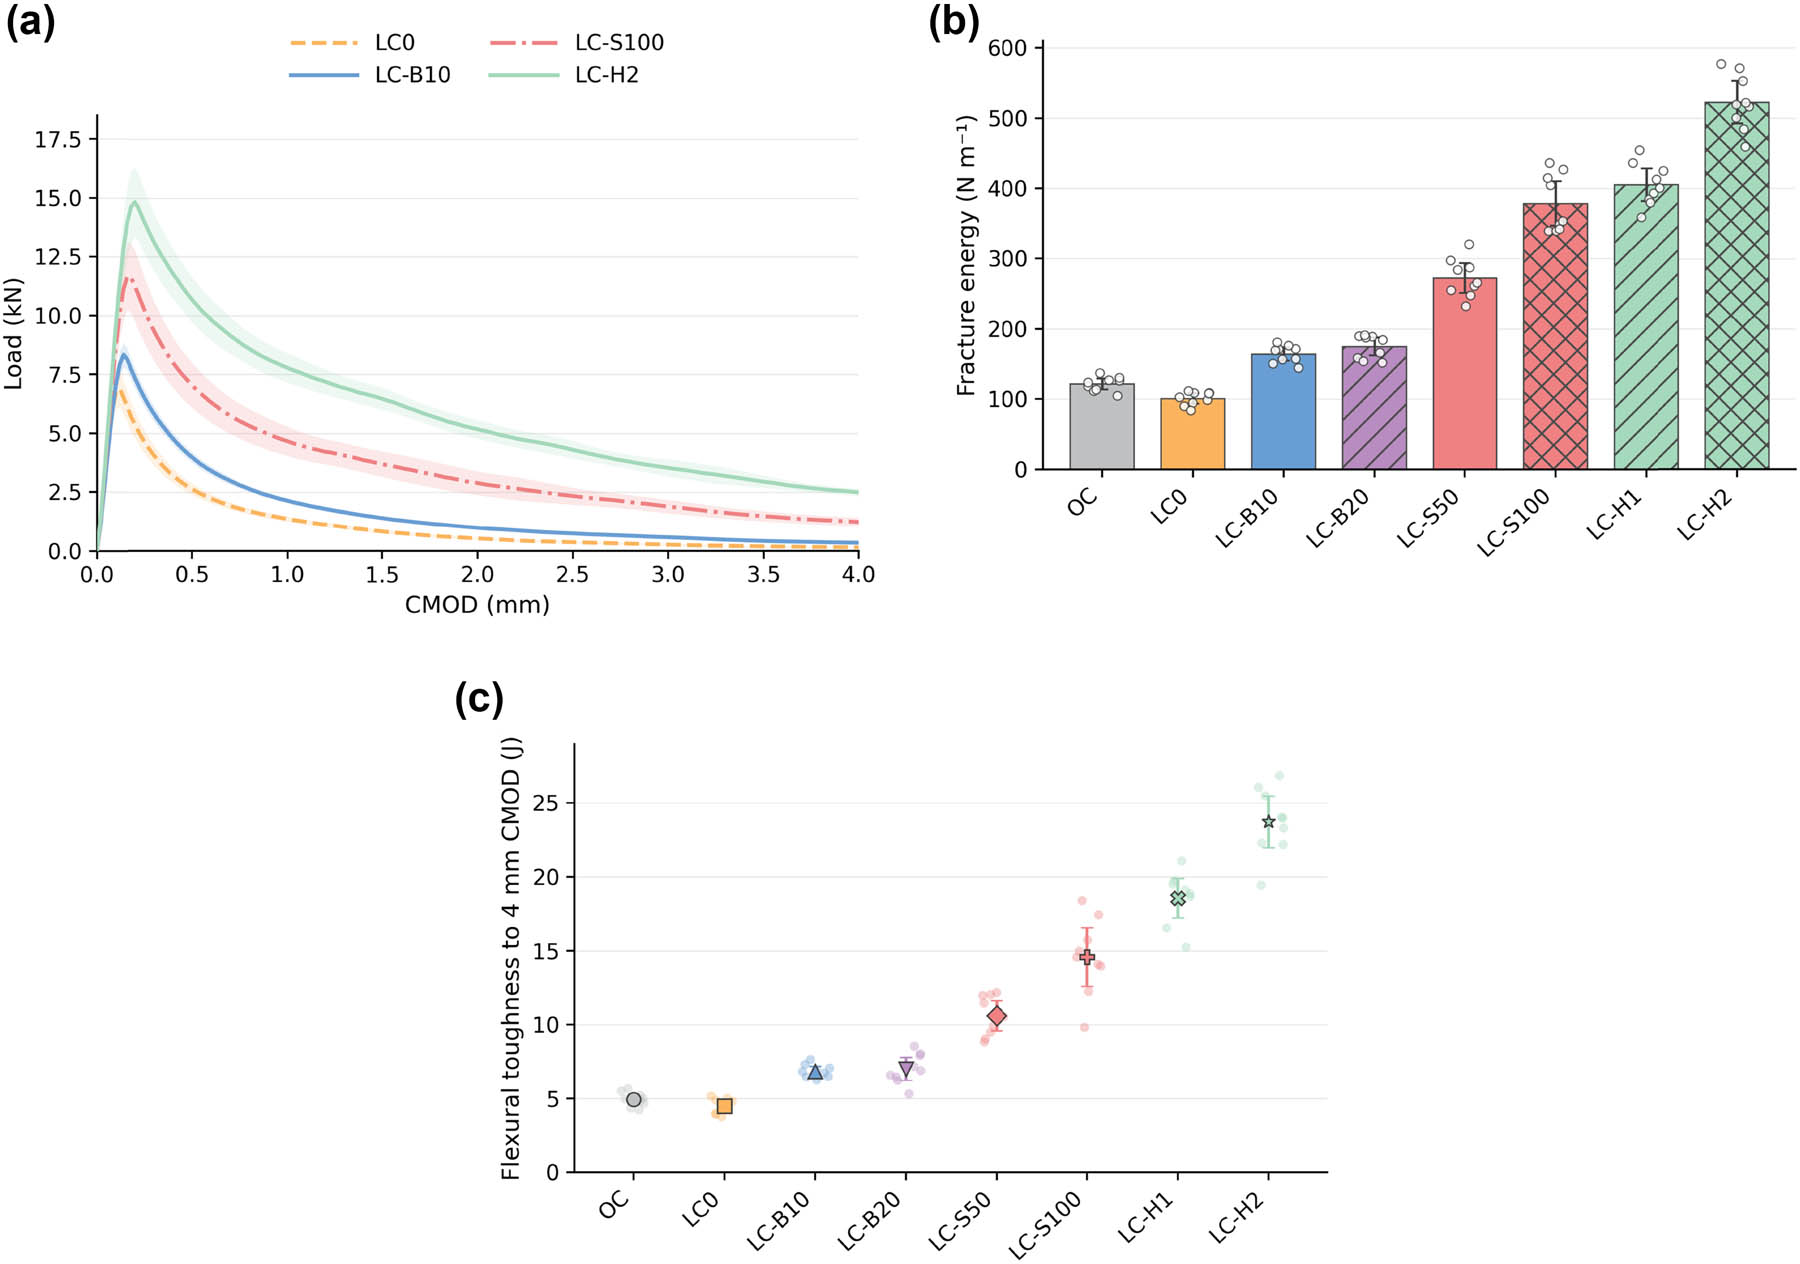
Figure 5
Flexural fracture response. (a) Representative load–CMOD curves; (b) fracture energy; (c) toughness integrated to 4 mm CMOD. Bars and points show specimen observations and 95% CI (n = 9).
Fracture energy G F, normalised by the 75 mm ligament, increased from 101 N/m in LC0 to 164 N/m in LC-B10, 379 N/m in LC-S100, 405 N/m in LC-H1, and 523 N/m in LC-H2 (Figure 5b). Brown–Forsythe test detected unequal variances (p = 0.0087); the Welch sensitivity test retained a mixture effect (p < 0.001). The LC-H2–LC0 planned contrast was 422 N/m. Flexural toughness T 4, the non-normalised work to 4 mm CMOD after self-weight correction, followed the same ranking and reached 23.7 J in LC-H2 (Figure 5c). The coefficient of variation was 10.9% for LC-S100 fracture energy, reflecting the number and orientation of fibres crossing the notch. Inference retained specimens within independent batches rather than treating fibres or image fields as replicates.
The higher toughness at 0.20% BF than at 0.10%, despite lower flexural strength, is an important non-monotonic result. LC-B20 contained more filaments capable of dissipating small amounts of pull-out energy, so its fracture energy reached 175 N/m, 6.3% above LC-B10. Its flexural strength, however, was 8.2% lower, reflecting defects introduced before loading. The mixture therefore shifted energy from matrix fracture to many low-force pull-outs without improving overall load capacity. Multiscale hybrid fibre theory predicts this separation between crack density and peak stress when reinforcement length scales overlap imperfectly [9]. In LC-H2, SFs supplied the high-force tail that BFs alone lacked. The practical implication is that a designer cannot select basalt dosage from strength or toughness in isolation; the dosage must be tied to the required deformation window and spraying tolerance.
High-rate compression amplified mixture differences. At 80 s−1, dynamic strengths were 88.5 MPa for OC, 75.1 MPa for LC0, 97.1 MPa for LC-B10, 116.7 MPa for LC-S100, and 134.7 MPa for LC-H2. Figure 6a shows that LC-H2 also reached a higher peak strain and retained more post-peak stress than the single-fibre mixtures. Earlier hybrid fibre SHPB work demonstrated rate-dependent toughness and informed this comparison [10]. Basalt–polyethylene and basalt–sisal systems likewise show greater dynamic toughness when multiple crack-bridging scales are present [30,31]. For the present steel–basalt system, the curve shapes and retained fragments are consistent with hooked-steel resistance after distributed cracking, but they do not directly resolve the activation time of individual fibres.
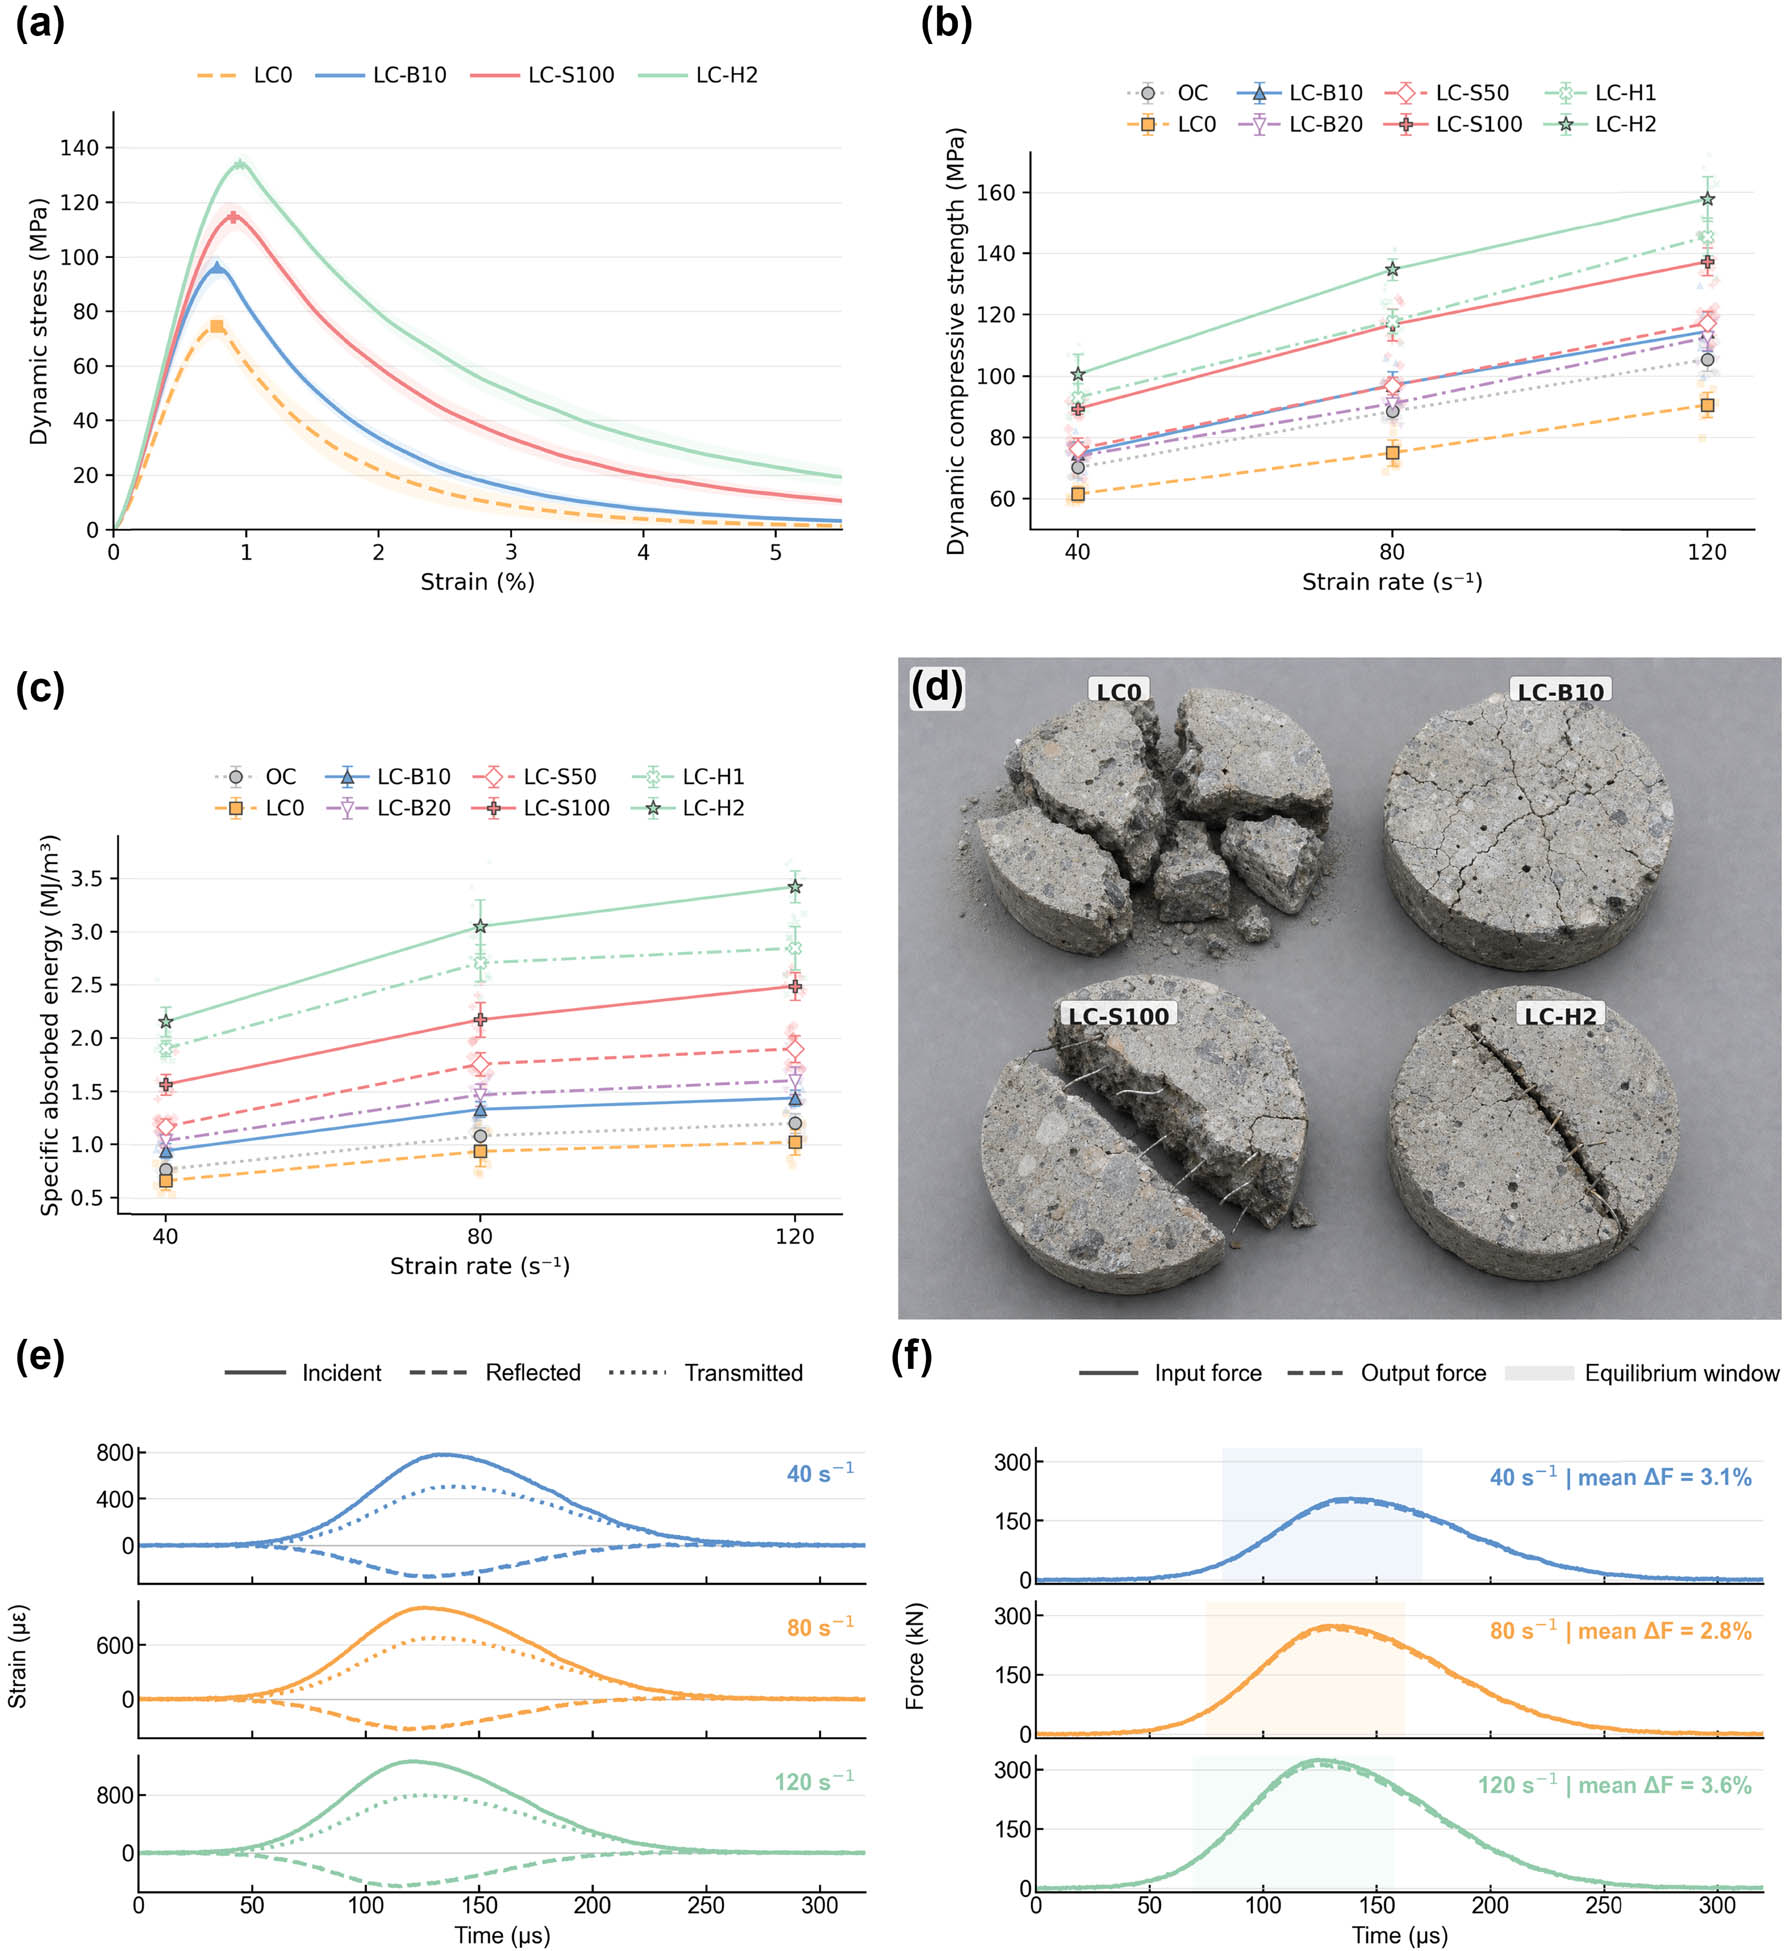
Figure 6
SHPB response and failure morphology. (a) Representative dynamic stress–strain curves at 80 s−1; (b) dynamic compressive strength vs strain rate; (c) SEA vs strain rate; (d) post-impact failure maps at 80 s−1; (e) representative incident, reflected, and transmitted strain waves at 40, 80, and 120 s−1; (f) corresponding input and output force-equilibrium histories. Error bars are hierarchical-model 95% CI (n = 9 specimens per mixture and rate across three batches); maps use a common damage scale.
Dynamic strength rose with strain rate for every mixture (Figure 6b). LC0 increased from 61.5 MPa at 40 s−1 to 90.6 MPa at 120 s−1, whereas LC-H2 increased from 100.6 to 157.8 MPa. Representative incident, reflected, and transmitted waves and the corresponding force-equilibrium histories for all three rate bands are shown in Figure 6e and f. Some apparent rate enhancement can arise from radial inertia and stress non-uniformity [32]. Pulse shaping and the 5% equilibrium rule limited that bias, but the 25 mm thickness was only 2.5 times the 10 mm maximum aggregate size. Companion quasi-static discs removed the former geometry mismatch in the DIF denominator, yet local aggregate arrangement and boundary confinement remain influential. Published rate and size-effect studies support comparing these DIFs only within the present 50 mm × 25 mm configuration [33,34].
The mixed model detected mix, strain-rate, and mix-by-rate effects (all p < 0.001); the mixture effect for SEA at 80 s−1 was F(7,16) = 186.3 with batch ICC = 0.14. A synthesis of concrete SHPB evidence likewise treats rate as a governing variable [35]. The interaction arose because the LC-H2–LC0 dynamic-strength difference increased from 39.1 MPa at 40 s−1 to 67.1 MPa at 120 s−1. This rate-dependent separation is consistent with more simultaneously active crack planes, but radial inertia and the small aggregate-to-specimen ratio prevent attributing the entire interaction to material kinetics.
SEA was the more discriminating primary outcome. At 80 s−1, LC-B10 and LC-B20 reached 1.33 and 1.47 MJ/m3, LC-S50 and LC-S100 reached 1.76 and 2.18 MJ/m3, and LC-H1 and LC-H2 reached 2.71 and 3.05 MJ/m3 (Figure 6c). All six fibre-mixture contrasts with LC0 remained significant after Holm adjustment; the LC-H2–LC0 difference was 2.11 MJ/m3 (permutation p < 0.0001). Rate-sensitive specific-energy gains have also been reported for polypropylene–basalt hybrids [36]. Using the pre-specified equation, LC-H2 gave Δ syn = 0.48 MJ/m3 with a batch-resampled BCa 95% interval of 0.22–0.76 MJ/m3. The interval excludes zero, but the estimate may partly reflect the lower porosity and stiffer ITZ of LC-H2; it is therefore reported as excess performance compatible with fibre interaction, not as an isolated causal effect.
Failure images in Figure 6d support the energy statistics. LC0 fragmented along connected radial and axial planes, LC-B10 displayed more numerous but shorter cracks, LC-S100 retained large fragments linked by protruding fibres, and LC-H2 remained a coherent disc with narrow subsidiary cracks. The calibrated fragmentation index decreased from 0.907 in LC0 to 0.568 in LC-H2 at 80 s−1. This confirms that the integrated response co-varied with retained coherence, while the signal rules in Section 2 limited contributions from unloading oscillation. The slightly higher LC-B20 than LC-B10 SEA is consistent with distributed microcracking, but steel was required for the long post-peak bridging tail.
Repeated drop-weight impact reproduced the same ranking at panel scale. The first force peak occurred near 1.8 ms for all panels (Figure 7a). Peak force increased from 46.8 kN in LC0 to 53.5 kN in LC-B10, 65.7 kN in LC-S100, and 83.6 kN in LC-H2. Cumulative integration of each complete force–displacement loop through the terminal blow gave 0.56, 0.82, 1.58, and 2.31 kJ, respectively (Figure 7b). Relative to 0.245 kJ theoretical energy per blow, individual measured absorption represented 42–74%; the remainder was associated with tup rebound, support motion, vibration, and inertia. Hybrid fibre drop-weight studies also report increased first-crack resistance and cumulative energy [37].
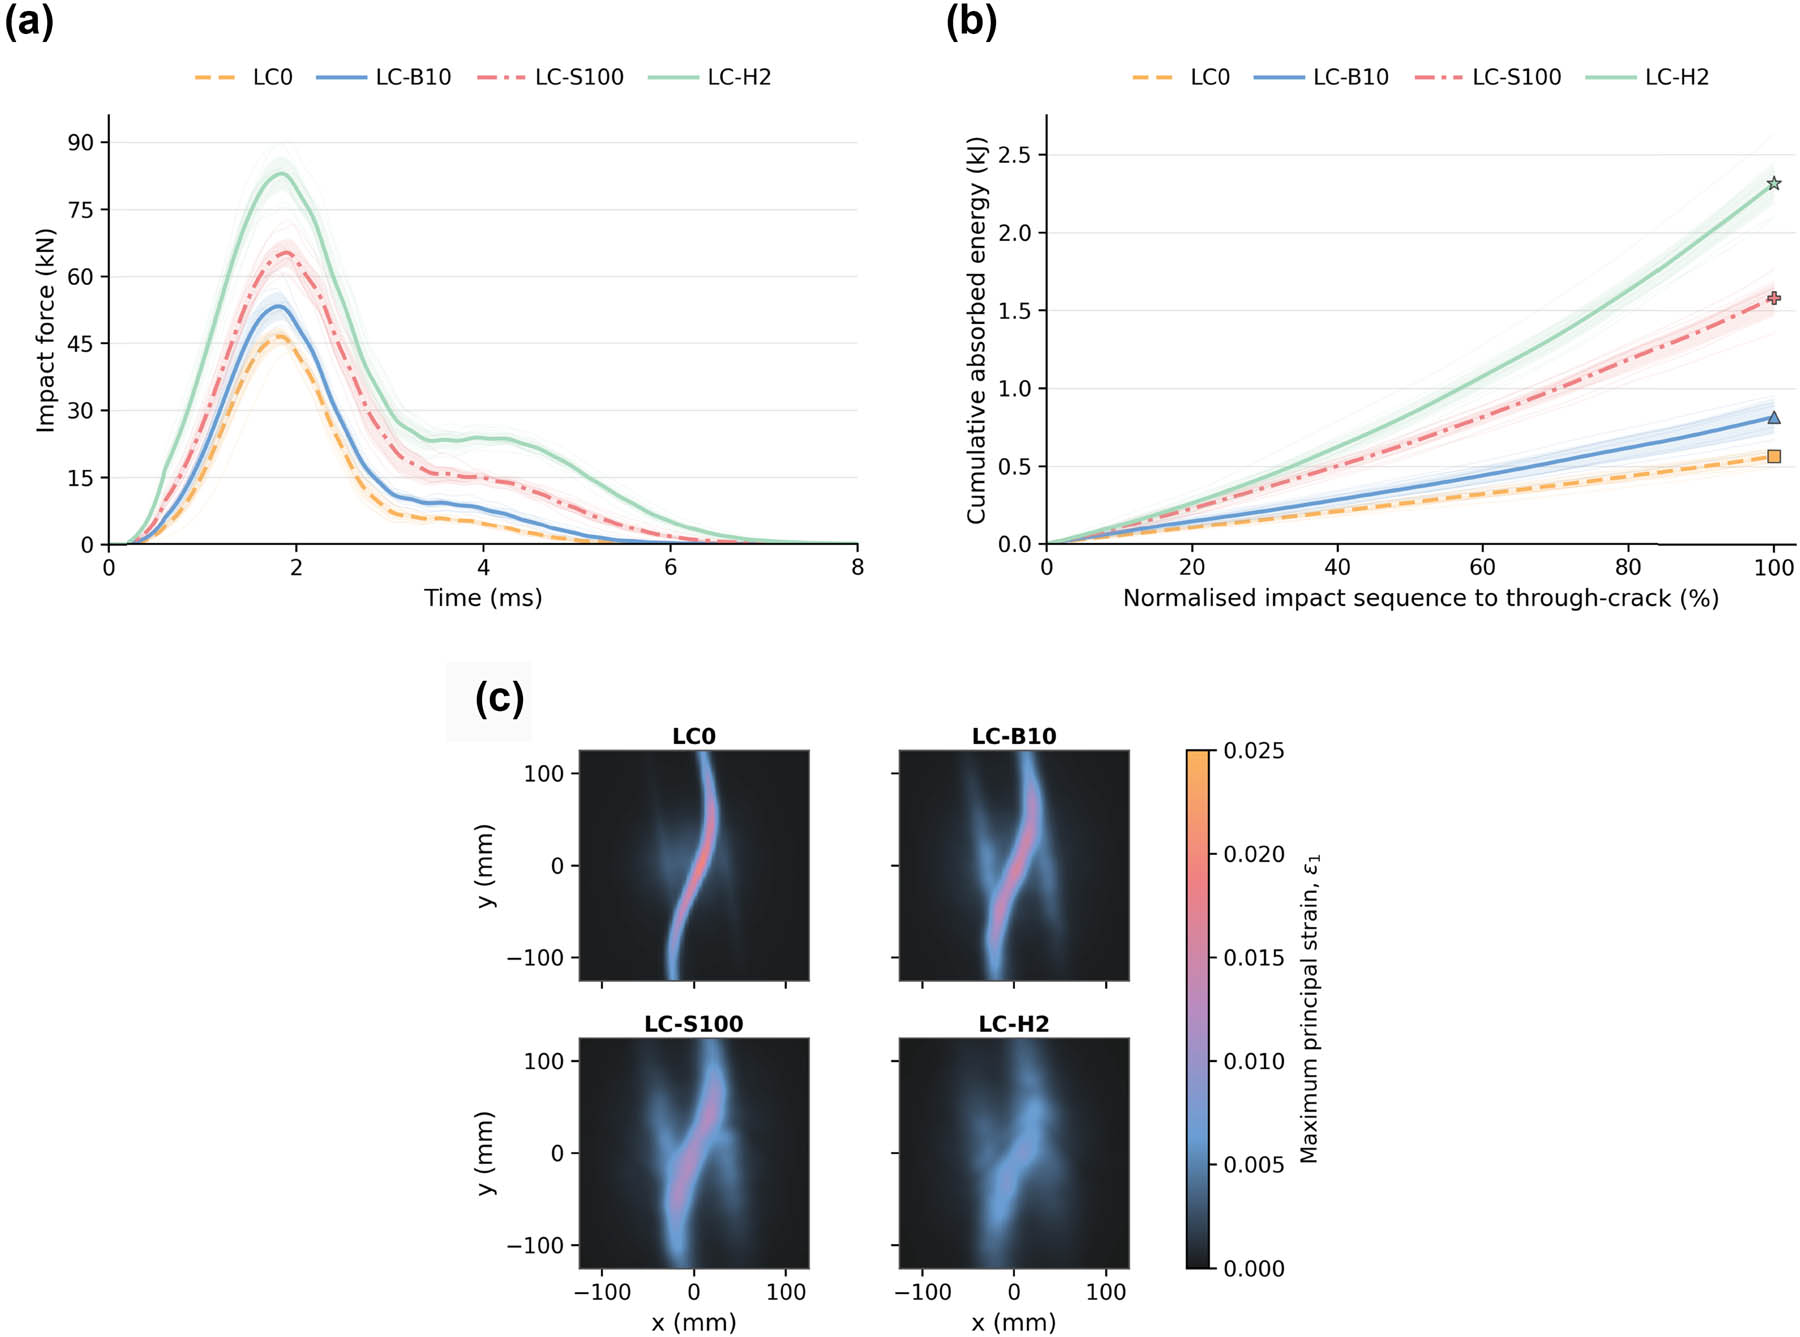
Figure 7
Instrumented drop-weight response and full-field deformation. (a) Representative force–time histories; (b) cumulative absorbed-energy histories; (c) DIC maximum-principal-strain fields near peak response. Summary values derive from nine panels per mix across three batches.
Impact counts were overdispersed, validating the negative binomial rather than Poisson model. LC0 formed a through-crack after a mean of 3.1 blows; LC-B10 required 4.9, whereas LC-S100 and LC-H1 both averaged 15.3 and LC-H2 averaged 20.2 blows. Individual LC-H2 panels nevertheless failed between 7 and 38 blows, overlapping the 6–25-blow LC-H1 range. Count variability was wider than energy variability because a visible through-crack depends on the chance alignment of fibres under the impact point. Studies that combine basalt and macro-polypropylene fibres also find that repeated-impact life is more variable than first-blow strength, even when the mean benefit is clear [38]. The negative binomial model retained a strong mixture effect, and the energy endpoint provided a more stable continuous measure for ranking.
DIC resolved a wider, less intense strain field in LC-H2 without a proportionally higher force peak. Mean maximum principal strain decreased from 0.020 in LC0 to 0.016 in LC-B10, 0.012 in LC-S100, and 0.008 in LC-H2 (Figure 7c). The broad pre-localisation field and low final maximum are consistent with the proposed sequence of basalt-assisted microcrack restraint followed by steel bridging. Because DIC observes a surface field and does not track individual fibre forces, it cannot by itself demonstrate the timing of each fibre population.
The drop-weight excess was Δ syn = 0.48 kJ (BCa 95% interval 0.32–0.64 kJ; permutation p < 0.0001). This contrast tests whether the LC-H2 improvement over LC0 exceeded the summed LC-B10 and LC-S100 improvements. Its positive value coincided with lower CT crack connectivity and a stiffer fibre-adjacent region, but those matrix and interface differences may also contribute to the excess. The result therefore supports, rather than proves, a fibre-interaction mechanism in which distributed cracking increases the opportunity for steel hooks to bridge a developing fracture zone.
AE provided an independent time history of this transition. Cumulative AE energy in Figure 8a rose slowly during initial contact, accelerated as distributed cracks formed, and steepened near macrocrack propagation. LC0 released 51.9 mJ on average and reached its steep segment early. LC-B10 accumulated 75.5 mJ through more numerous small events. LC-S100 and LC-H2 accumulated 121 and 174 mJ, respectively, but their steepest rise occurred later in normalised time. In direct-tension concrete tests, coupled AE and DIC have shown that the first sustained AE acceleration precedes visible localisation [39]. This same sequence occurred here: the hybrid mixtures sustained distributed AE activity before a localized DIC band formed.
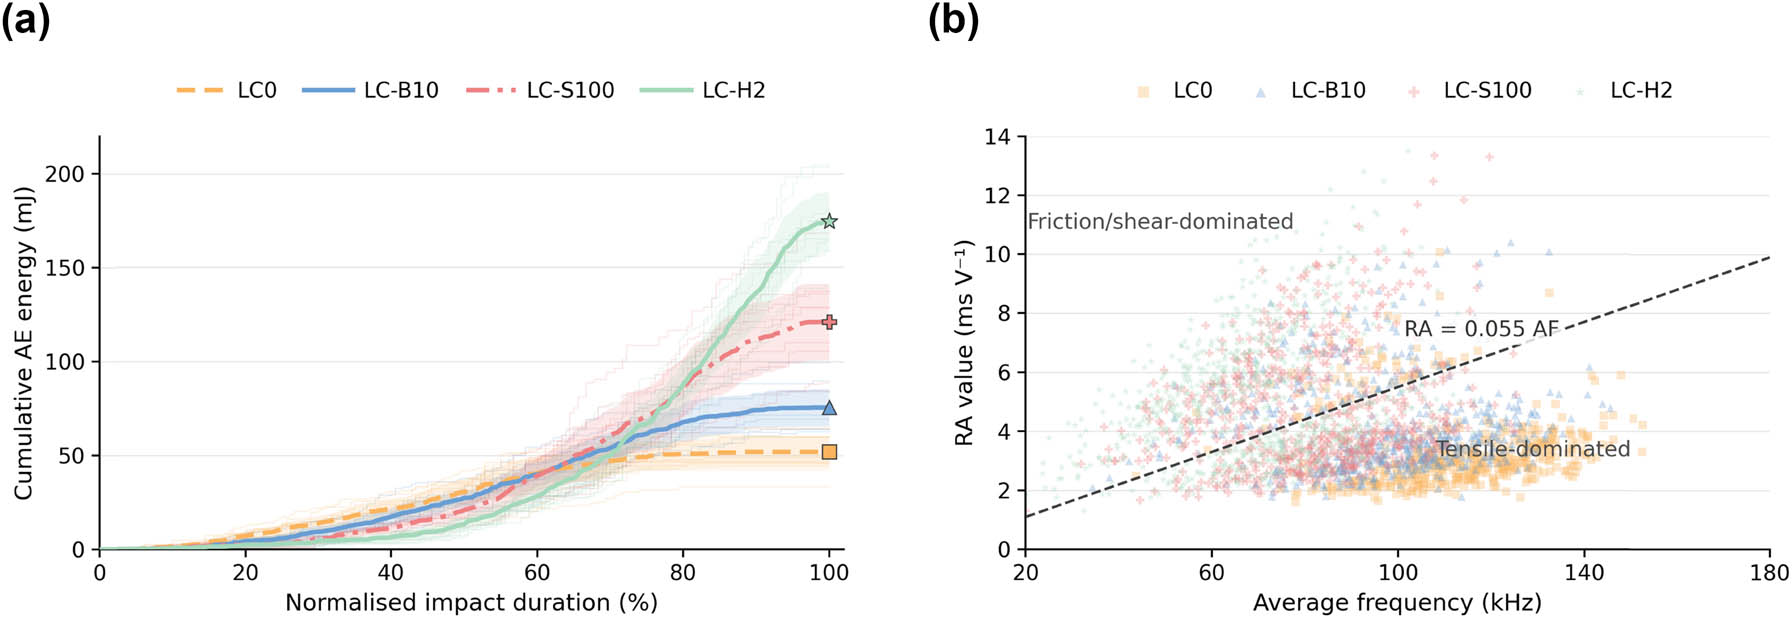
Figure 8
AE evolution during drop-weight impact. (a) Cumulative AE energy normalised by impact duration; (b) RA vs average frequency distributions identifying tensile-dominated and frictional or shear-dominated activity. Each mixture combines nine panels; trend curves are descriptive, whereas inferential tests use panel-level outcomes.
The rise-time/amplitude (RA)–average-frequency plot in Figure 8b separated tensile-dominated and shear or friction-dominated signals using a descriptive 0.055 ms V⁻1 kHz⁻1 boundary. LC0 events clustered at higher average frequency and lower RA, consistent with abrupt tensile cracking. Steel-rich mixtures shifted part of the population toward higher RA because debonding and pull-out produced longer rise times. Large wedge-splitting tests monitored by AE and DIC show a similar transition as the fracture process zone evolves from diffuse microcracking to frictional macrocrack growth [40]. Rubberised self-compacting concrete studies also demonstrate that AE and DIC remain complementary: DIC locates surface strain, while AE detects internal events before they reach the observed face [41]. Agreement between the two techniques here reduces the likelihood that the apparent delay in LC-H2 was a surface-only effect.
The AE increase should not be read as greater damage in the hybrid. Event energy records irreversible work, including useful fibre debonding and pull-out. LC-H2 produced more acoustic energy while retaining a smaller final crack network because much of the work occurred at numerous controlled interfaces. LC0 produced fewer measured events but connected them rapidly into a through-crack. This distinction matters for field monitoring. A simple alarm based on cumulative hits could rank a tough fibre lining as more damaged than a brittle plain lining. More informative indicators would combine rate changes, RA-frequency evolution, spatial clustering, and convergence measurements. The laboratory data provide such mechanistic signatures but do not yet define field alarm thresholds.
Registered micro-CT pairs confirmed that subcritical impact altered three-dimensional topology. After impact, crack volume was 4.20% in LC0, 2.88% in LC-B10, 2.36% in LC-S100, and 1.35% in LC-H2; connectivity decreased from 0.773 to 0.356 across LC0 to LC-H2 (Figure 9a and b). The threshold-sensitivity analysis (±5%) was smaller than these between-mixture differences. CT studies of hybrid fibre concrete likewise show that pore and fibre orientation determine available crack paths [42]. The reduced connectivity is consistent with repeated interruption of an advancing crack, although the CT scan does not identify the force carried by each fibre.
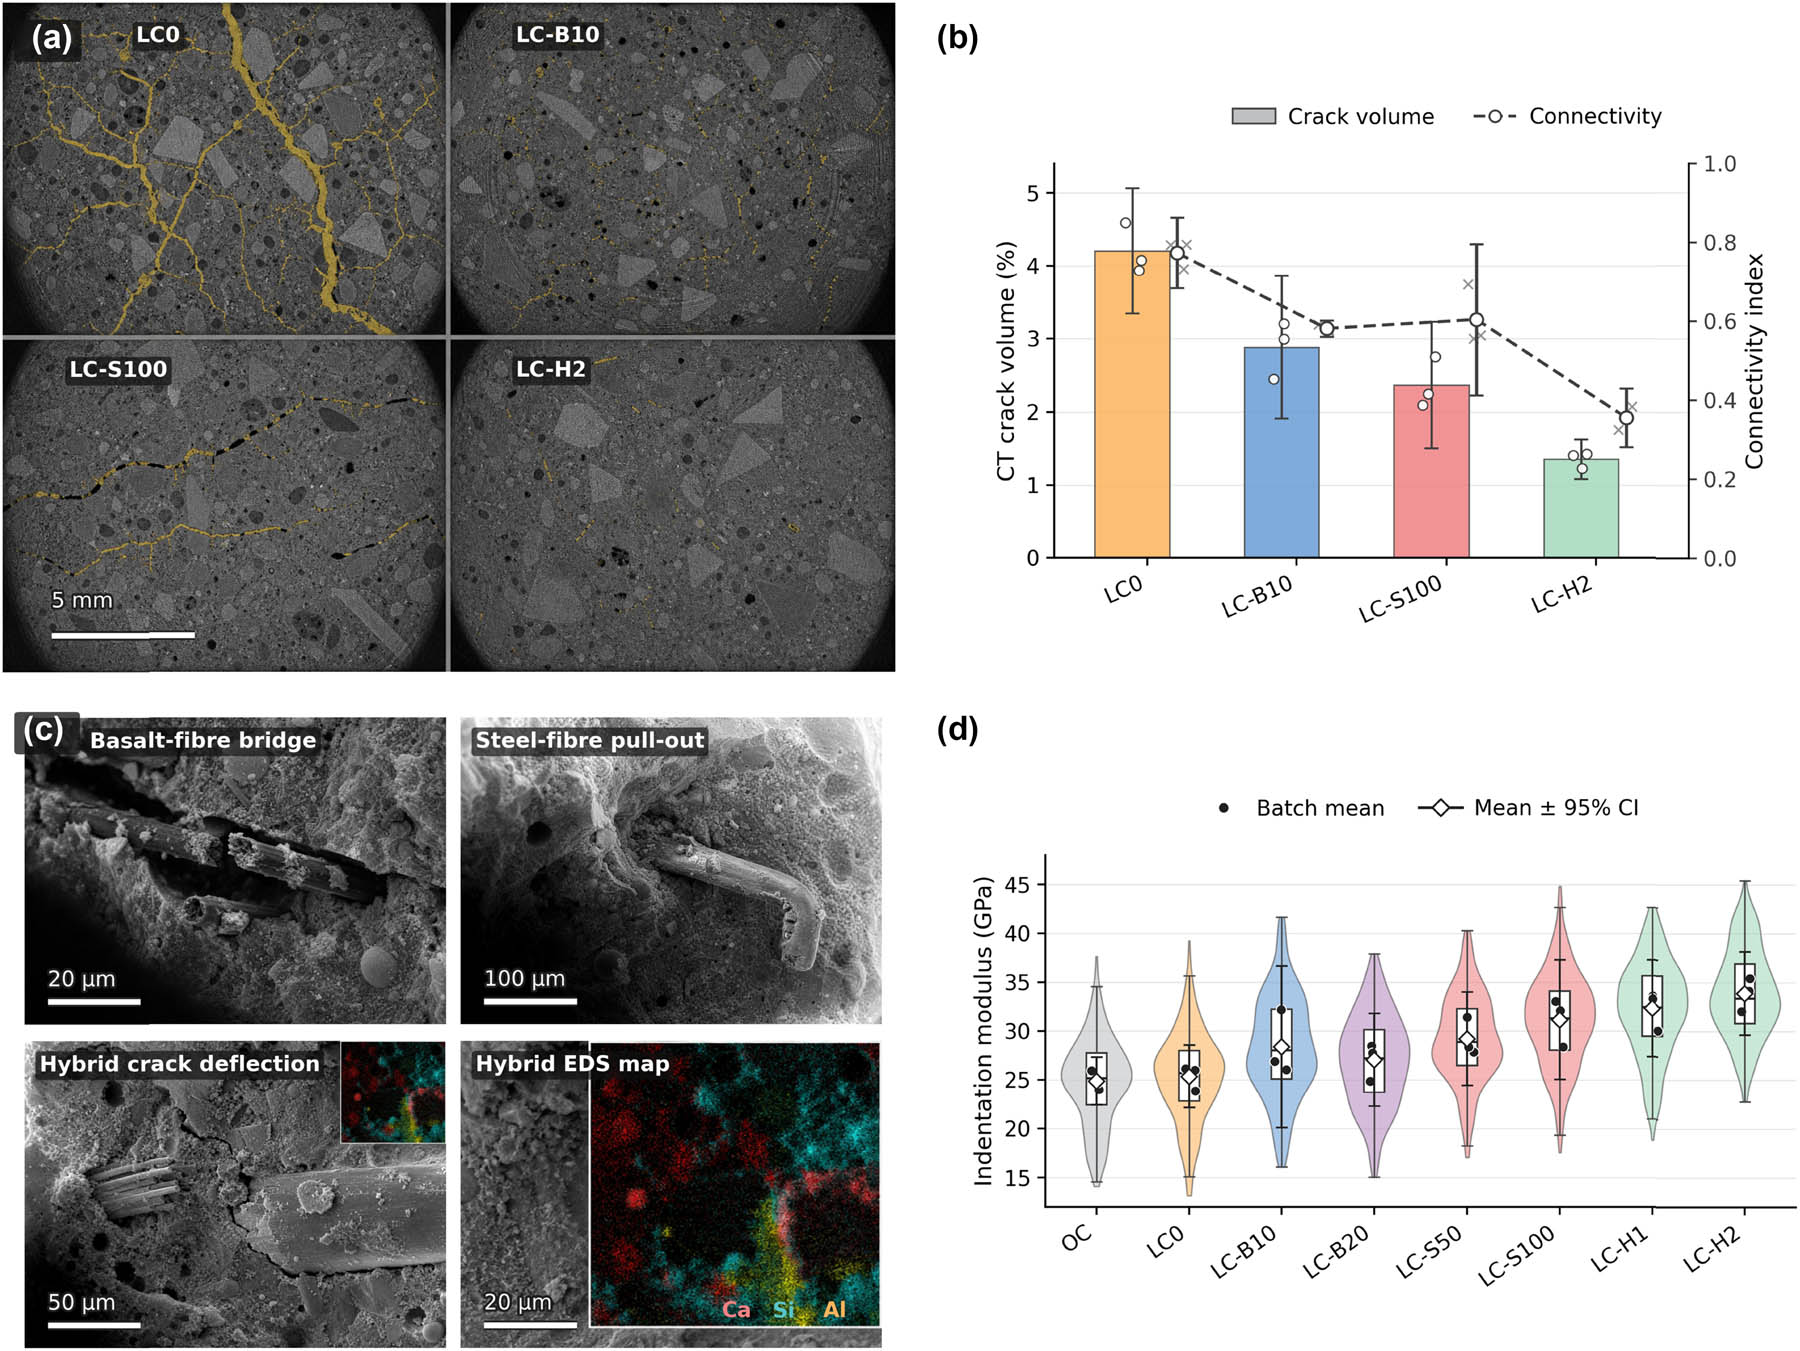
Figure 9
Three-dimensional cracking and fibre–matrix interfaces. (a) Micro-CT crack projections; (b) crack volume and connectivity; (c) representative SEM–EDS interface fields; (d) nanoindentation modulus distributions. Microstructural summaries represent three independently batched specimens per selected mix; box plots display medians, quartiles, and 1.5-IQR whiskers.
CT-based fracture analysis of heated ultra-high-performance fibre concrete has linked internal crack volume and tortuosity to measured fracture work [43]. The current results extend that link to moderate-strength low-carbon shotcrete. LC-B10 reduced connectivity more than crack volume because many fine branches remained but failed to join. LC-S100 reduced both metrics through bridging of larger cracks. LC-H2 combined the two responses. This topology also clarifies why a two-dimensional crack width alone would be insufficient: two panels can display similar surface openings while differing in internal linkage and remaining ligament area.
SEM–EDS fields in Figure 9c showed three recurring energy dissipation features across the three independently batched specimens. Basalt filaments carried adherent hydrate fragments and left narrow pull-out channels, indicating combined rupture and short debonding. SFs showed scratched surfaces, matrix cones, and local crushing around hooked ends. Hybrid fields contained deflected cracks that moved between both interfaces. SEM observations of SF concrete define the fibre ITZ as a distinct region whose porosity and orientation influence pull out [44]. In this study, the low-carbon reaction products filled parts of that region, while the hook generated controlled local crushing. Energy was therefore expended through matrix microcracking, interface debonding, friction, hook straightening, and fibre pull out rather than one catastrophic cleavage plane.
Nanoindentation in Figure 9d supports the interface interpretation. Specimen-level grid means increased from 25.3 GPa in LC0 to 31.1 GPa in LC-S100 and 33.9 GPa in LC-H2; valid indent counts were 286, 283, and 281, respectively, after pre-specified exclusions. The 25 µm spacing and spatial classification prevented individual indents from being treated as independent replicates. Multiscale studies of slag–fly-ash paste show that reaction degree and gel chemistry generate distinct modulus populations [45]. The hybrid did not chemically create a new bulk binder, and the local distribution is not evidence that fibres accelerated hydration; it is a fibre-adjacent structural indicator consistent with the CT and SEM observations.
The low-carbon binder also affects long-term interpretation. Slag-fly-ash proportions alter reaction products, pore connectivity, and resistance to aggressive ions [46]. Those changes can benefit a wet roadway, but accelerator-rich early hydration and repeated impact may create different transport paths from conventionally cast material. Studies that combine microstructure and environmental impact in fly-ash binders show that lower carbon does not guarantee adequate deformation unless composition and curing are jointly controlled [47]. Multi-objective optimisation of fly-ash-slag concrete reaches the same conclusion: strength, durability, and carbon objectives define a Pareto region rather than one universally optimum mixture [48]. LC-H2 occupied the impact-strength end of that region; LC-H1 delivered slightly lower energy with 33.9% carbon reduction and better slump, making it a plausible field compromise.
Across SHPB curves, DIC fields, AE chronology, CT topology, SEM pull-out, and nanoindentation, the evidence is consistent with a proposed four-stage response: elastic matrix loading, distributed microcrack restraint, engagement of steel bridges as cracks widen, and residual fragment interlock. These techniques do not directly observe the temporal force carried by individual basalt and SFs; the sequence is therefore a mechanistic interpretation rather than a demonstrated causal chronology.
The controlled robotic programme, 10 mm aggregate, 25 mm SHPB thickness, and 60 mm panels limit direct transfer to roadway linings. The carbon inventory is material-stage and omits separate project-specific transport, concrete mixing and spraying energy, service life, and end of life. Three batches support hierarchical inference but not plant-to-plant generalisation. Necessary validation includes instrumented full-scale pumping, larger restrained panels, oblique impact, cyclic convergence, wet–dry exposure, and interaction with bolts and mesh.
LC-H2 was the best-performing mixture under the tested impact conditions, whereas LC-H1 offered a more delivery-tolerant trade-off: 59.0 MPa compressive strength, 8.62 MPa flexural strength, 2.71 MJ/m3 SEA, 1.87 kJ cumulative drop-weight energy, 156 mm slump, and 33.9% carbon reduction. Selection should therefore use equipment-specific fresh-state limits, energy thresholds, and carbon intensity rather than a universal optimum.
4. Conclusion
Replacing 45% of OPC with slag and fly ash reduced material-stage carbon by 39.0% and lowered 28 days core strength from 49.2 to 45.5 MPa. Fibre reinforcement recovered strength and markedly improved post-crack energy. Among all mixtures, LC-H2 (0.10 vol.% basalt plus 1.00 vol.% steel) reached 63.1 MPa compressive strength, 9.90 MPa flexural strength, 523 N/m fracture energy, 3.05 MJ/m3 SEA at 80 s−1, and 2.31 kJ cumulative drop-weight energy while retaining a 29.4% carbon reduction. Hierarchical and sensitivity analyses supported this ranking, and positive excesses were 0.48 MJ/m3 for SHPB energy and 0.48 kJ for drop-weight energy.
DIC, AE, registered micro-CT, SEM–EDS, and nanoindentation were consistent with a proposed multiscale mechanism of distributed microcrack restraint followed by hooked-steel bridging, but did not directly resolve individual fibre activation. LC-H1 retained slightly lower impact capacity with 156 mm slump and a 33.9% carbon reduction, making it the more delivery-tolerant candidate; LC-H2 is recommended where impact demand dominates and the tested robotic delivery conditions can be reproduced. Full-scale pumping, support interaction, environmental exposure, and oblique-impact testing remain necessary before construction qualification.
Funding information
Authors state no funding involved.
Author contributions
Shuo Wang: Investigation, data curation, formal analysis, visualization, and writing – original draft. Qibin Zhu: Conceptualization, methodology, supervision, project administration, and writing – review and editing. Tong Shen: Investigation, resources, validation, and writing – review and editing. All authors read and approved the final manuscript.
Conflict of interest statement
Authors state no conflict of interest.
Data availability statement
The data supporting the findings of this study are available from the corresponding author upon reasonable request. Please include this statement in the article.