
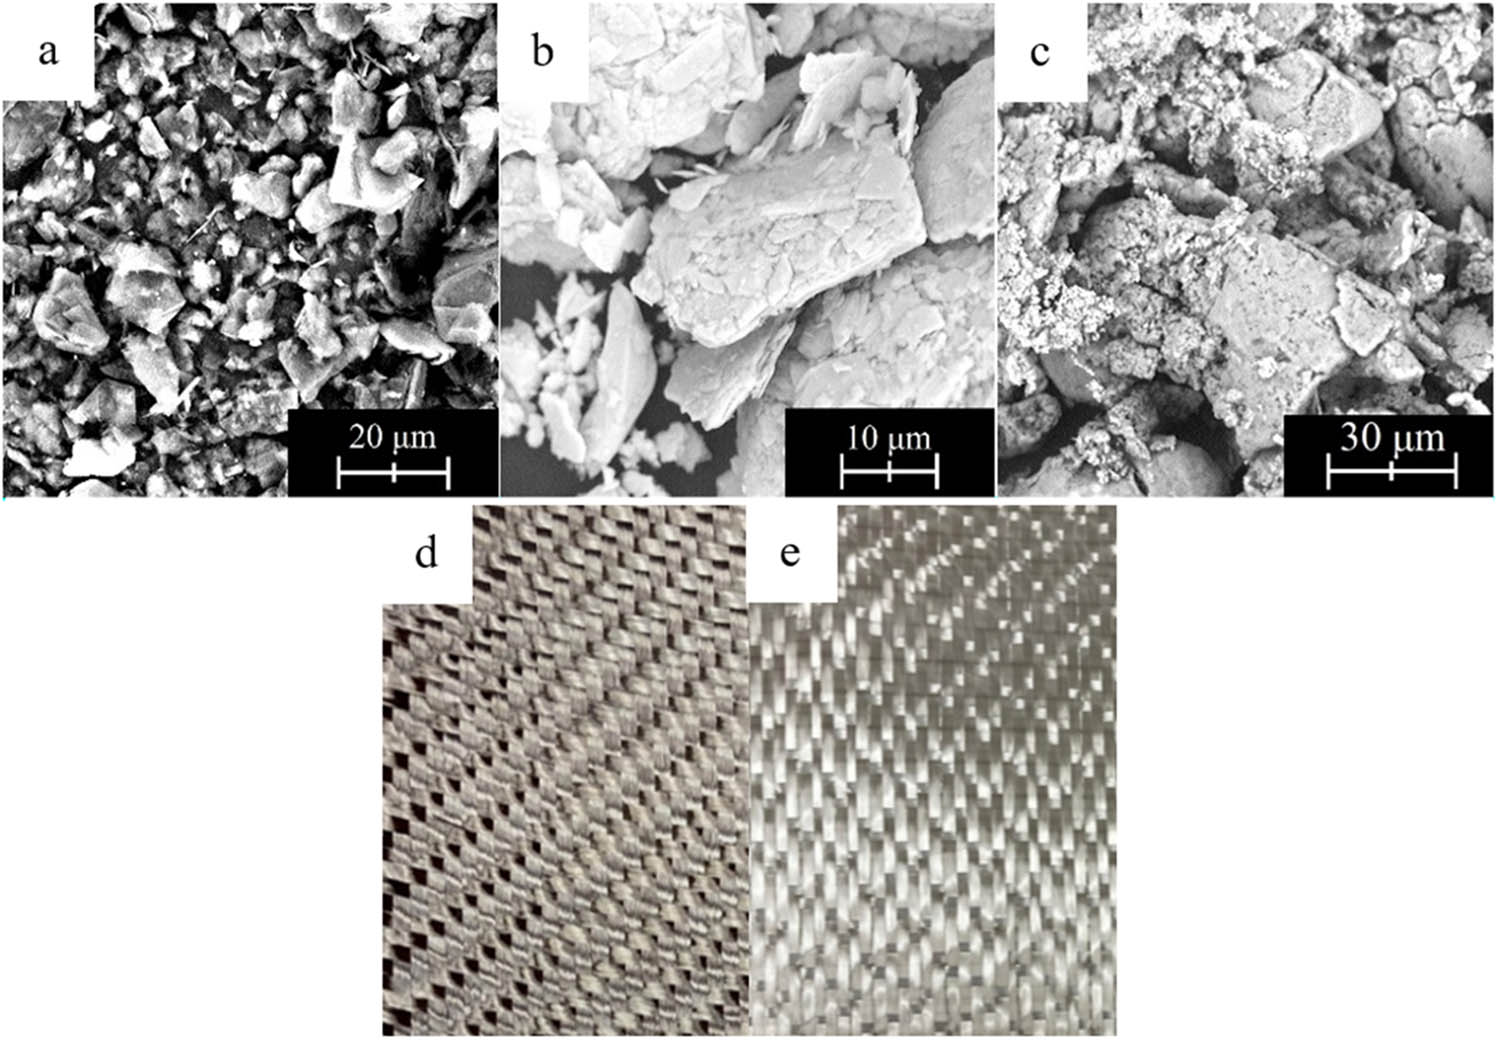
Figure 1
Scanning electron microscopy (SEM) images of the solid lubricants used as fillers: (a) graphite, (b) MoS2, (c) PTFE, and photos of the fabrics: (d) carbon fiber and (e) glass fiber used with the photocurable resin to prepare the specimens.
Table 1
| Property | Carbon fiber | Glass fiber |
|---|---|---|
| Filament diameter (µm) | 7 | >6–9 |
| Density (g/cm³) | 1.80 | 2.55 |
| Color (−) | Black | White |
| Tensile strength (MPa) | 4,900 | ∼3,400 |
| Young’s modulus (GPa) | 230 | 72–76 |
Table 2
Selected properties of the photocurable ANYCUBIC® resin used as the laminate matrix [25]
| Property | Value |
|---|---|
| Viscosity (mPa∙s) | 552 |
| Density in liquid state (g/cm³) | 1.100 |
| Density after curing (g/cm³) | 1.184 |
| Tensile strength (MPa) | 23.4 |
| Elongation (%) | 14.2 |
| Curing wavelength (nm) | 405 |
| Hardness (Sh D) | 79 |
Table 3
| Property | Graphite | MoS2 | PTFE |
|---|---|---|---|
| Particle size (µm) | 4–30 | 16–30 | 20–70 |
| Density (g/cm³) | 2.26 | 4.8 | 2.14 |
| Color (−) | Black | Dark gray | White |
Table 4
Material variants used in the tribological tests, including reinforcement–filler combinations and filler mass fractions
| Fiber type | Filler type | Filler mass fraction (wt%) | Mass (g) | Abbreviated name |
|---|---|---|---|---|
| Carbon | None | — | — | CF + R |
| Carbon | Graphite | 5.0 | 0.526 | CF + R + G |
| Carbon | MoS2 | 2.5 | 0.256 | CF + R + MoS2 |
| Carbon | PTFE | 10.0 | 1.111 | CF + R + PTFE |
| Glass | None | — | — | GF + R |
| Glass | Graphite | 5.0 | 0.526 | GF + R + G |
| Glass | MoS2 | 2.5 | 0.256 | GF + R + MoS2 |
| Glass | PTFE | 10.0 | 1.111 | GF + R + PTFE |
Note: CF – carbon fiber, GF – glass fiber, R – resin, G – graphite.
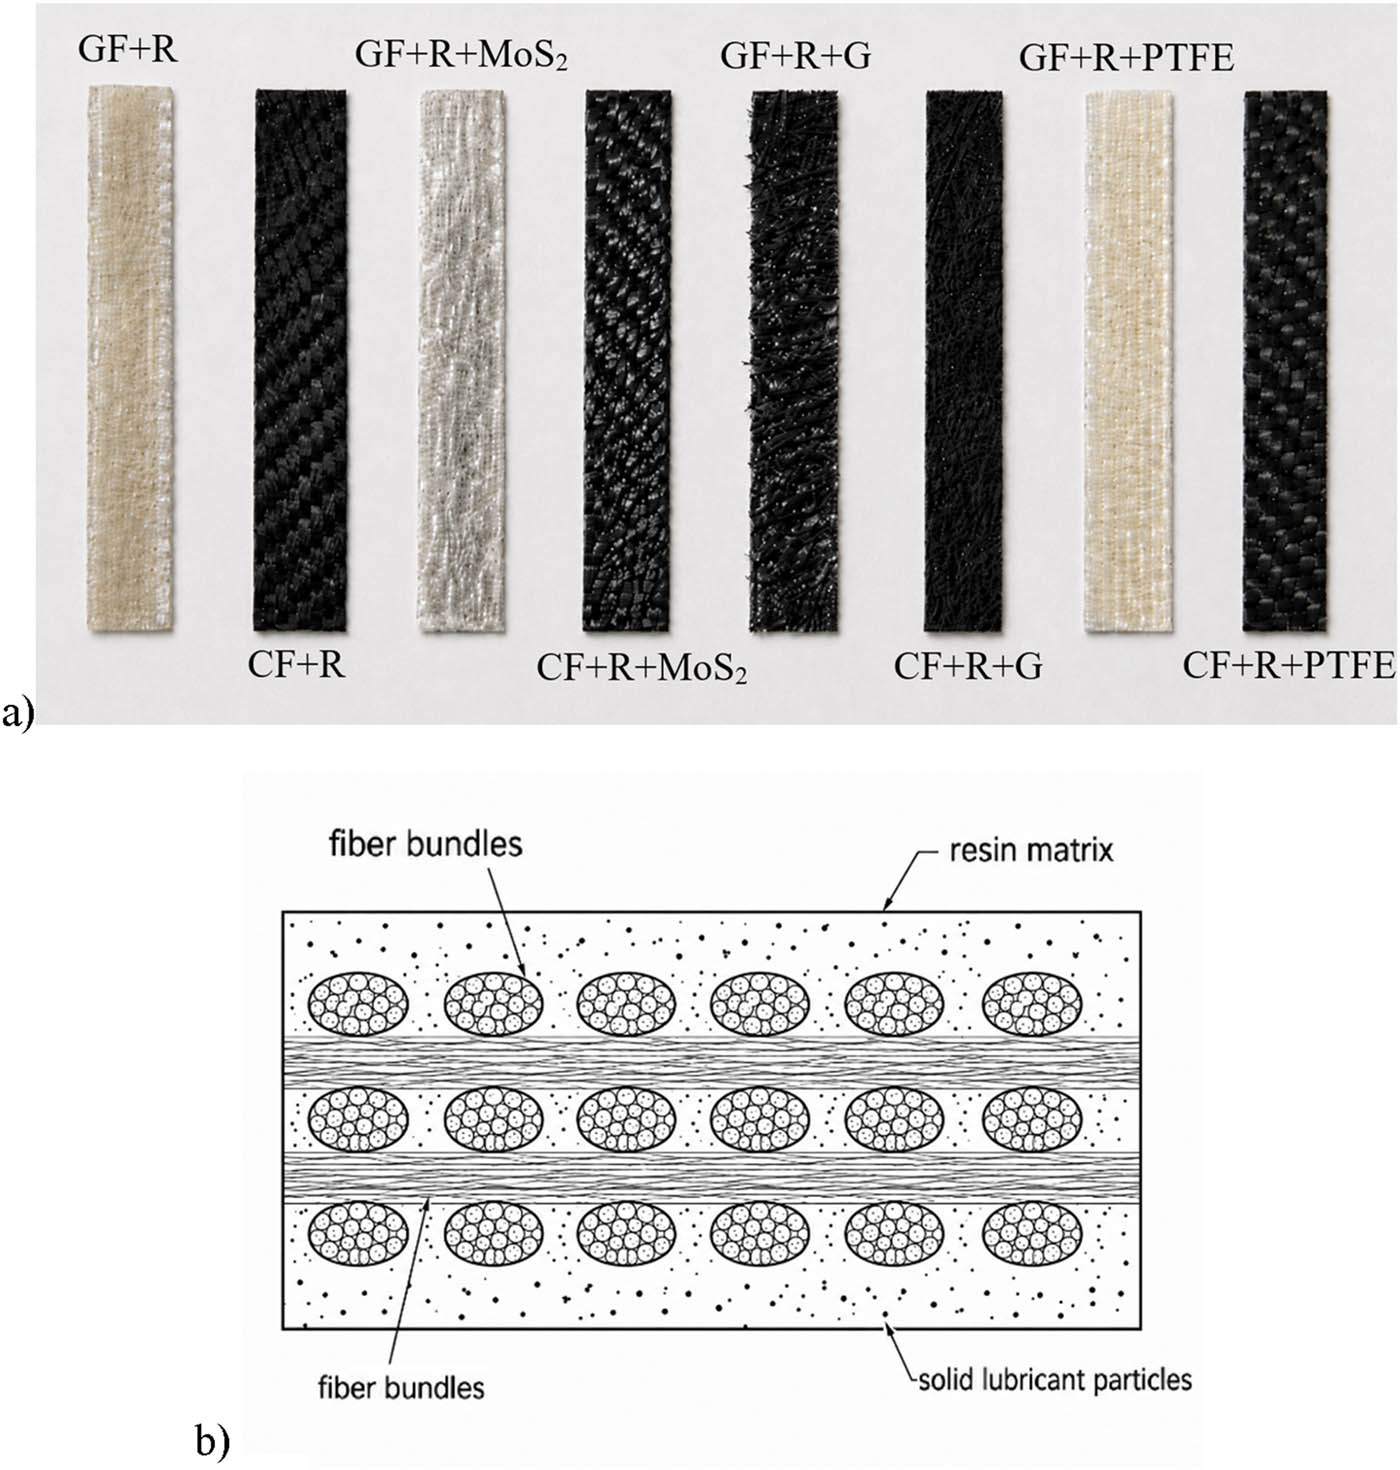
Figure 2
Laminate specimens and schematic representation of their structure: (a) View of the fabricated specimens intended for tribological testing; (b) schematic cross-section of the laminate specimen showing lower resin/filler layer, reinforcing fabric impregnated with UV-curable resin with solid lubricant particles, and upper resin/filler layer.
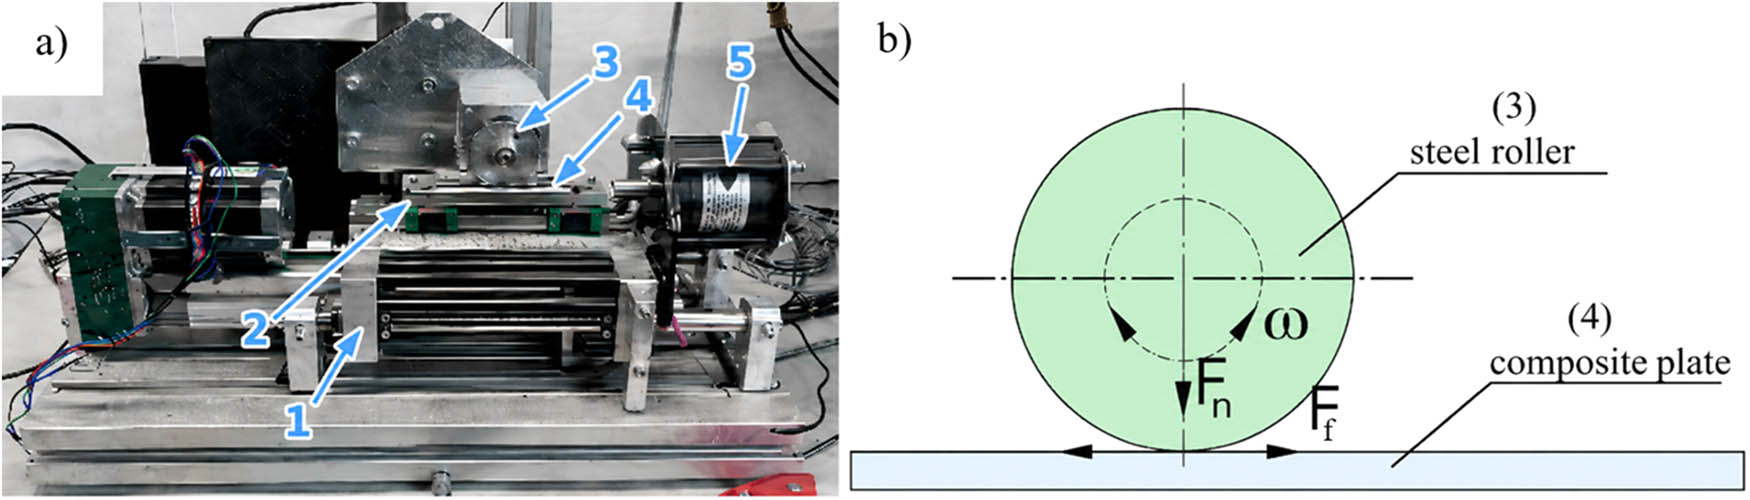
Figure 3
Test stand with the system for friction and wear testing under rolling–sliding motion for the roller-plate configuration: (a) Actual view, (b) Kinematic scheme; test stand components: 1 – lower carriage, 2 – upper carriage, 3 – counter-sample (steel roller), 4 – sample (composite plate), 5 – friction force sensor (strain gauge); Fₙ – normal force, F f – friction force, ω – rotational speed of the steel roller relative to the composite plate.
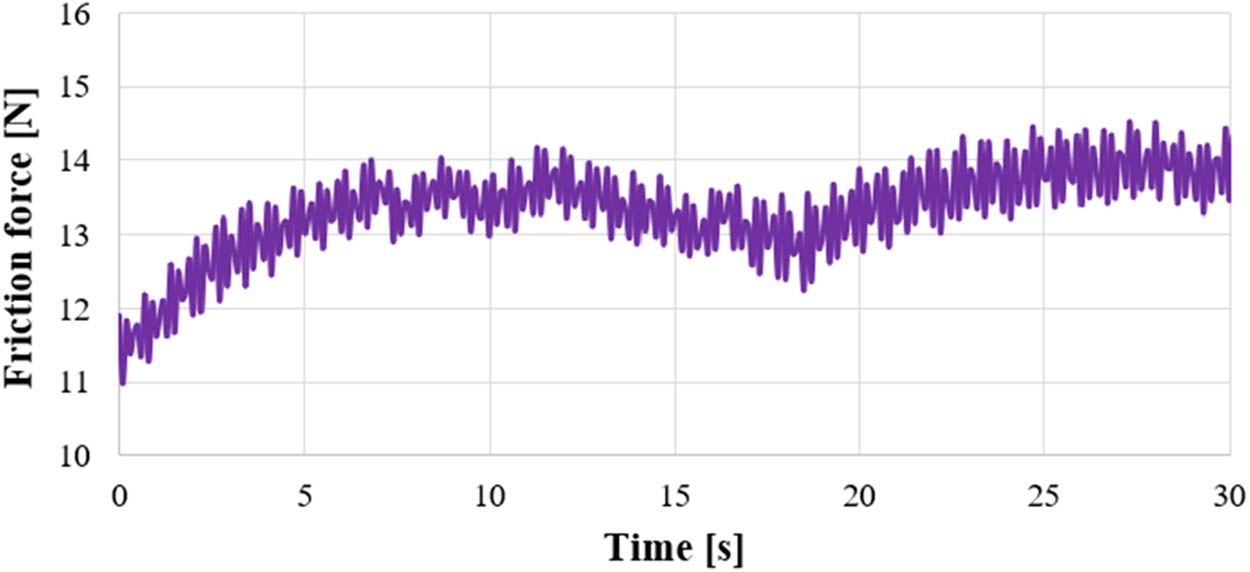
Figure 4
Representative fragment of the kinetic friction force signal recorded during the first 30 s of sliding for the CF + R + PTFE laminate tested against a C45 steel counterelement. The curve shows the initial contact stabilization stage followed by stabilized friction-force fluctuations under technically dry sliding conditions.
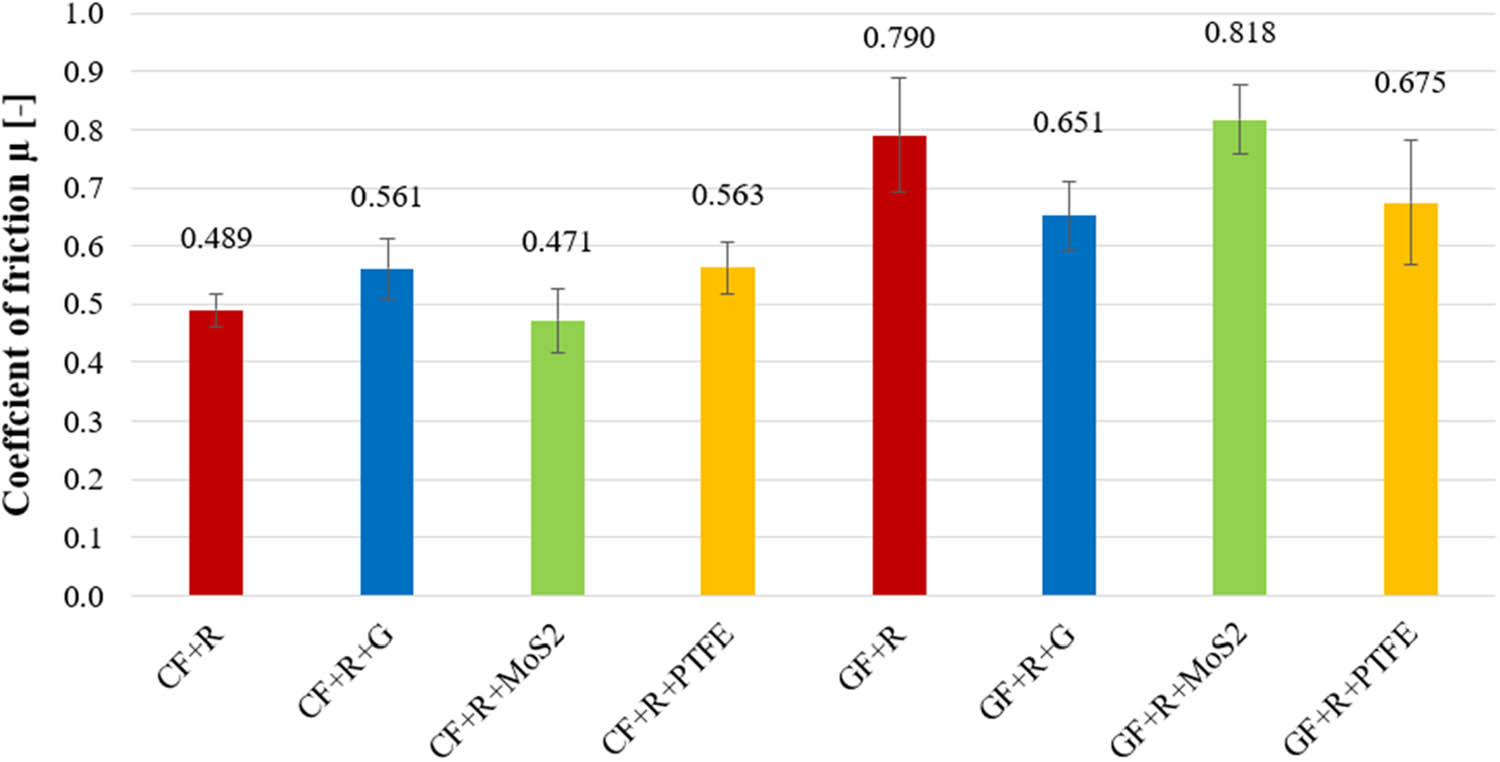
Figure 5
Mean values of the coefficient of kinetic friction for the tested laminates sliding against the C45 steel counterelement. The values above the bars indicate mean values obtained from three measurement repetitions; error bars represent the variability of the results (SD).
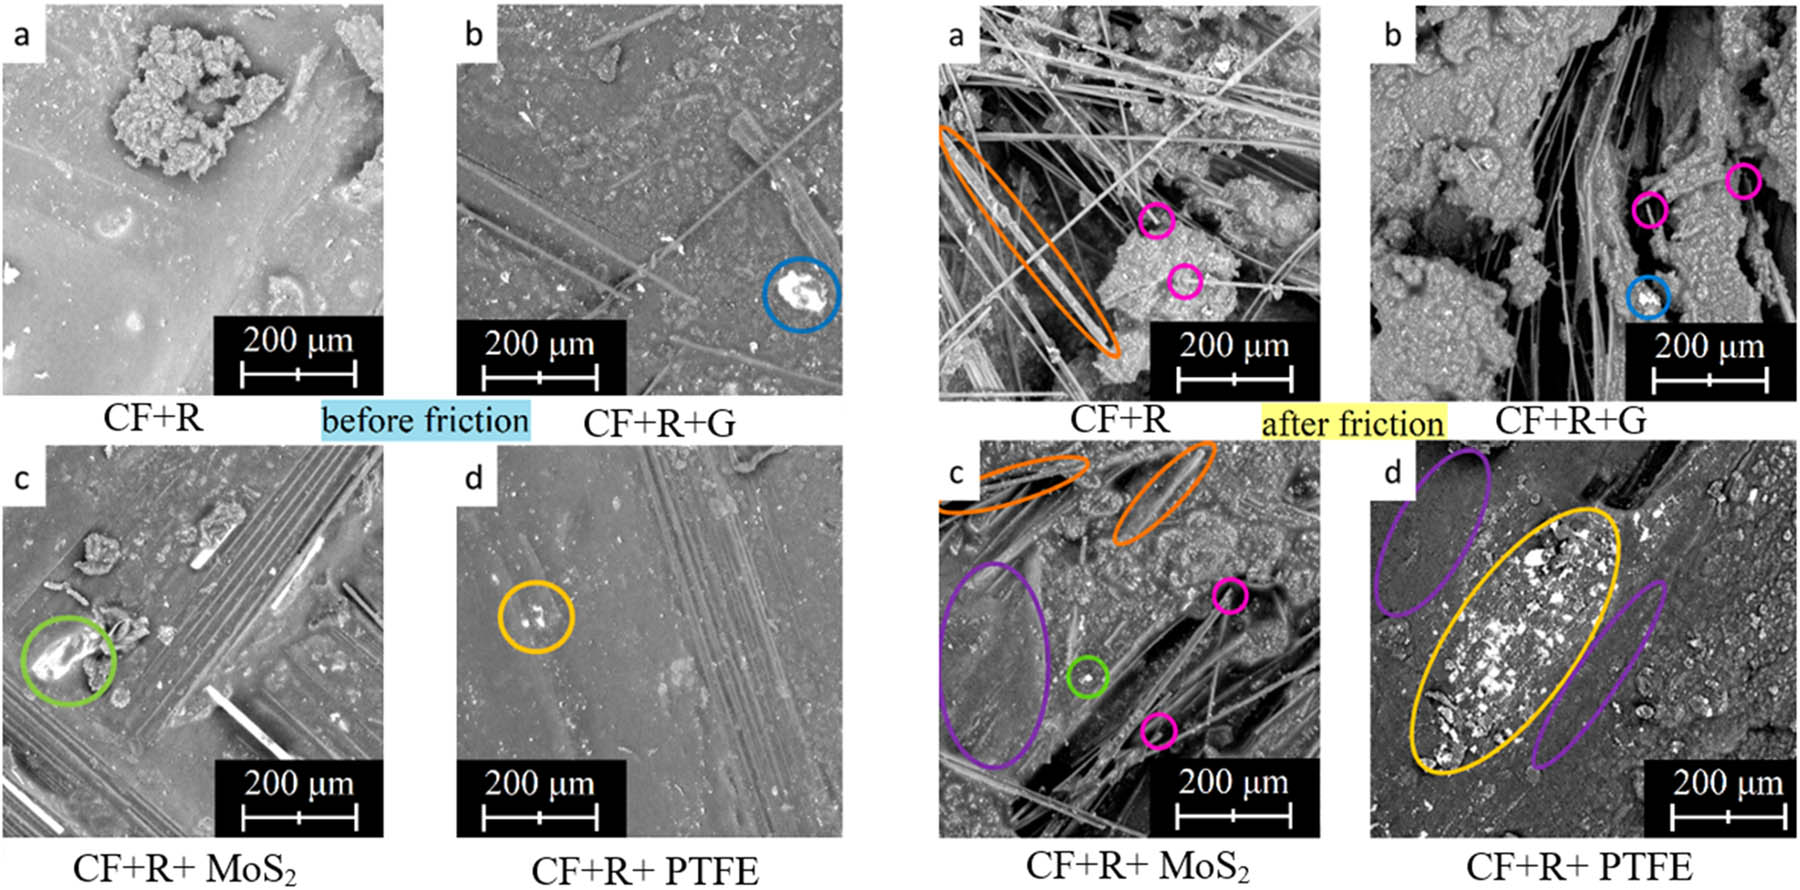
Figure 6
SEM micrographs of the surfaces of carbon-fiber-fabric-reinforced laminates before the tribological tests: (a) CF + R, (b) CF + R + G, (c) CF + R + MoS2, and (d) CF + R + PTFE and after the tribological tests: (a) CF + R, (b) CF + R + G, (c) CF + R + MoS2, and (d) CF + R + PTFE.
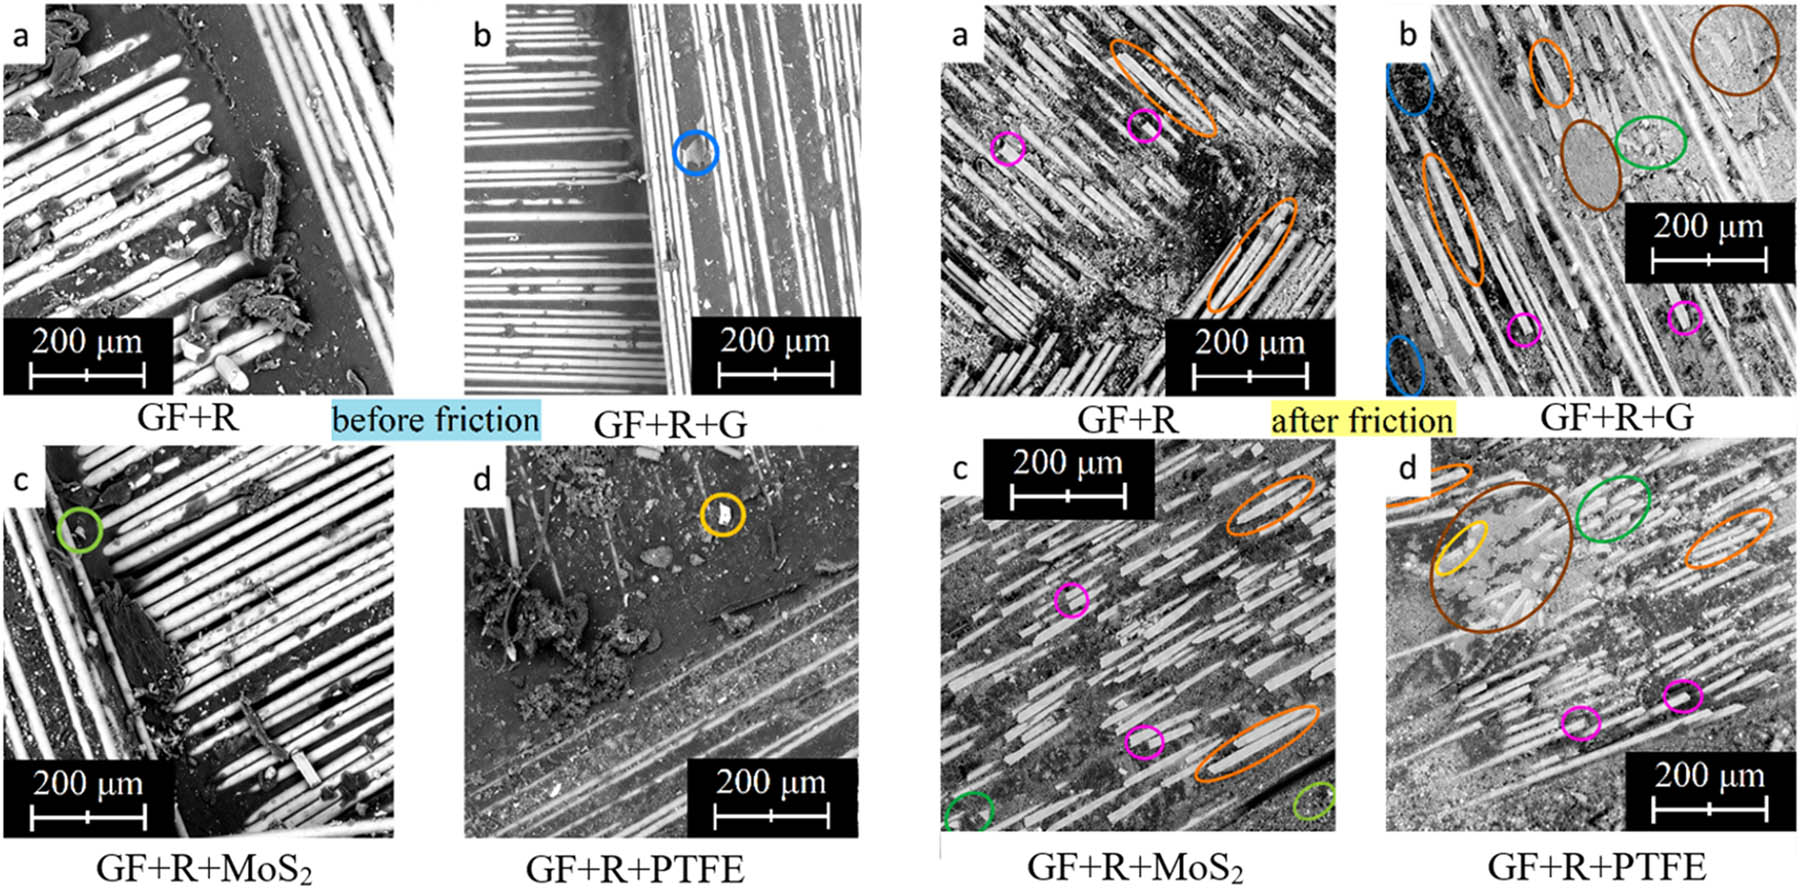
Figure 7
SEM micrographs of the surfaces of glass-fiber-fabric-reinforced laminates before the tribological tests: (a) GF + R, (b) GF + R + G, (c) GF + R + MoS2, and (d) GF + R + PTFE and after the tribological tests: (a) GF + R, (b) GF + R + G, (c) GF + R + MoS2, and (d) GF + R + PTFE.
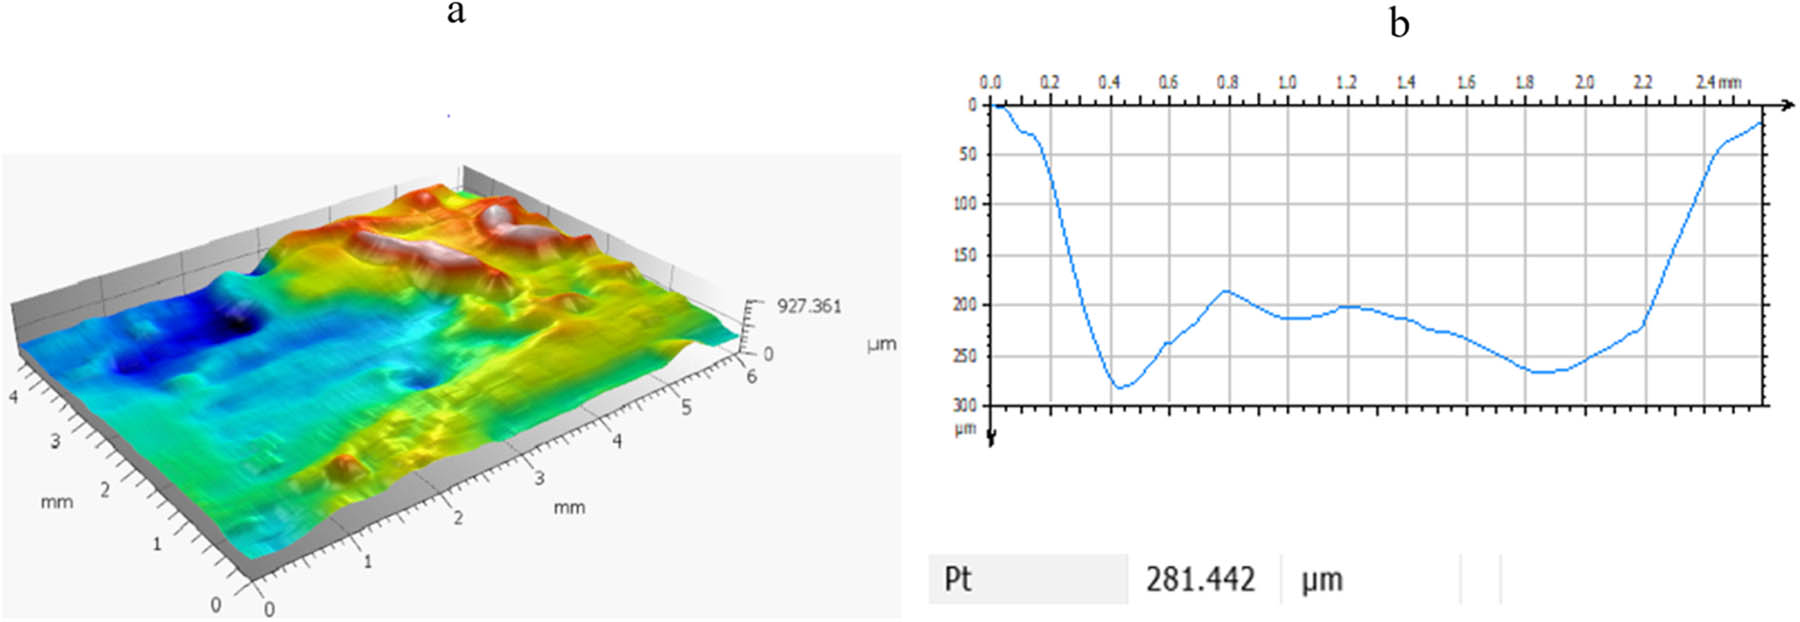
Figure 8
Example of surface topography analysis of a carbon-fiber-reinforced laminate after tribological testing: (a) 3D profilometric scan of the wear track and (b) Cross-sectional profile used to determine the maximum wear track depth P t.
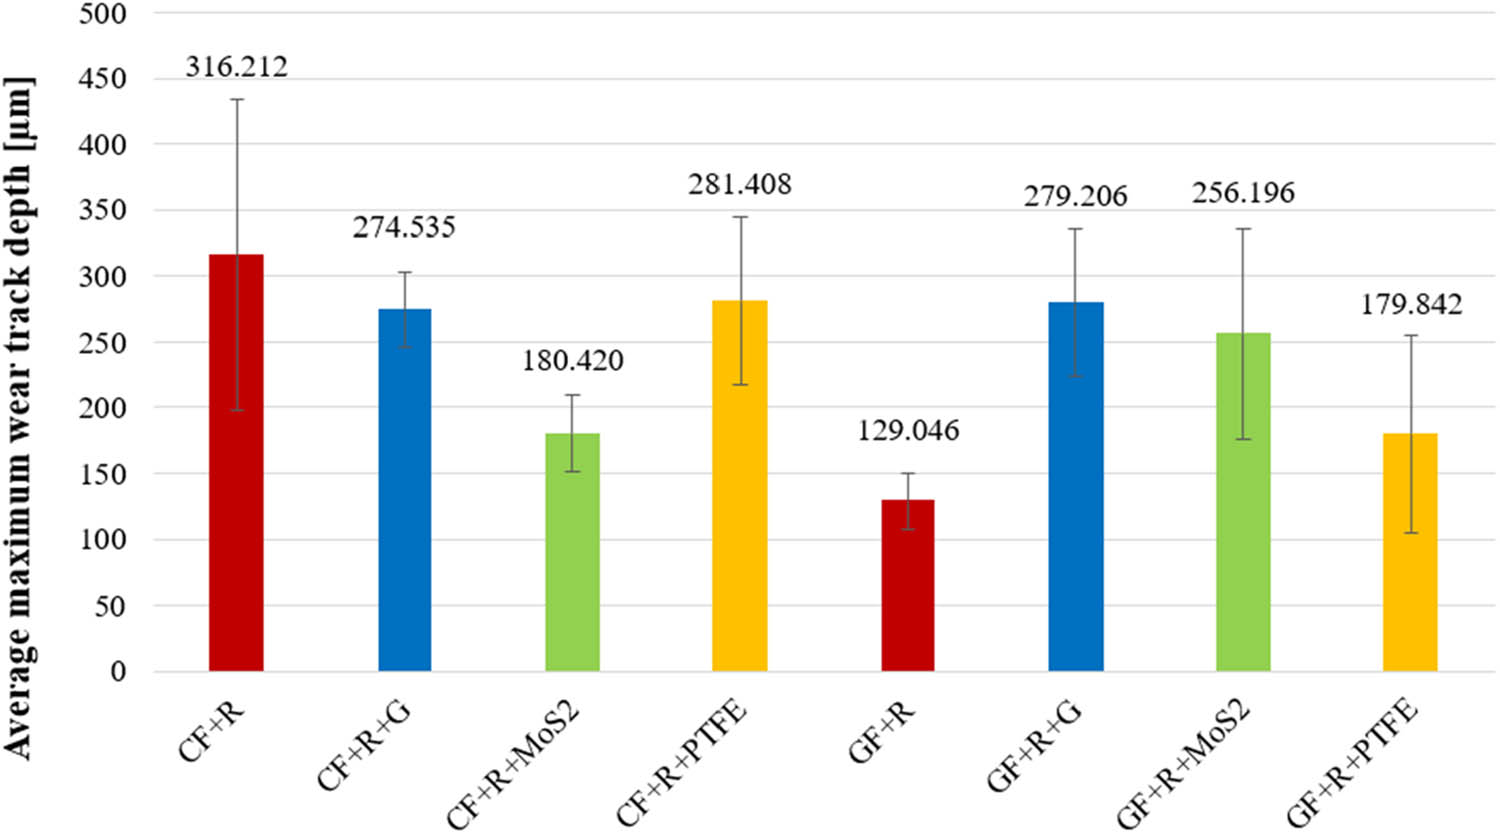
Figure 9
Mean values of the maximum wear track depth Pt for the tested laminates after sliding against the C45 steel counterelement. The values above the bars indicate mean values obtained from three measurement repetitions; error bars represent the variability of the results (SD).