
Table 1
Bulk chemical composition of the processed SRF co-firing ash via XRF (wt%)
| Component | SiO2 | Al2O3 | Fe2O3 | CaO | MgO | SO3 | Cl | LOI |
|---|---|---|---|---|---|---|---|---|
| SRF | 34.70 | 24.30 | 3.70 | 26.10 | 1.30 | 7.10 | 0.30 | 13.70 |
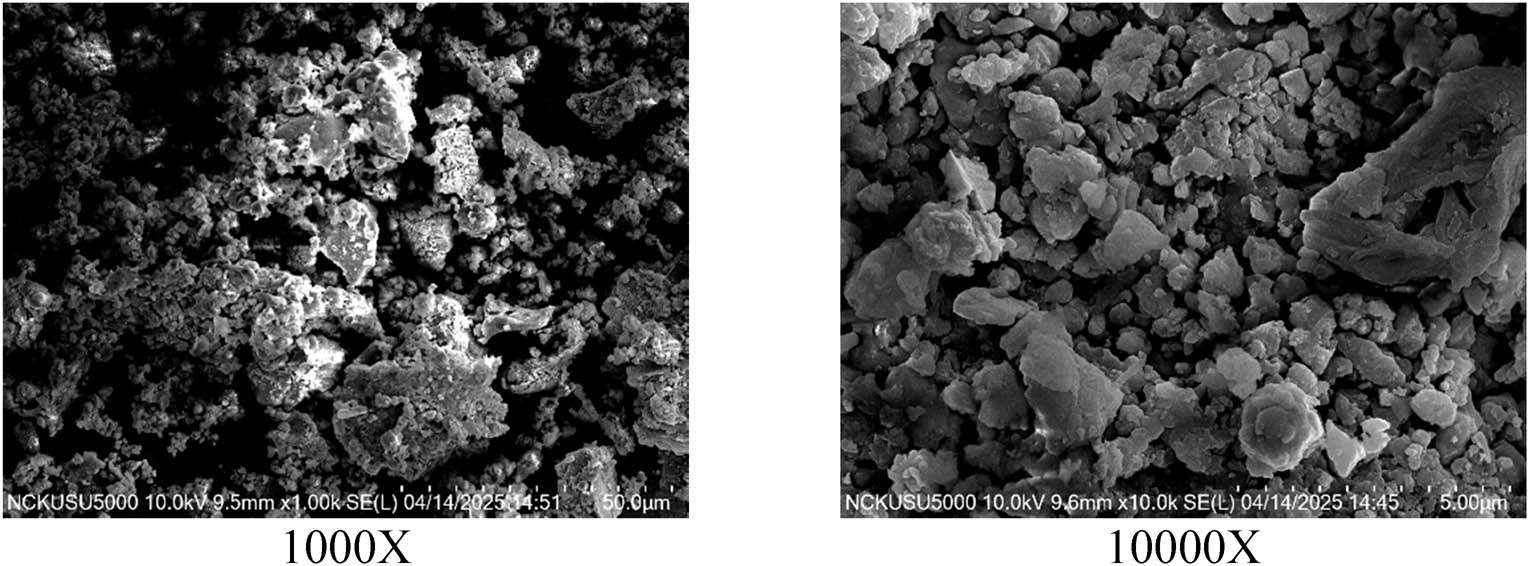
Figure 1
SEM image of SRF ash.
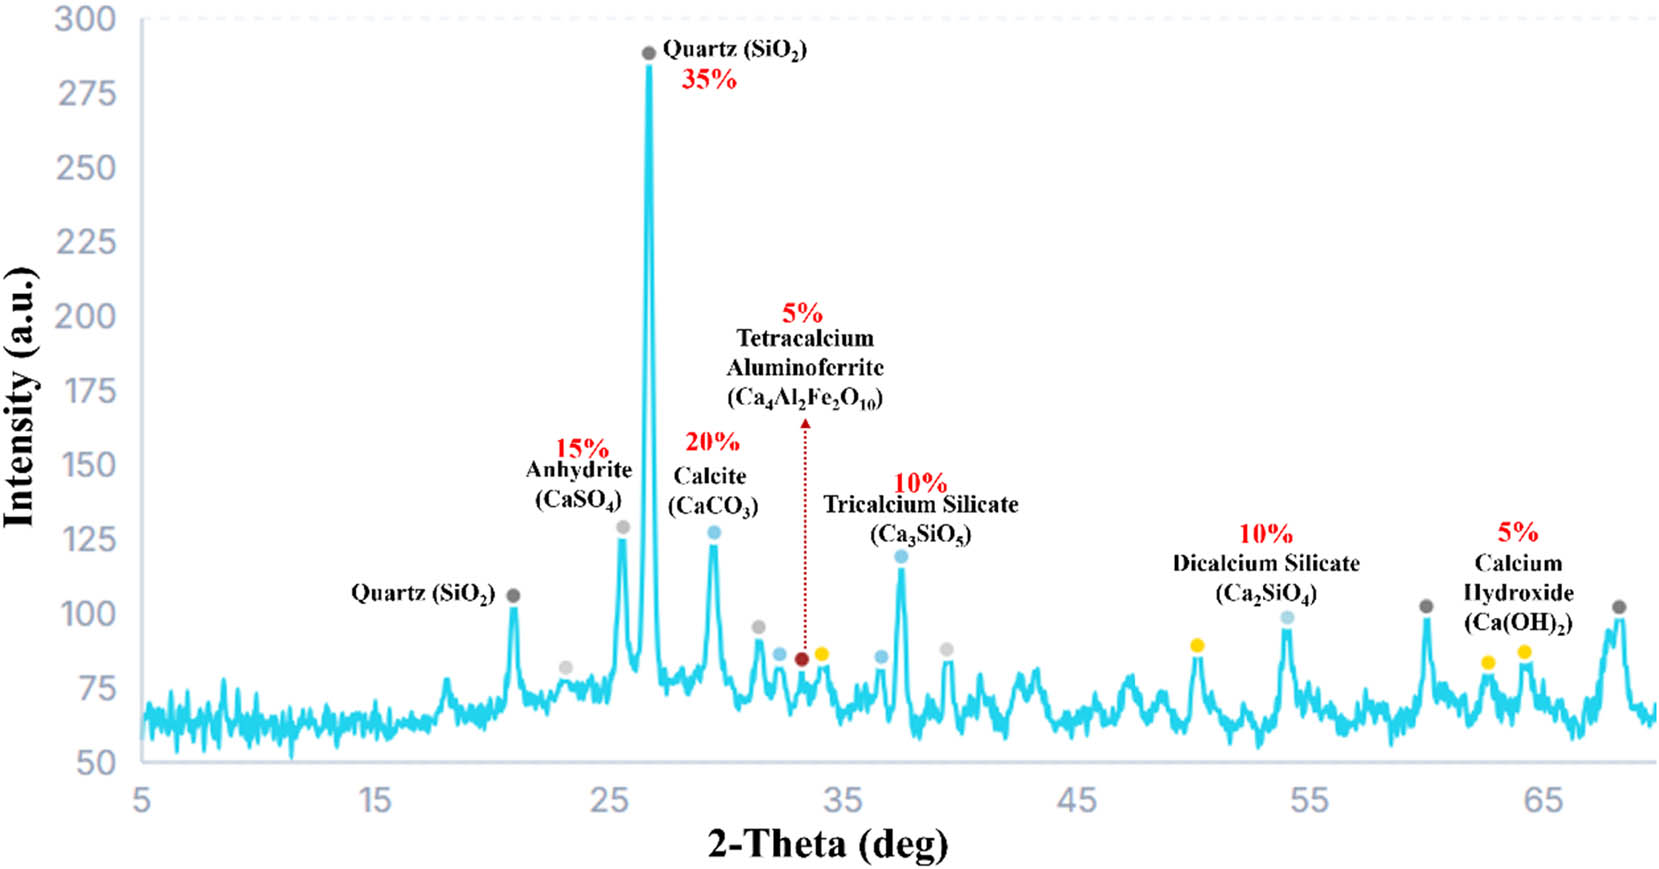
Figure 2
The XRD analysis of SRF ash.
Table 2
Trace heavy metal profile of SRF ash via ICP-OES (mg/kg)
| Element | Arsenic (As) | Barium (Ba) | Chromium (Cr) | Lead (Pb) | Zinc (Zn) | Copper (Cu) |
|---|---|---|---|---|---|---|
| SRF | 5.23 | 21.40 | 15.80 | 12.60 | 45.20 | 8.45 |
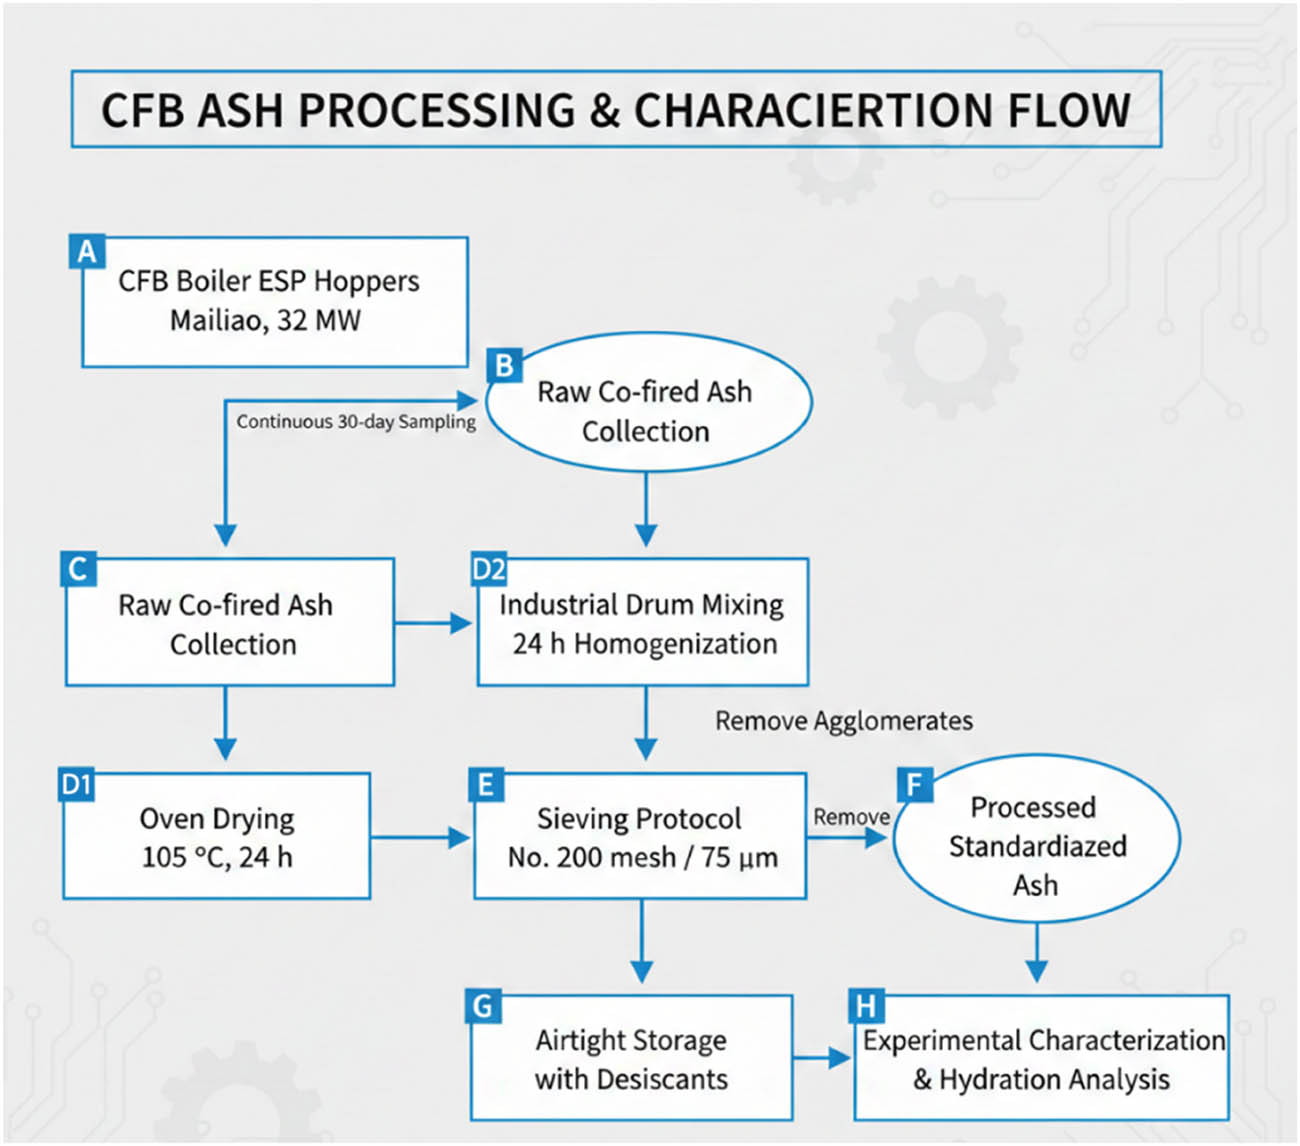
Figure 3
Sequential flowchart outlining the collection, homogenization, and standardized pre-processing protocol.
Table 3
Mortar mix proportions and experimental testing standards
| Parameter | Value/Protocol | Referenced standards |
|---|---|---|
| Ash: sand | 1:3 | ─ |
| W/B ratio | 0.4 | ─ |
| Expansion | 70°C water bath (7 days) | CNS 15311 ASTM D4792 |
| Shrinkage | 23°C, 50% RH (28 Days) | CNS 14603 ASTM C157[1] |
| Humidification | 0, 30, 50, and 100% | Experimental ratios |
[1]Note: Curing and water bath protocols conducted in accordance with CNS 15311 (the Taiwanese standard for testing the expansion of aggregates).
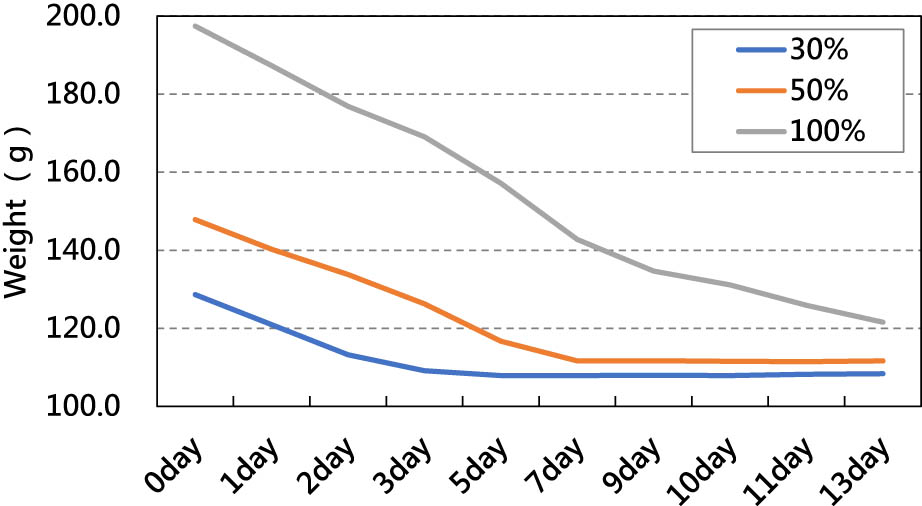
Figure 4
Weight change chart of SRF co-firing ash during the humidification stabilization test.
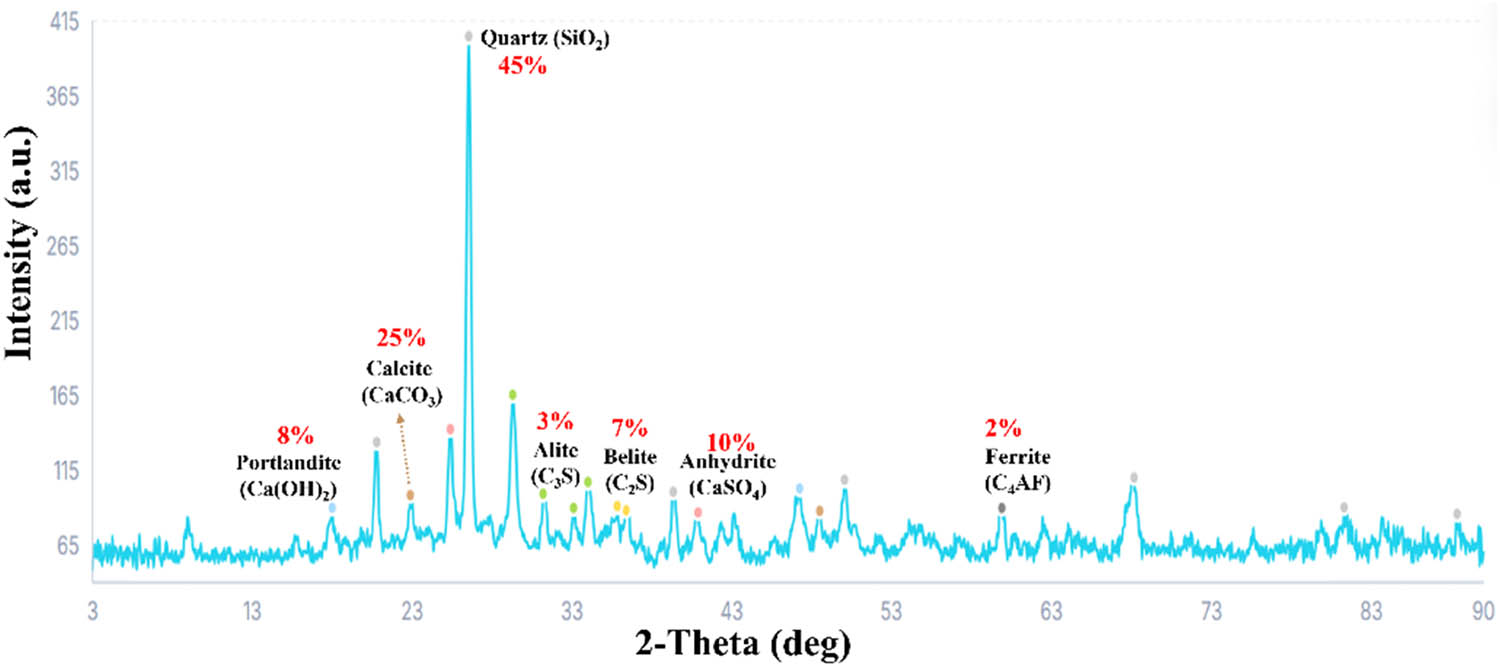
Figure 5
XRD pattern of the co-fired CFB fly ash after 30% humidification stabilization.
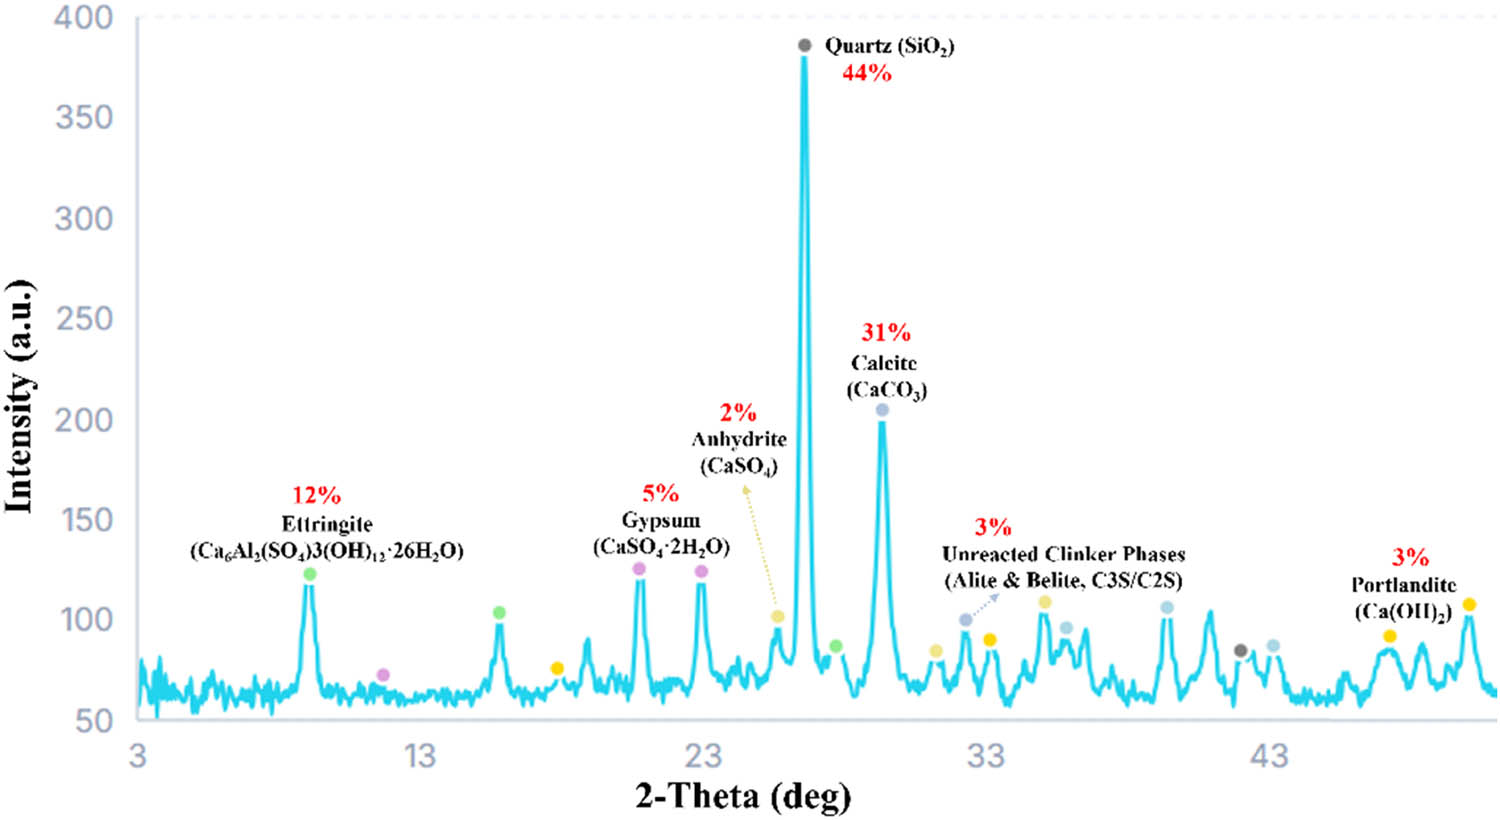
Figure 6
XRD pattern of the co-fired CFB fly ash after 50% humidification stabilization.
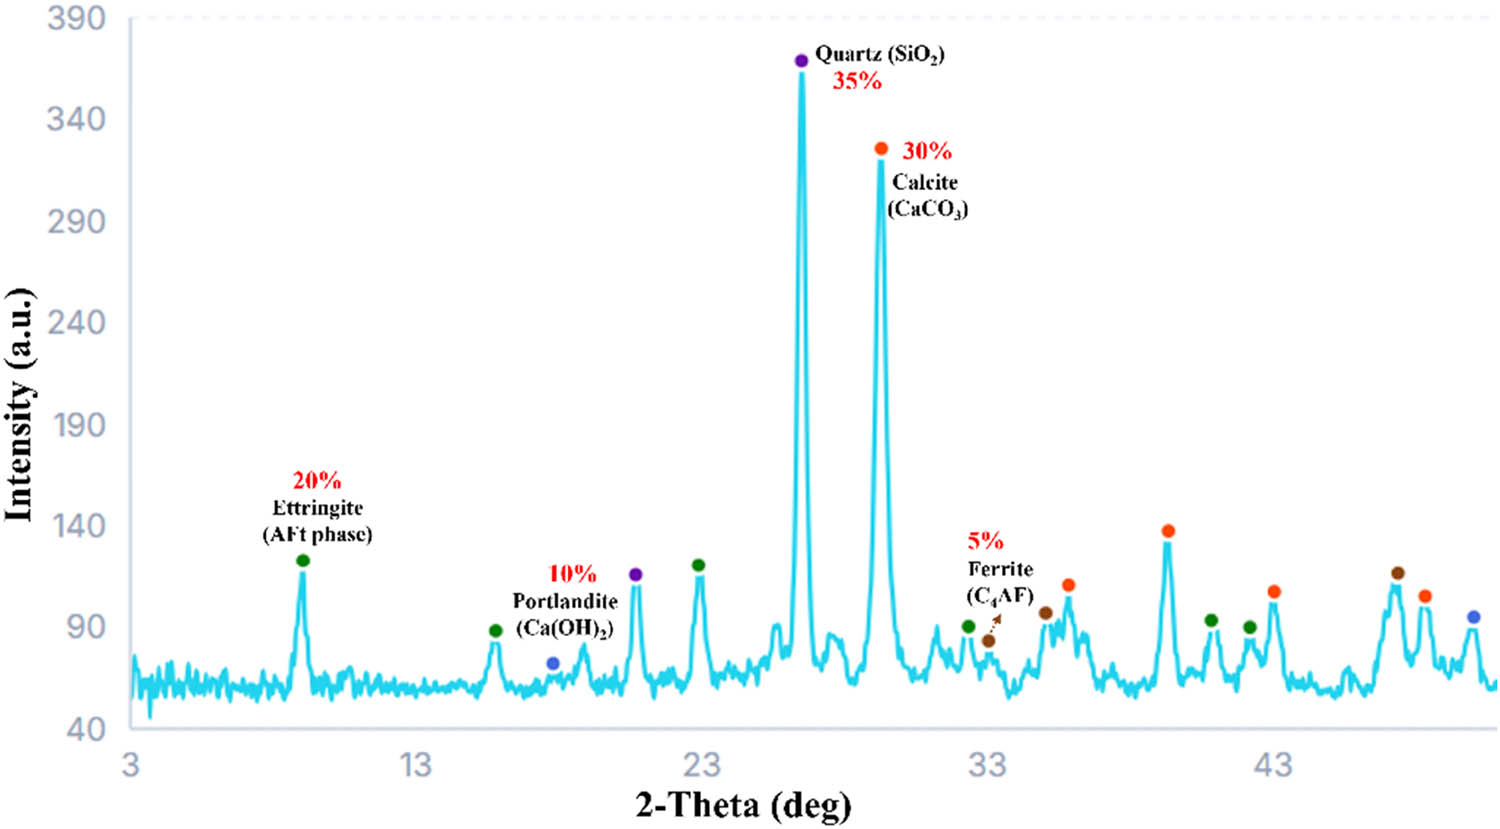
Figure 7
XRD pattern of the co-fired CFB fly ash after 100% humidification stabilization.
Table 4
Quantitative crystalline phase identification via XRD and functions
| Mineral phase | 2θ peak | Structural function |
|---|---|---|
| Quartz | 26.70° | Inert filler: provides physical skeleton |
| C3S/C2S | 29.50°, 37.50° | Latent hydraulic activity; self-cementing [10] |
| Anhydrite | 25.60° | Expansion precursor; Delayed ettringite formation driver [16] |
| Portlandite | 34.10° | Hydration product; provides alkalinity |
| Calcite | 29.40° | Carbonation product; stabilizes AFt |
Table 5
| Chemical reactions | Product | Δr G 0 (kJ/mol) | Stability tendency |
|---|---|---|---|
| C3A + 3Gypsum + 26H2O | AFt | −265.19 | Very high (primary sink) |
| C3A + CaCO3 + 11H2O | Monocarboaluminate (Mc) | −217.61 | High (secondary sink) |
| C3A + 3CaCO3 + 32H2O | Tricarboaluminate (Tc) | −207.91 | Moderate (late stage) |
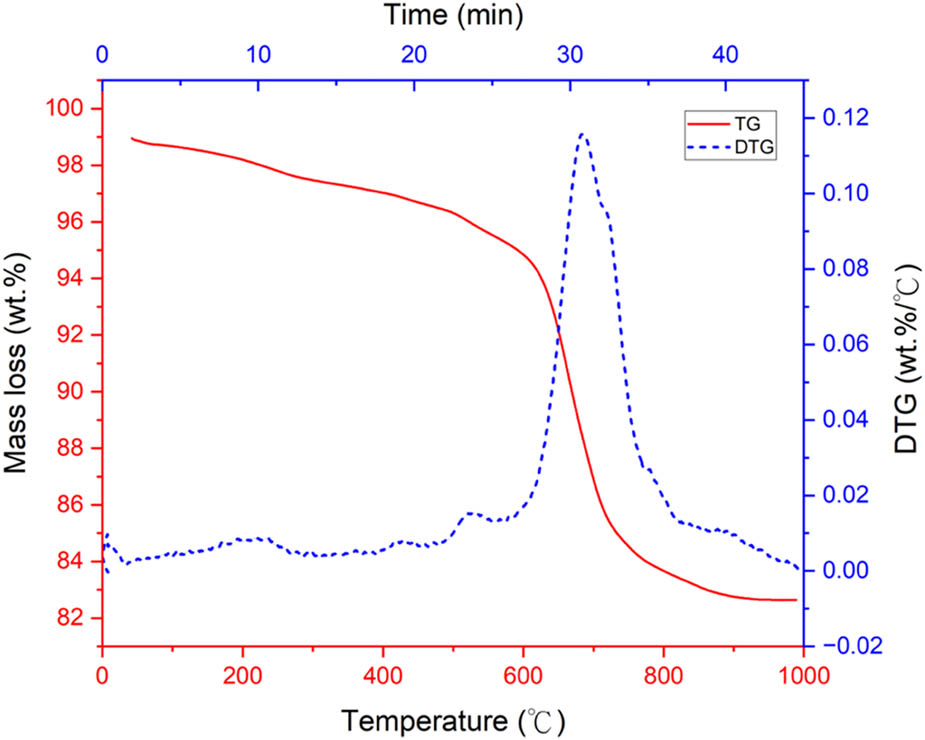
Figure 8
TGA/DTG profile of raw co-fired fly ash at 0% humidification.
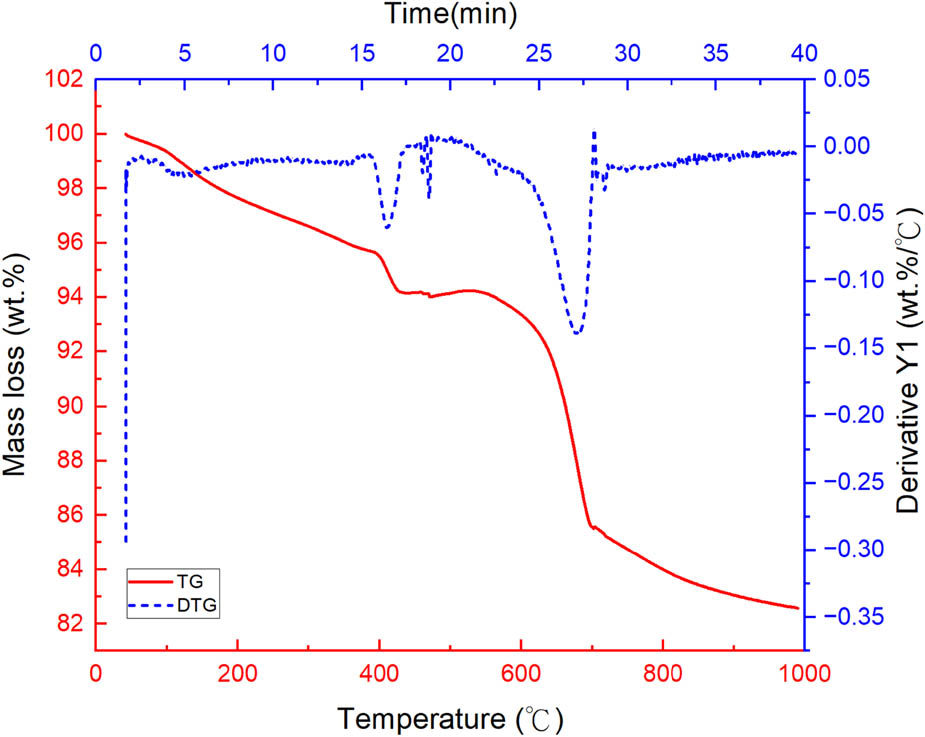
Figure 9
TGA/DTG profile of stabilized ash at 30% humidification.
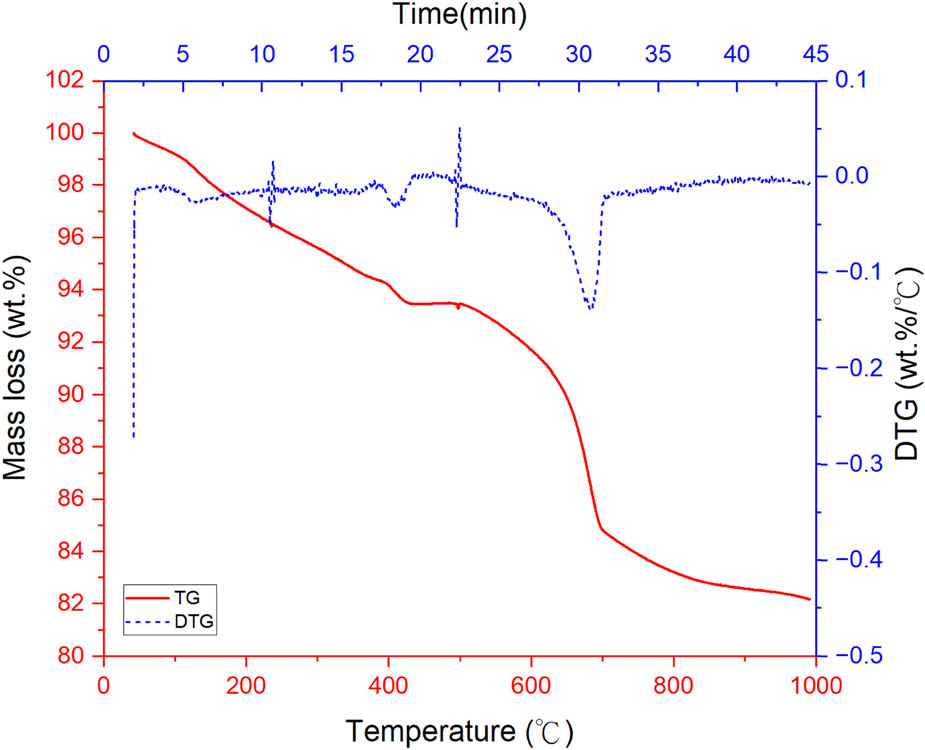
Figure 10
TGA/DTG profile of stabilized ash at 50% humidification.
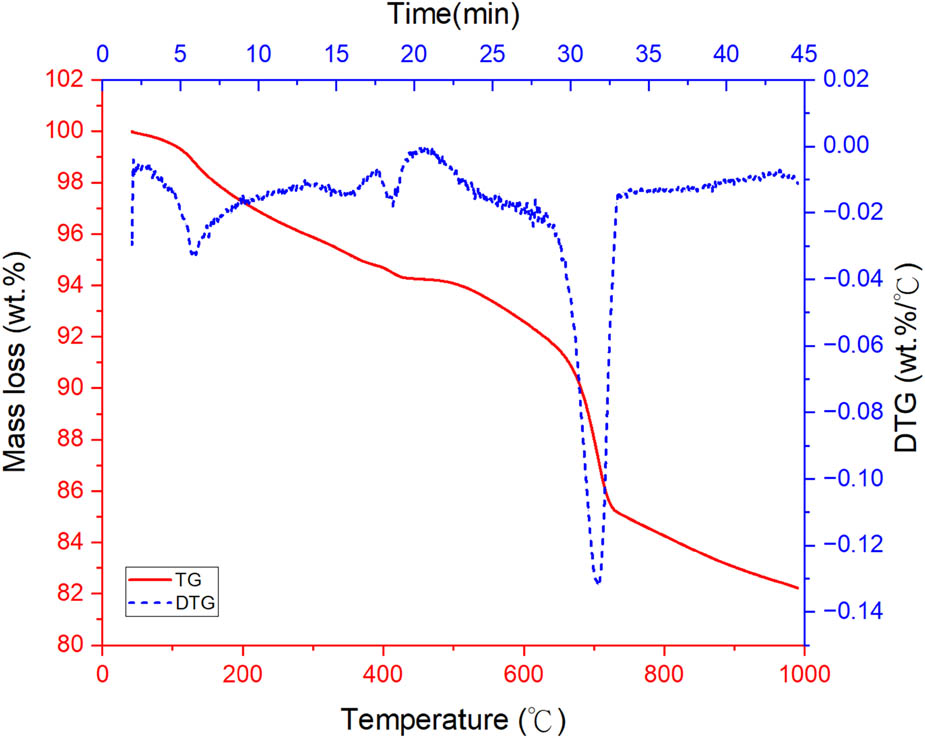
Figure 11
TGA/DTG profile of stabilized ash at 100% humidification.
Table 6
Quantitative TGA mass loss across key thermal decomposition regions (%)
| Humidification | Aft/C–S–H (50–200°C) | Ca(OH)2 (400–500°C) | CaCO3 (600–800°C) |
|---|---|---|---|
| 0% | 1.12 | 0.85 | 11.45 |
| 30% | 3.45 | 2.60 | 10.90 |
| 50% | 5.12 | 4.02 | 10.55 |
| 100% | 6.88 | 5.42 | 10.20 |
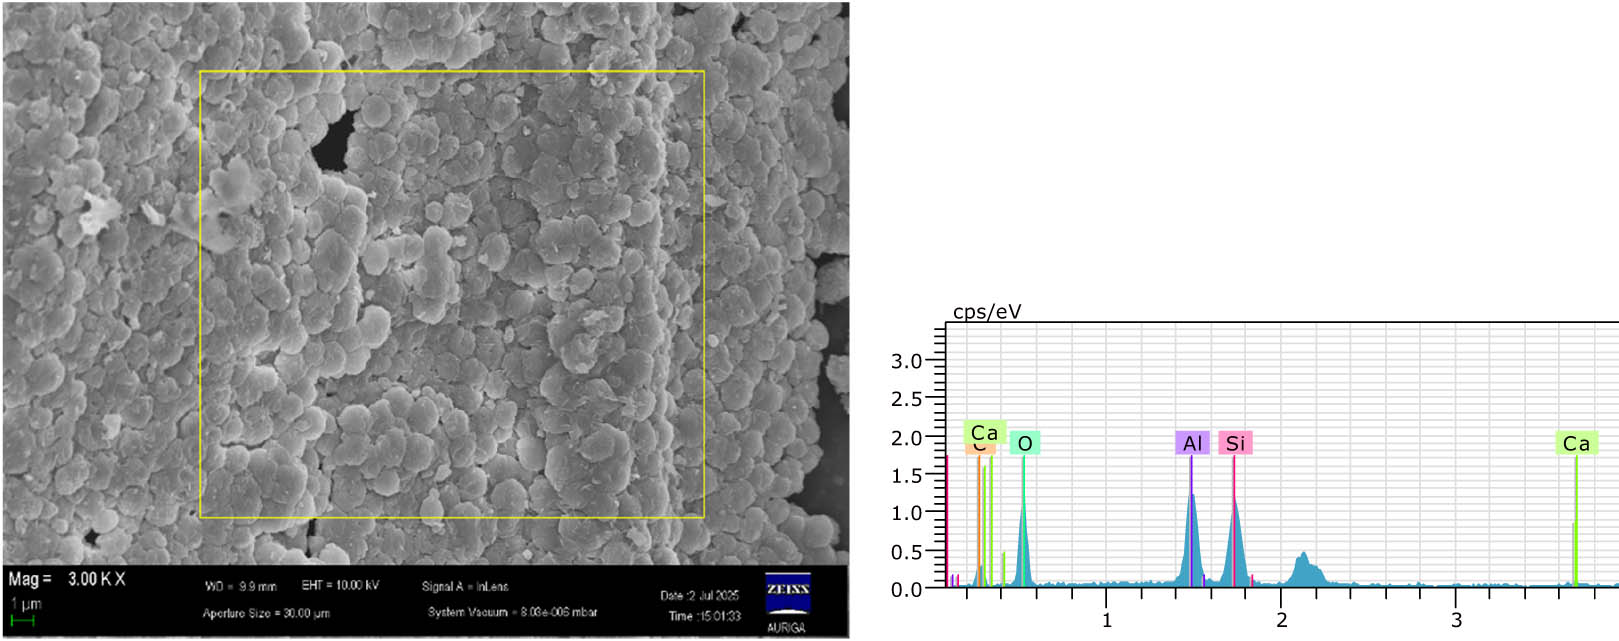
Figure 12
SEM-EDS of raw ash (0%): Silica-carbon-rich porous shards.
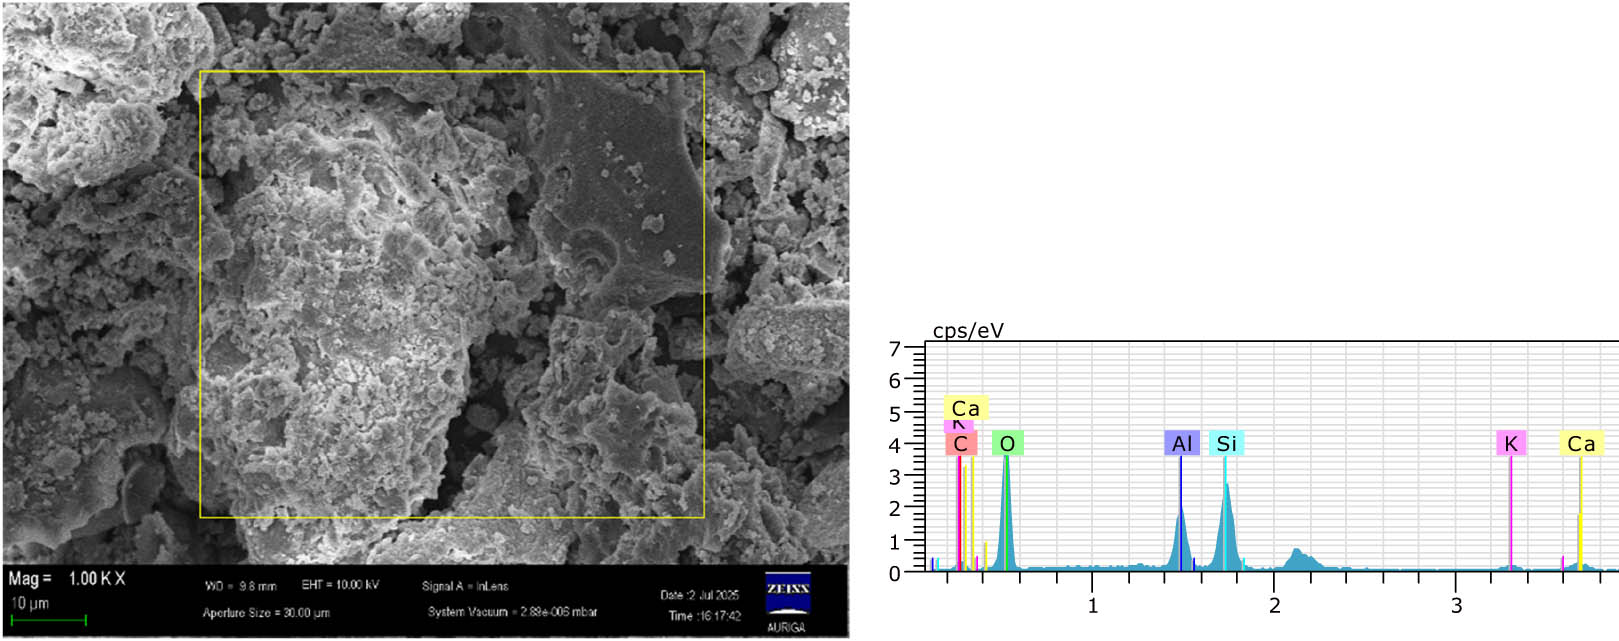
Figure 13
SEM-EDS of 30% humidified ash: Aggregation onset.
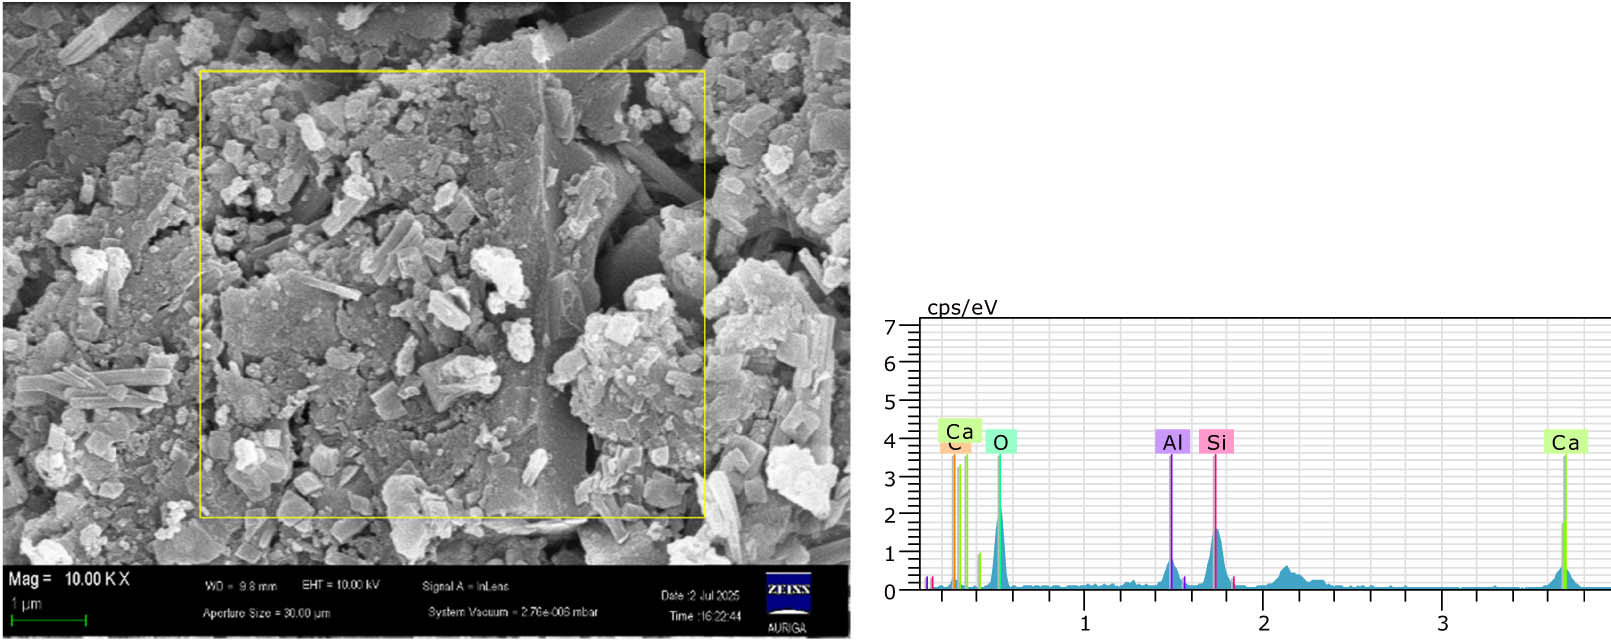
Figure 14
SEM-EDS of 50% humidified ash: Dense Portlandite clusters.
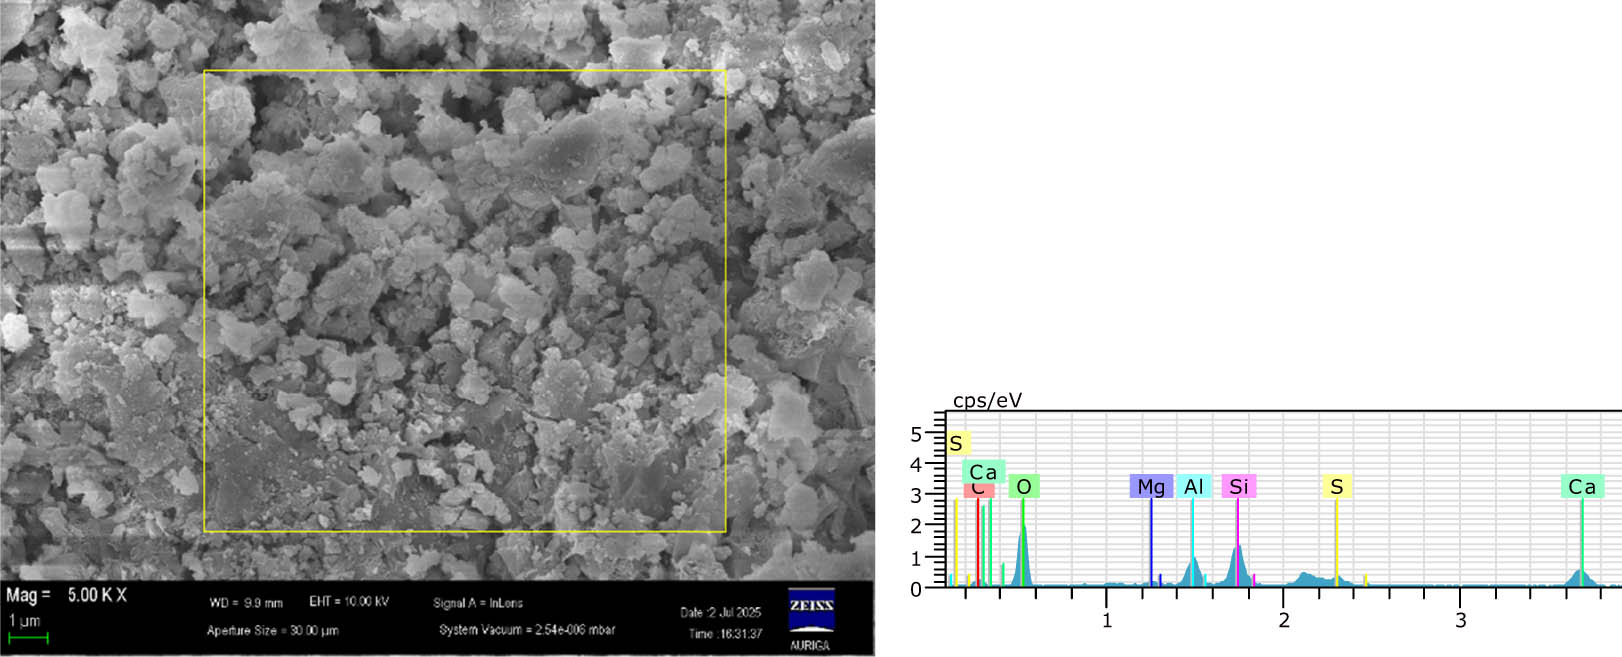
Figure 15
SEM-EDS of 100% humidified ash: Needle-dense AFt matrix.
Table 7
SEM-EDS localized elemental weight percentage evolution (wt%)
| Element | 0% (Control) | 30% (Humidified) | 50% (Humidified) | 100% (Humidified) |
|---|---|---|---|---|
| Carbon (C) | 16.23 | 4.64 | 4.99 | 5.31 |
| Oxygen (O) | 35.06 | 49.69 | 46.62 | 44.90 |
| Magnesium (Mg) | ─ | ─ | ─ | 0.23 |
| Aluminum (Al) | 19.06 | 11.39 | 5.80 | 7.33 |
| Silicon (Si) | 26.61 | 24.92 | 19.65 | 16.63 |
| Sulfur (S) | ─ | ─ | ─ | 4.16 |
| Calcium (Ca) | 3.04 | 6.90 | 22.94 | 21.43 |
Table 8
Accelerated linear expansion results for stabilized SRF ash (%)
| Humidification | 0 Day | 1 Day | 2 Day | 3 Day | 7 Day |
|---|---|---|---|---|---|
| 0% | 1.62 ± 0.12 | ─ | ─ | ─ | ─ |
| 30% | 1.14 ± 0.09 | 0.39 ± 0.04 | 0.22 ± 0.02 | 0.01 ± 0.01 | 0.01 ± 0.01 |
| 50% | 0.82 ± 0.07 | 0.25 ± 0.03 | 0.15 ± 0.01 | 0.01 ± 0.01 | 0.01 ± 0.01 |
| 100% | 0.55 ± 0.05 | 0.18 ± 0.02 | 0.12 ± 0.01 | 0.01 ± 0.01 | 0.01 ± 0.01 |
Table 9
28-day drying shrinkage rate of SRF ash mortar (%)
| Humidification | 7 Day | 14 Day | 21 Day | 28 Day |
|---|---|---|---|---|
| 0% | 0.12 ± 0.01 | 0.18 ± 0.02 | 0.22 ± 0.03 | 0.25 ± 0.03 |
| 30% | 0.25 ± 0.02 | 0.38 ± 0.03 | 0.45 ± 0.04 | 0.52 ± 0.04 |
| 50% | 0.48 ± 0.03 | 0.62 ± 0.04 | 0.78 ± 0.05 | 0.88 ± 0.06 |
| 100% | 0.72 ± 0.05 | 0.98 ± 0.06 | 1.10 ± 0.07 | 1.21 ± 0.08 |
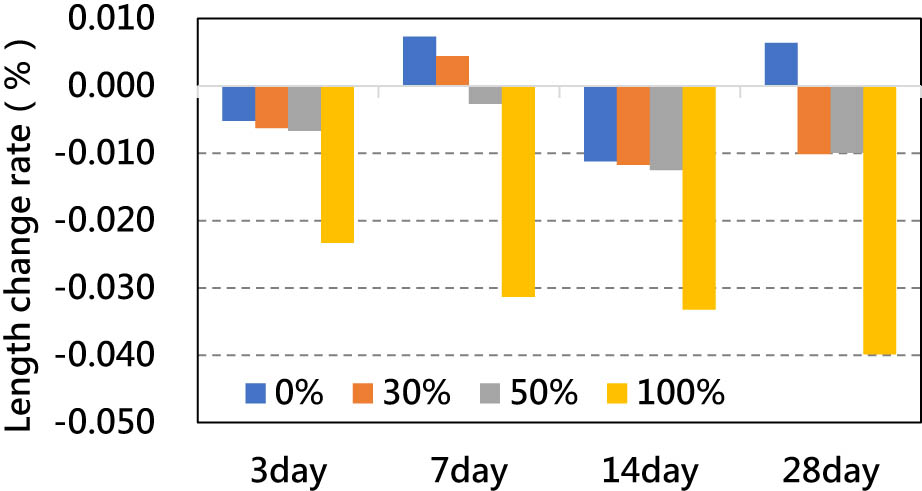
Figure 16
28-day length change rate (drying shrinkage) of SRF co-firing mortars.
Table 10
Suitable balance assessment vs engineering and safety limits
| Criteria | 30% optimized group value | Safety limit/specification value | Judgment result |
|---|---|---|---|
| 7-day linear expansion rate | 0.39% | <0.50% (CNS 15311) | Pass |
| 28-day drying shrinkage rate | 0.52% | <0.60% (Controlled low-strength material) | Pass |
| Lead (Pb) leaching concentration | <0.12 mg/L | <5.0 mg/L (Toxicity characteristic leaching procedure) | Pass |
| Stabilization efficiency | 100% | Industrial application requirements | Excellent |