
Table 1
Quantitative comparison with representative Mg-based composites reinforced with layered solid lubricants (WS2/MoS2).
| Matrix/reinforcement | Reinforcement level | Tribo-pair and environment | Test conditions (reported) | Key quantitative tribology metric(s) |
|---|---|---|---|---|
| Extruded Mg/nano-WS2 | 0–2.0 wt% | Pin-on-disk vs GCr15 steel, dry | 20 N (also 10, 30 N), 0.1 m s−1, 1,000 m | COF: ∼0.45 → ∼0.18 (Mg → Mg–2.0WS2, 20 N). Specific wear rate: ∼1.8 × 10⁻4 → ∼1.5 × 10⁻5 mm3 (N m)−1 (20 N). (This work) |
| Mg MMCs with WS2 + SiC | 5 wt% WS2 + 15–20 wt% SiC | Ball-on-disc vs Al2O3, polyalphaolefin (PAO) base oil | 1–4 N, 22.5 mm s−1; RT & 110°C | Average COF (MMCs): 0.1–0.2 (vs pure Mg 0.16–0.46) [47]. |
| Mg MMC2 (WS2 + 20 wt% SiC) | 5 wt% WS2 + 20 wt% SiC | Ball-on-disc vs Al2O3, PAO oil | RT, 4 N | Wear rate: 0.78 × 105 µm3 (N m)−1 = 7.8 × 10⁻5 mm3 (N m)−1 (reported text) [47]. |
| Mg MMC1 vs MMC2 (WS2 + SiC) | 5 wt% WS2 + 15–20 wt% SiC | Ball-on-disc vs Al2O3, PAO oil | 110°C, 4 N | Wear rate: MMC2 2.03 × 105 μm3 (N m)−1 (=2.03 × 10⁻4 mm3 (N m)−1) vs MMC1 3.62 × 105 μm3 (N m)−1 (=3.62 × 10⁻4 mm3 (N m)−1) [47]. |
| AZ31/WS2 nanotubes | 0.1 wt% | Wear test reported (metric via mass loss and depth; COF not tabulated in text) | Conditions not fully quantified in the excerpted text | Wear weight loss: AZ31 1.5608 mg vs AZ31/WS2 1.035 mg; penetration depth: 170.8 → 143.1 µm with WS2 nanotubes [48]. |
| Mg/MoS2 (also Gr) | 5–10% (mass fraction) | Pin-on-disc vs EN31 steel, dry | 2–15 N, 3.14 m s−1, 2,200 m | Data presented graphically: composites show lower COF than pure Mg, and Mg–10MoS2 exhibits the lowest COF; wear loss of composites is significantly lower than matrix [49]. |
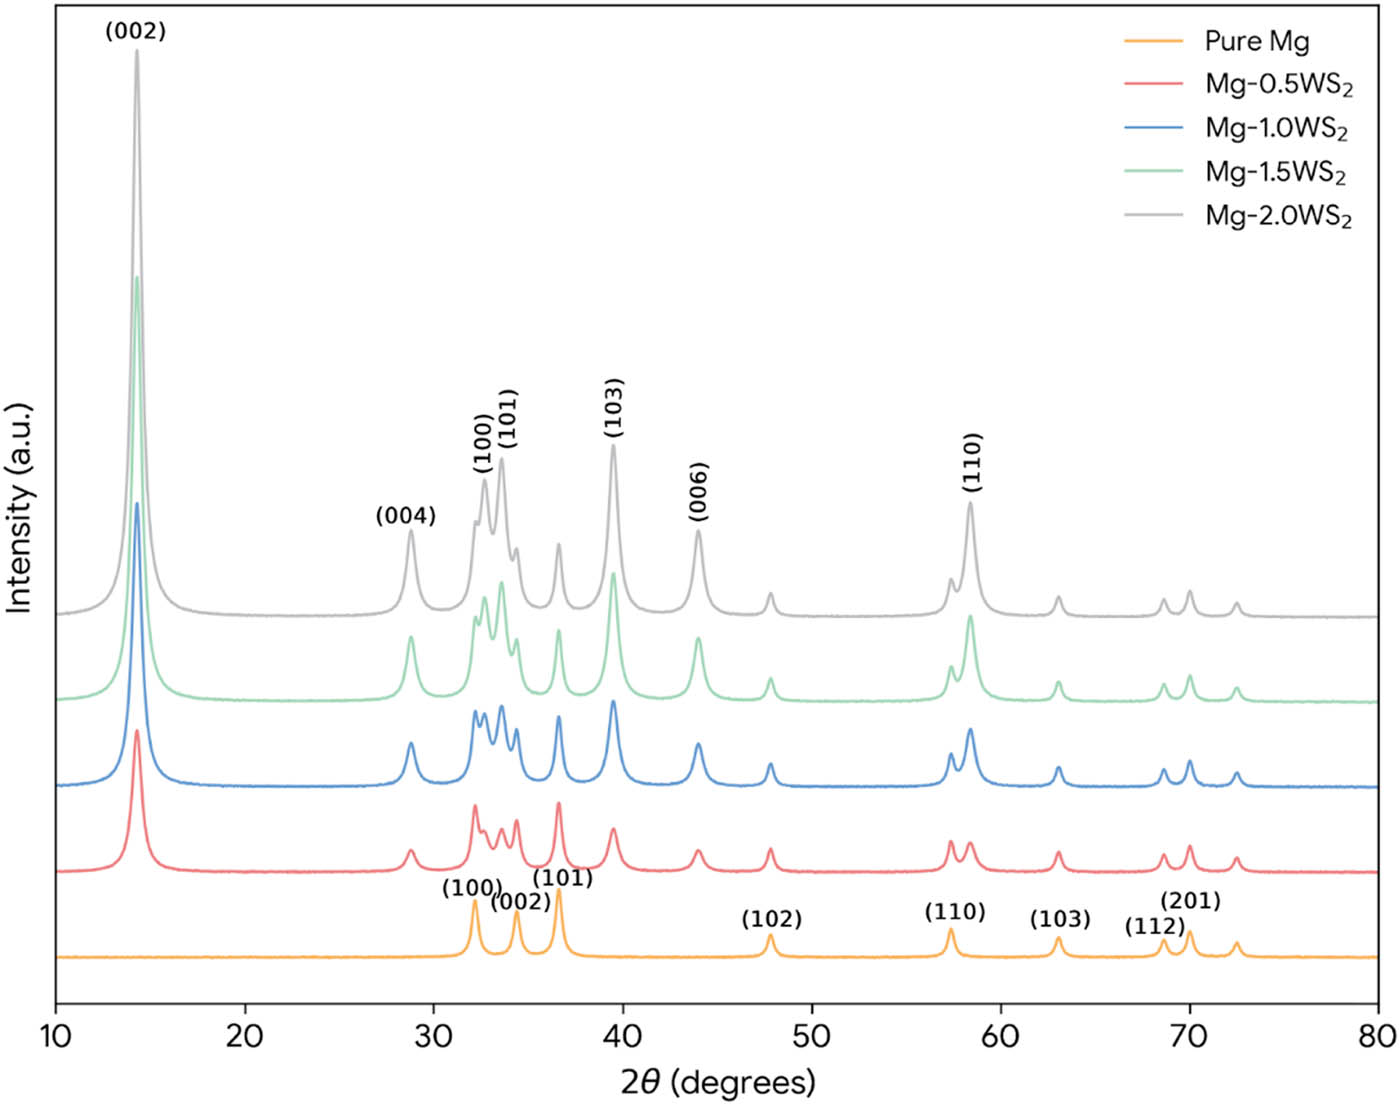
Figure 1
XRD patterns of the extruded pure Mg and Mg–WS2 composites.
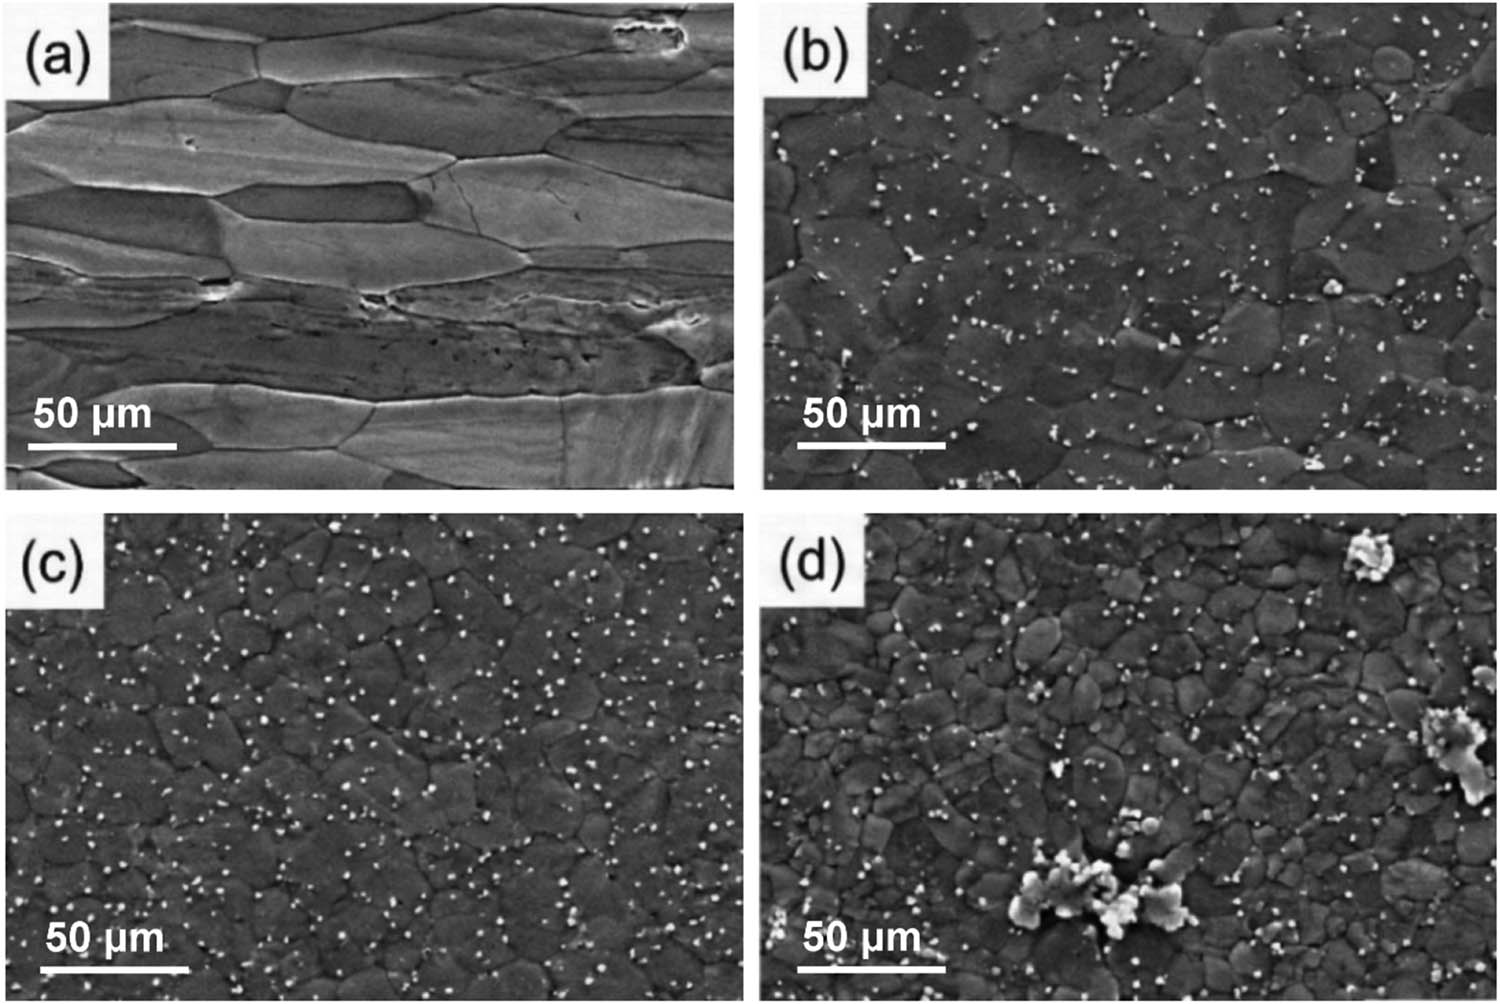
Figure 2
SEM micrographs of the extruded (a) pure Mg, (b) Mg–0.5WS2, (c) Mg–1.0WS2, and (d) Mg–2.0WS2 composites.
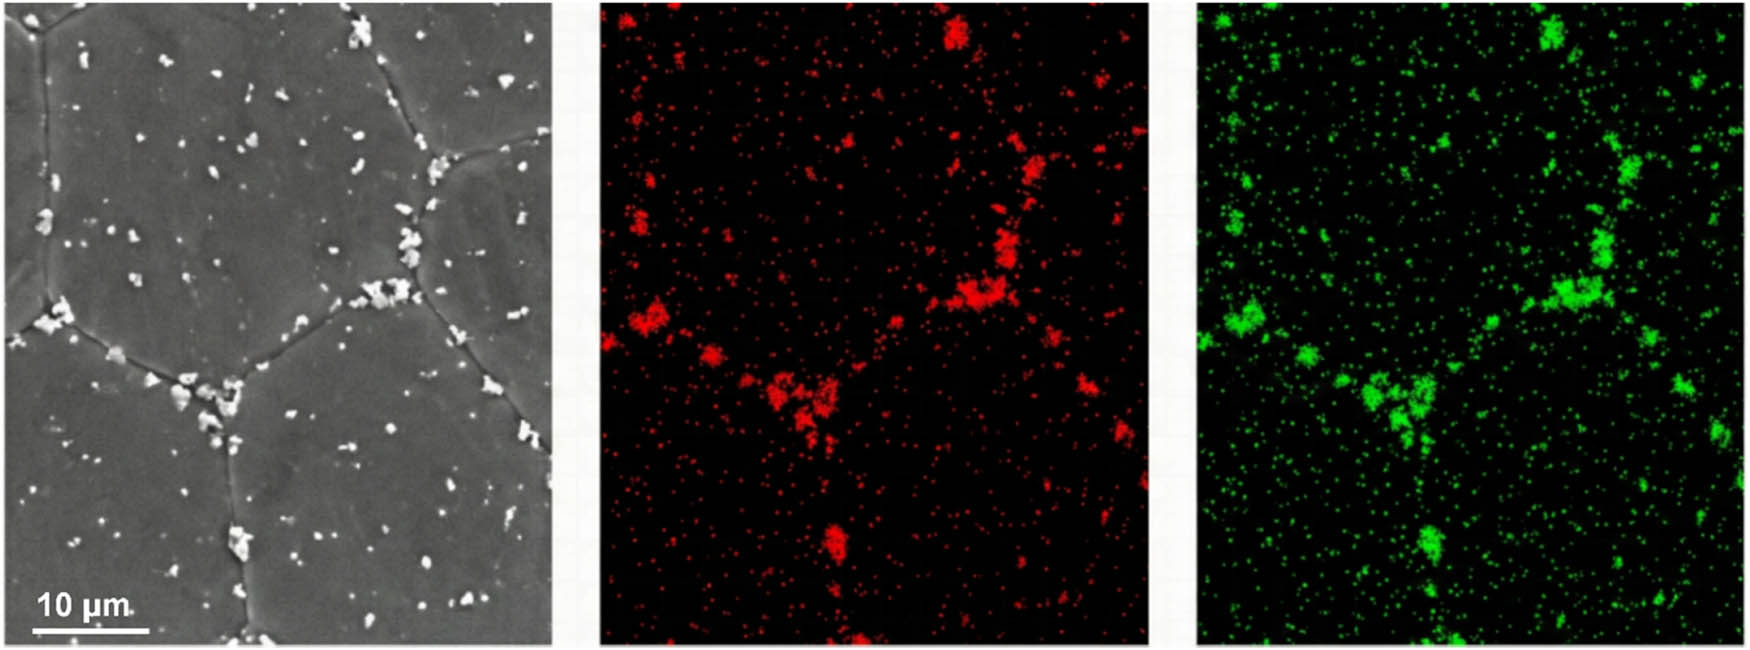
Figure 3
High-magnification SEM image and corresponding EDS elemental maps of the Mg–1.5WS2 composite, showing the distribution of W and S.
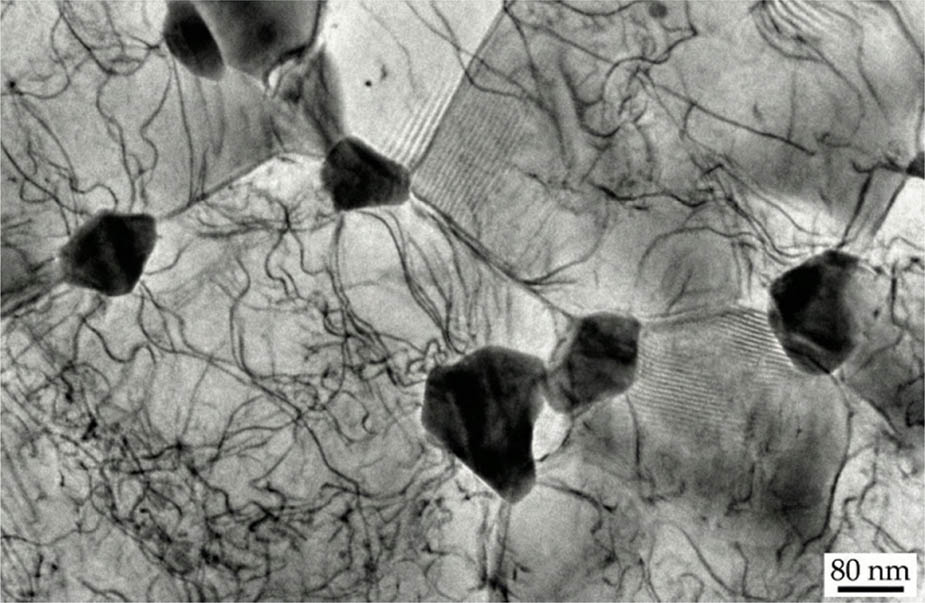
Figure 4
TEM micrograph of the Mg–1.5WS2 composite, revealing the nanoscale features of the reinforcement and the matrix.
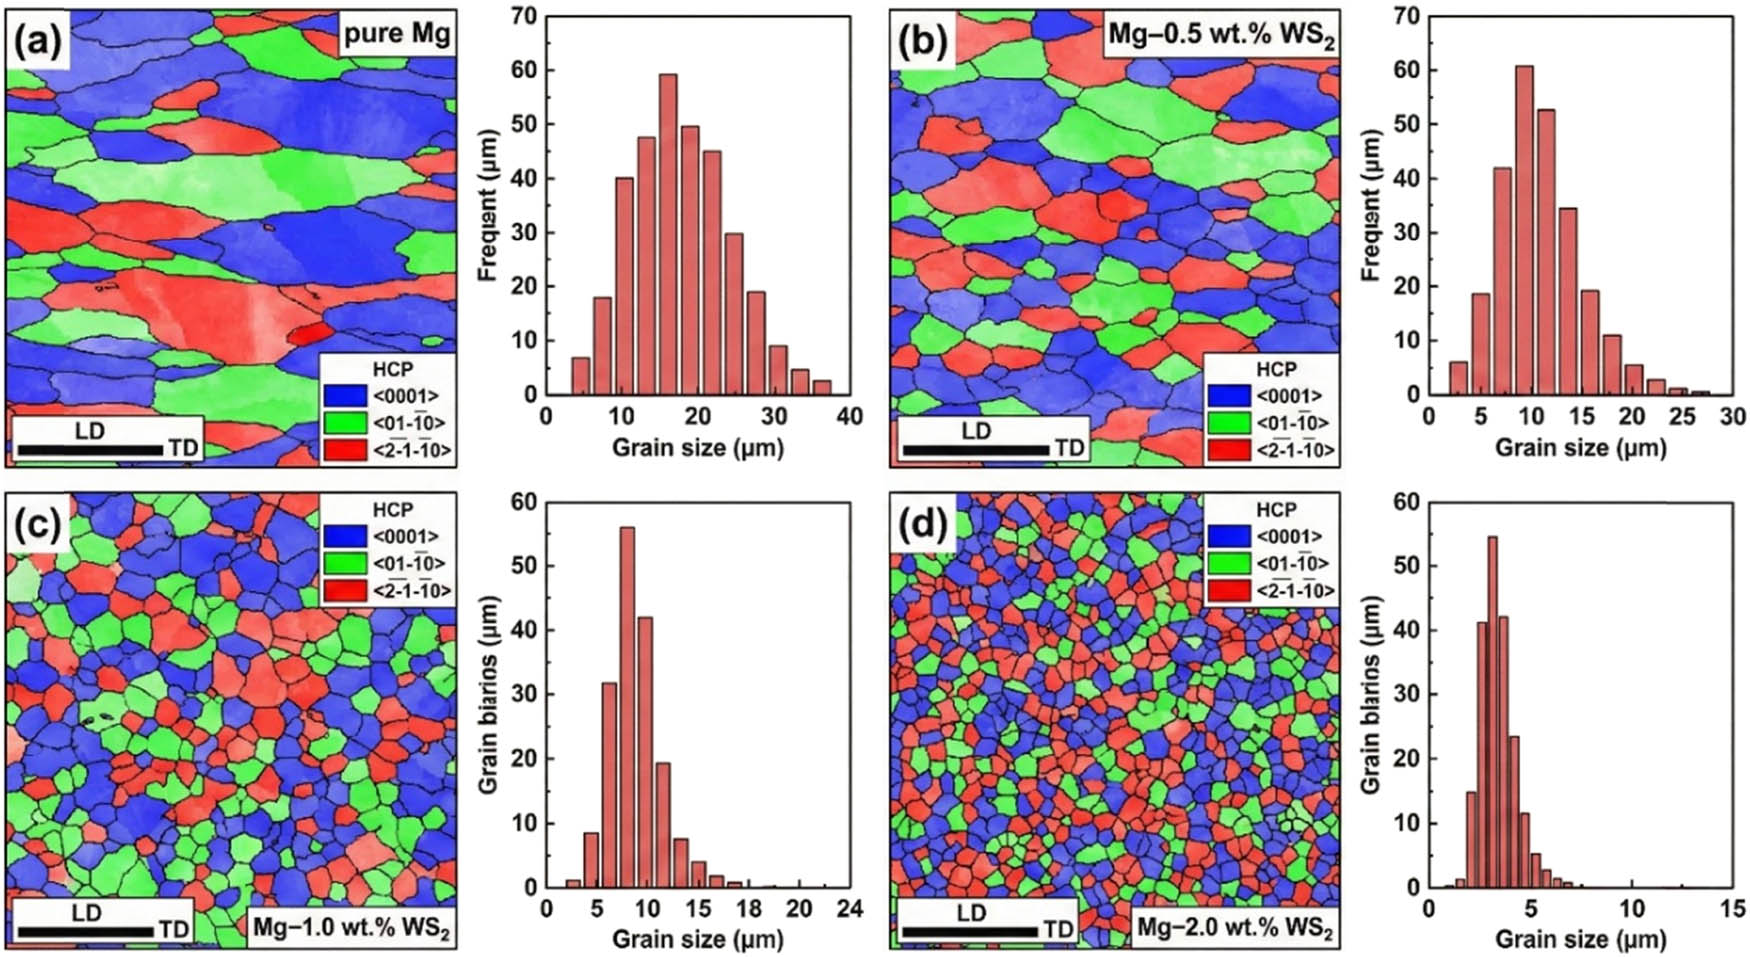
Figure 5
EBSD IPF maps and corresponding grain size distribution histograms for (a) pure Mg, (b) Mg–0.5WS2, (c) Mg–1.0WS2, and (d) Mg–2.0WS2 composites.
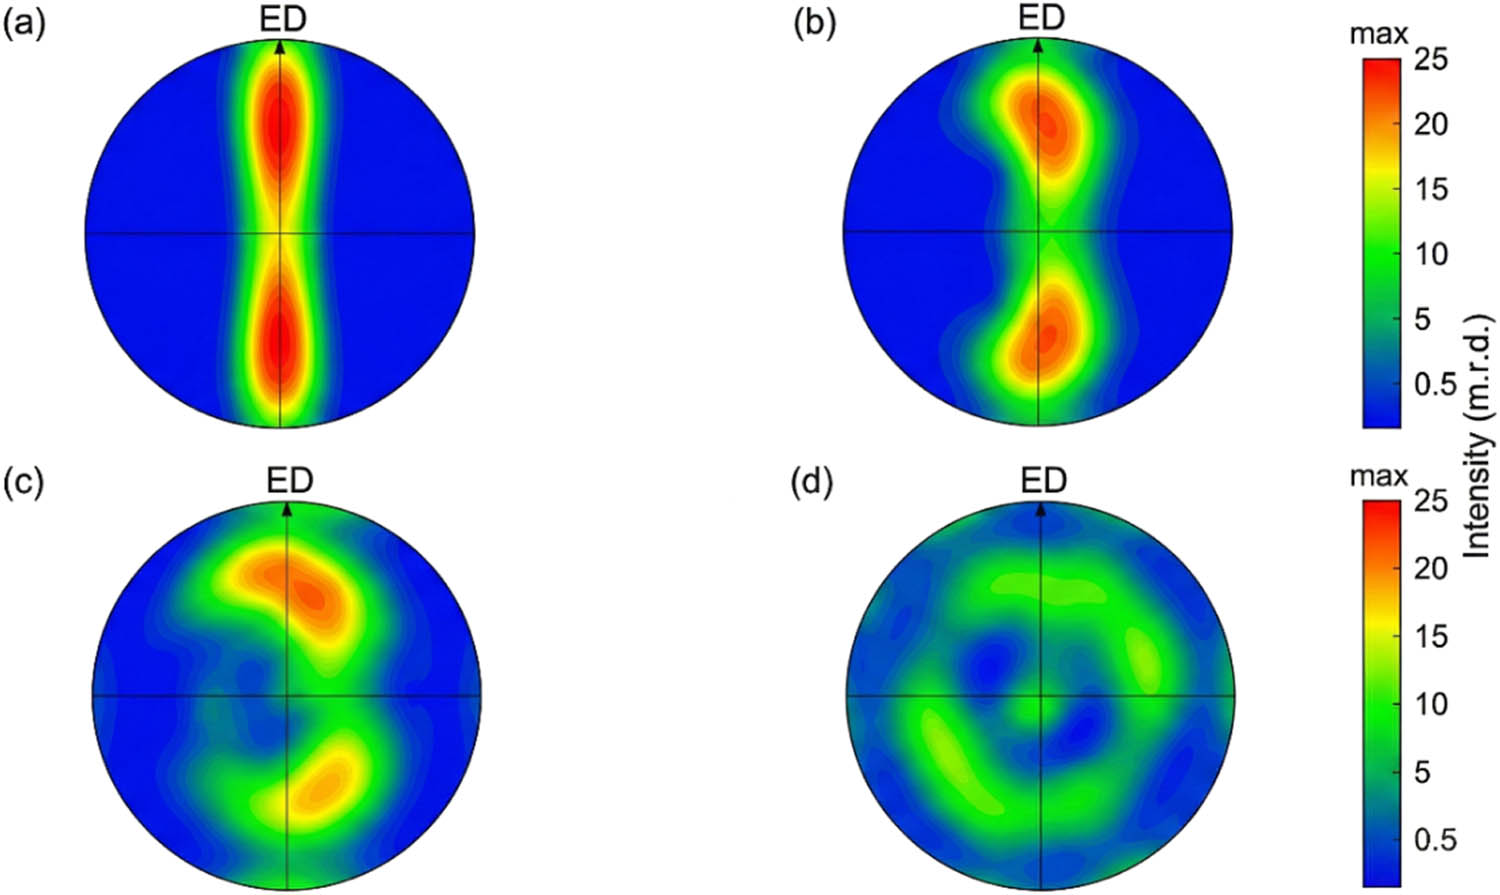
Figure 6
(0001) pole figures of the extruded (a) pure Mg, (b) Mg–0.5WS2, (c) Mg–1.0WS2, and (d) Mg–2.0WS2 composites, showing the texture evolution.
Table 2
Mechanical properties of the extruded pure Mg and Mg–WS2 composites.
| Material | Vickers hardness (HV0.1) | YS (MPa) | UTS (MPa) | Elongation to failure (%) |
|---|---|---|---|---|
| Pure Mg | 58 ± 3 | 135 ± 5 | 210 ± 8 | 18.5 ± 1.2 |
| Mg–0.5WS2 | 68 ± 4 | 160 ± 6 | 245 ± 7 | 16.2 ± 1.0 |
| Mg–1.0WS2 | 76 ± 4 | 185 ± 5 | 275 ± 9 | 14.8 ± 0.9 |
| Mg–1.5WS2 | 85 ± 5 | 205 ± 7 | 300 ± 10 | 12.5 ± 0.8 |
| Mg–2.0WS2 | 92 ± 5 | 220 ± 8 | 315 ± 11 | 10.3 ± 0.7 |
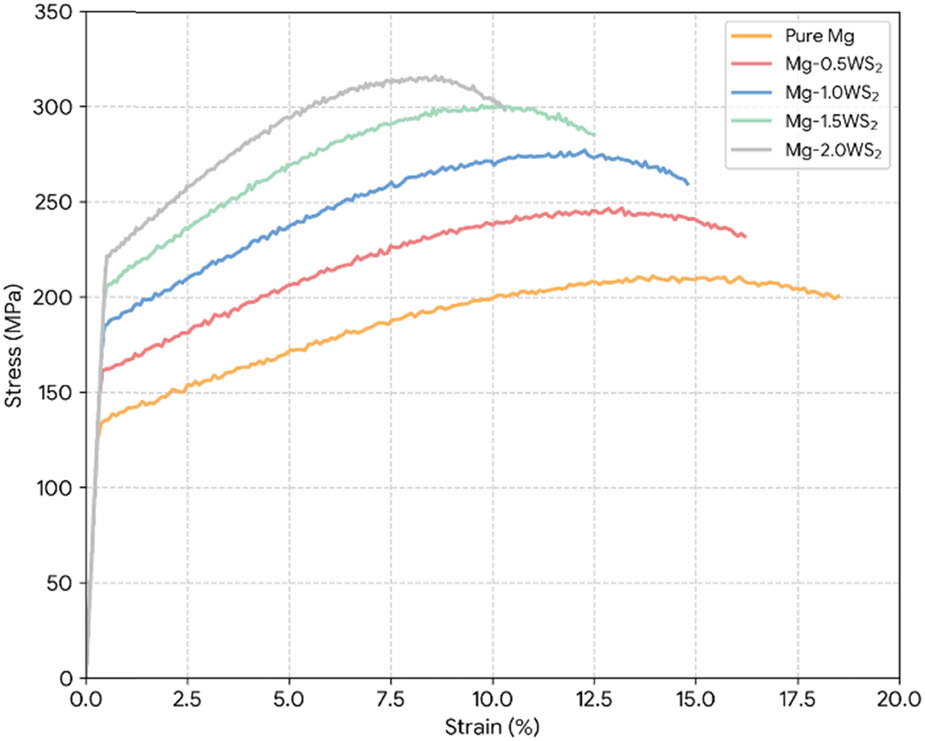
Figure 7
Tensile stress–strain curves of the extruded pure Mg and Mg–WS2 composites.
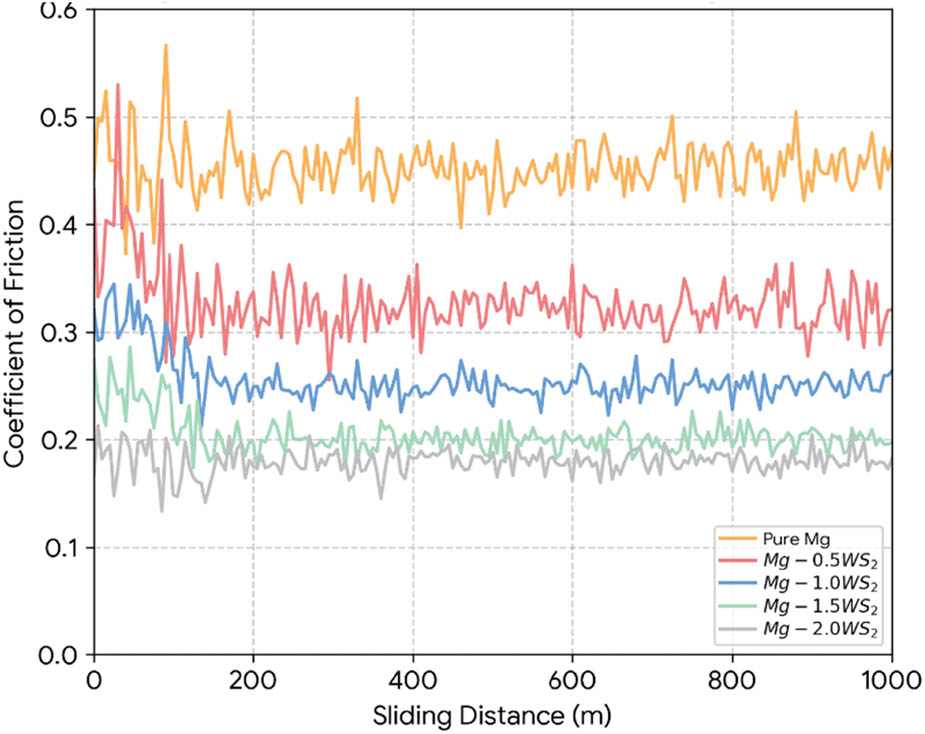
Figure 8
COF as a function of sliding distance for the extruded pure Mg and Mg–WS2 composites under a normal load of 20 N.
Table 3
Steady-state COF of the extruded pure Mg and Mg–WS2 composites at different normal loads.
| Material | COF (10 N) | COF (20 N) | COF (30 N) |
|---|---|---|---|
| Pure Mg | 0.48 ± 0.03 | 0.45 ± 0.02 | 0.42 ± 0.02 |
| Mg–0.5WS2 | 0.35 ± 0.02 | 0.32 ± 0.02 | 0.30 ± 0.01 |
| Mg–1.0WS2 | 0.28 ± 0.02 | 0.25 ± 0.01 | 0.23 ± 0.01 |
| Mg–1.5WS2 | 0.22 ± 0.01 | 0.20 ± 0.01 | 0.18 ± 0.01 |
| Mg–2.0WS2 | 0.20 ± 0.01 | 0.18 ± 0.01 | 0.16 ± 0.01 |
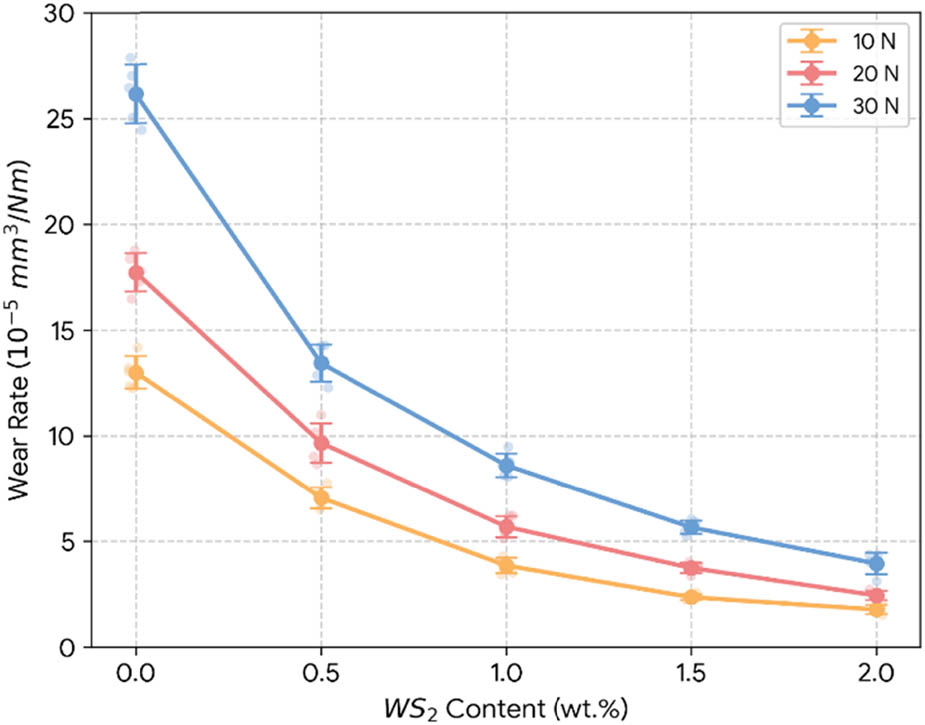
Figure 9
Wear rates of the extruded pure Mg and Mg–WS2 composites as a function of WS2 content at different normal loads.
Table 4
Wear rates of the extruded pure Mg and Mg–WS2 composites at different normal loads.
| Material | Wear rate (10 N) (×10⁻5 mm3 (N m)−1) | Wear rate (20 N) (×10⁻5 mm3 (N m)−1) | Wear rate (30 N) (×10⁻5 mm3 (N m)−1) |
|---|---|---|---|
| Pure Mg | 12.5 ± 1.1 | 18.2 ± 1.5 | 25.8 ± 2.0 |
| Mg–0.5WS2 | 6.8 ± 0.6 | 9.5 ± 0.8 | 13.2 ± 1.1 |
| Mg–1.0WS2 | 4.2 ± 0.4 | 6.1 ± 0.5 | 8.9 ± 0.7 |
| Mg–1.5WS2 | 2.5 ± 0.2 | 3.8 ± 0.3 | 5.5 ± 0.4 |
| Mg–2.0WS2 | 1.8 ± 0.2 | 2.5 ± 0.2 | 3.9 ± 0.3 |
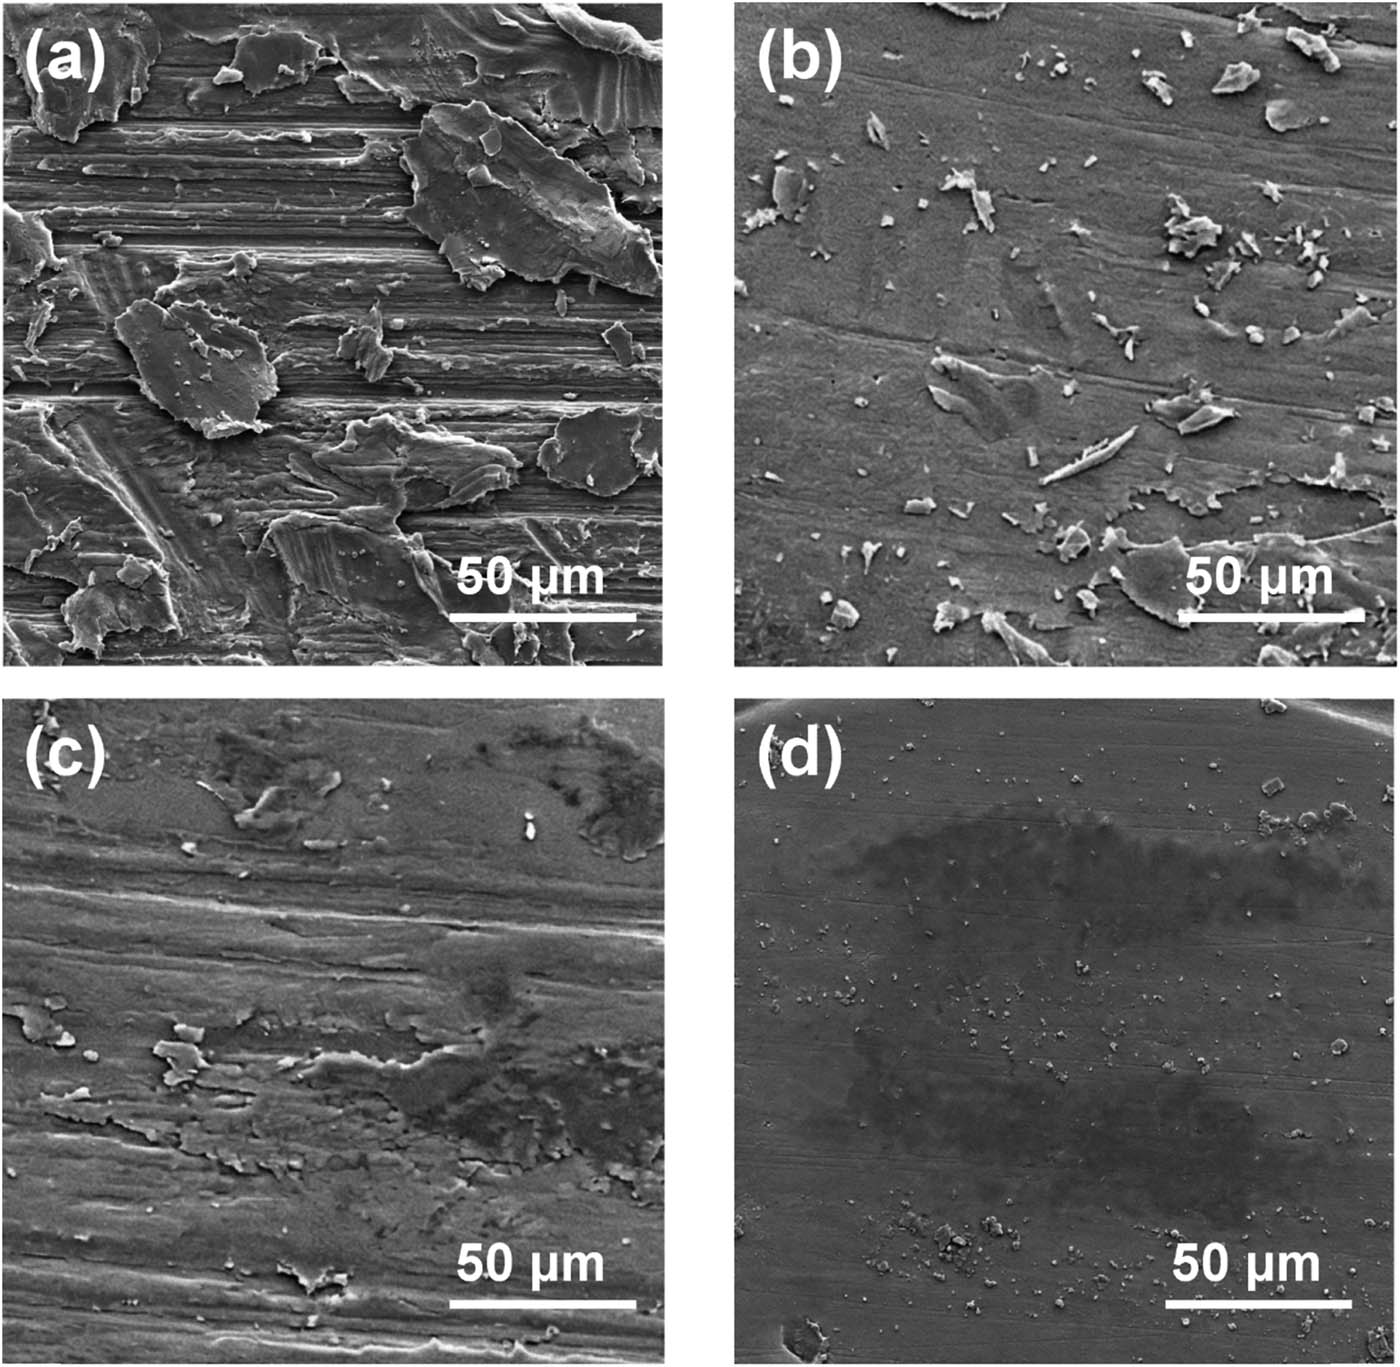
Figure 10
SEM micrographs of worn surfaces after dry sliding under a load of 20 N: (a) pure Mg, (b) Mg–1.0WS2, (c) Mg–1.5WS2, and (d) Mg–2.0WS2 composites.
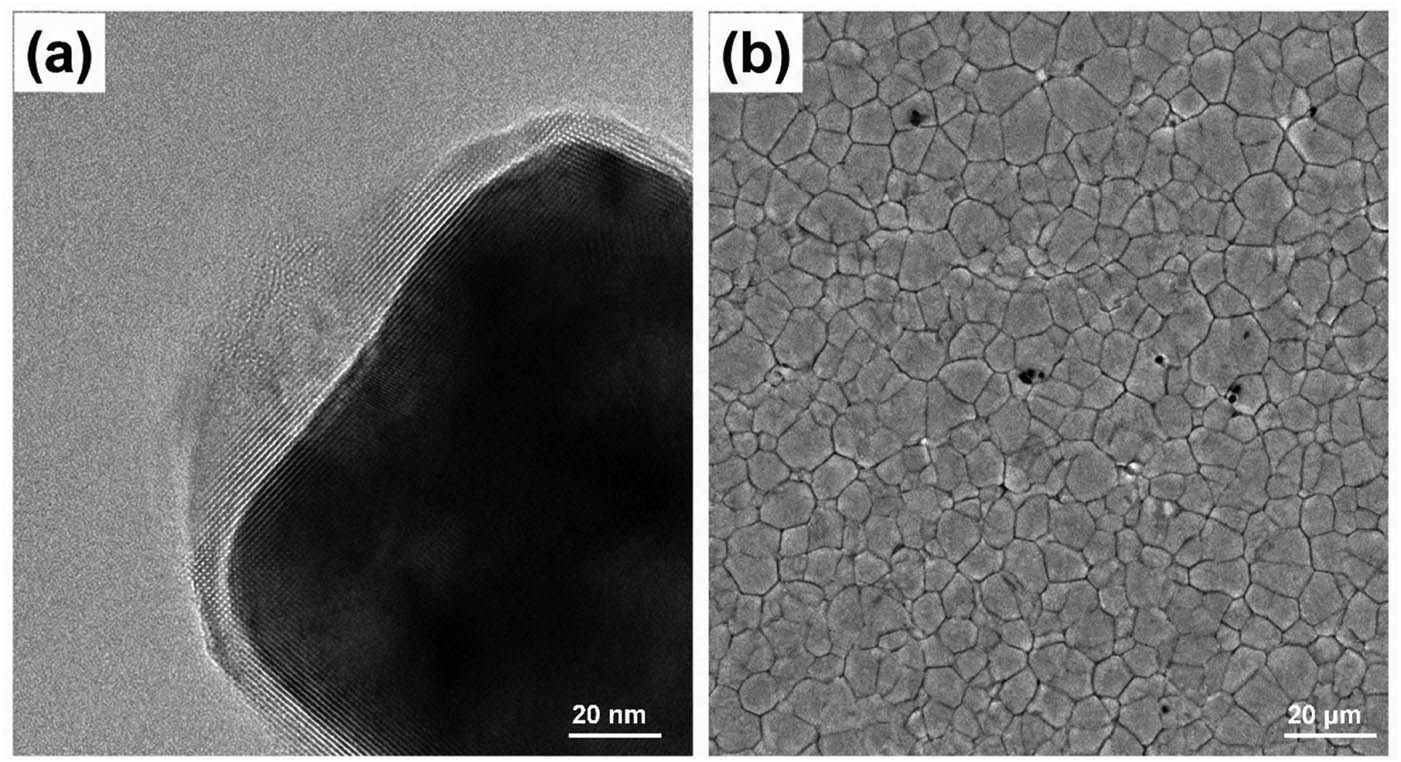
Figure 11
(a) High-resolution micrograph showing the clean and well-bonded interface between a WS2 nanoparticle and the Mg matrix. (b) Micrograph illustrating the refined and equiaxed grain structure in the Mg–1.0WS2 composite.