
Table 1
Basic information on raw materials.
| Raw materials | Main chemical compositions | SO3 | Specific gravity | Surface area (g/cm2) | PSAI (%) at 28 days | |||
|---|---|---|---|---|---|---|---|---|
| CaO | SiO2 | Al2O3 | Fe2O3 | |||||
| CFA | 45.89 | 19.99 | 15.61 | 4.07 | 10.78 | 2.73 | 4,560 | 108 |
| FA | 4.80 | 48.60 | 34.31 | 6.46 | 0.71 | 2.21 | 10,800 | 86 |
| RUFA | 11.75 | 43.65 | 21.95 | 13.31 | 0.30 | 2.25 | 33,600 | 128 |
| slag | 44.68 | 24.85 | 20.47 | 0.67 | 1.79 | 2.88 | 5,840 | 115 |
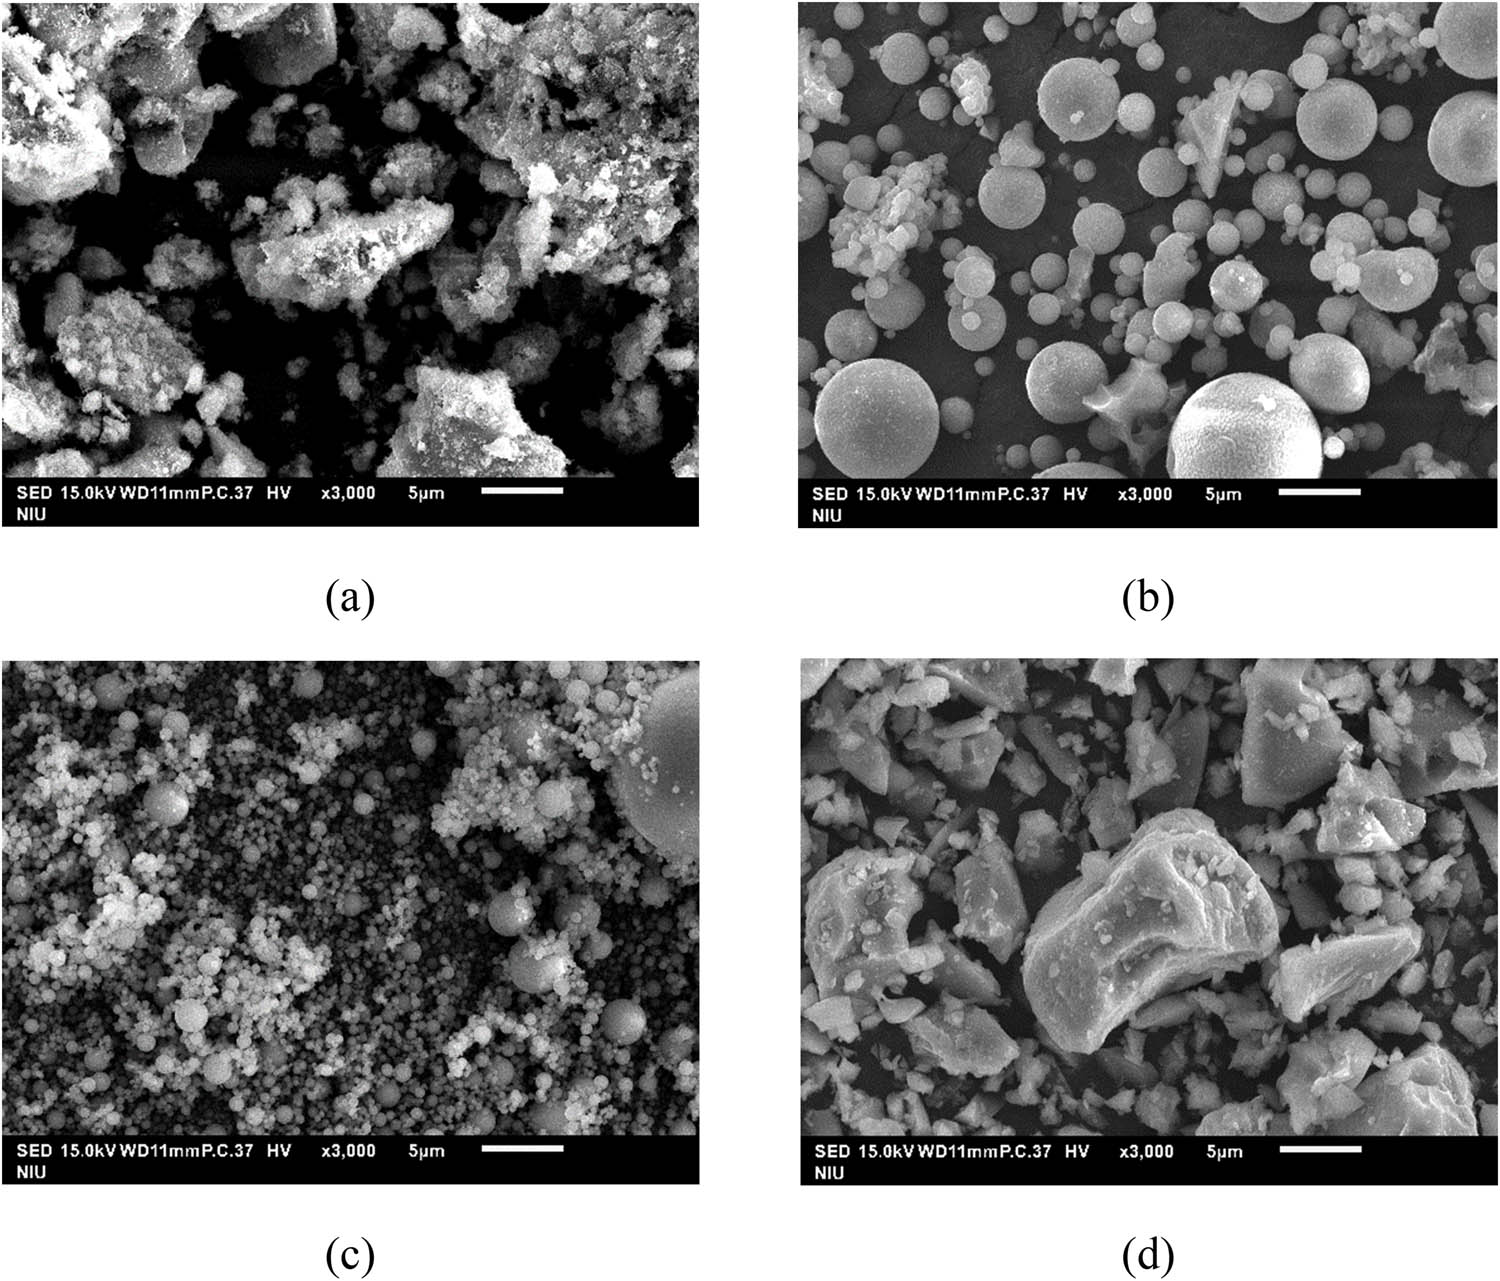
Figure 1
SEM Photos of raw materials of (a) CFA, (b) FA, (c) RUFA, and (d) slag.
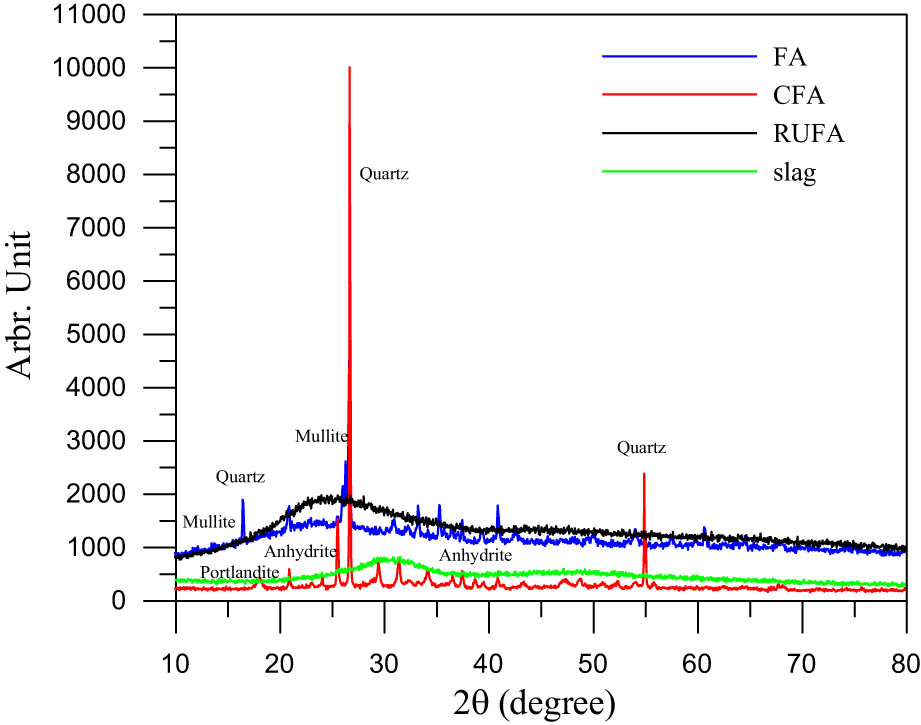
Figure 2
XRD patterns of raw materials.
Table 2
Mix proportions for first stage (unit: g).
| Mix no. | w/b (l/b) | CFA | slag | RUFA | FA | water | NaOH | Na2SiO3 |
|---|---|---|---|---|---|---|---|---|
| C1 | 0.55 | 400 | 600 | — | — | 550 | — | — |
| C2 | 0.55 | 350 | 600 | 50 | — | 550 | — | — |
| C3 | 0.55 | 300 | 600 | 100 | — | 550 | — | — |
| C4 | 0.55 | 300 | 600 | — | 100 | 550 | — | — |
| A1 | 0.55 | 800 | 200 | — | — | 399.7 | 30.2 | 120.1 |
| A2 | 0.55 | 600 | 400 | — | — | 399.7 | 30.2 | 120.1 |
| A3 | 0.55 | 300 | 700 | — | — | 399.7 | 30.2 | 120.1 |
| A4 | 0.55 | 200 | 800 | — | — | 324.5 | 45.3 | 180.2 |
Table 3
Mix proportions for second stage (unit: g).
| Mix no. | w/b (l/b) | CFA | slag | RUFA | FA | water | NaOH | Na2SiO3 |
|---|---|---|---|---|---|---|---|---|
| C1* | 0.47 | 400 | 600 | — | — | 470 | — | — |
| C2* | 0.45 | 350 | 600 | 50 | — | 450 | — | — |
| C3* | 0.45 | 300 | 600 | 100 | — | 450 | — | — |
| C4* | 0.45 | 300 | 600 | — | 100 | 450 | — | — |
| A1* | 0.60 | 800 | 200 | — | — | 436.0 | 32.9 | 131.0 |
| A2* | 0.65 | 600 | 400 | — | — | 472.4 | 35.6 | 142.0 |
| A3* | 0.48 | 300 | 700 | — | — | 348.8 | 26.4 | 104.8 |
| A4* | 0.70 | 200 | 800 | — | — | 354.0 | 49.4 | 196.6 |
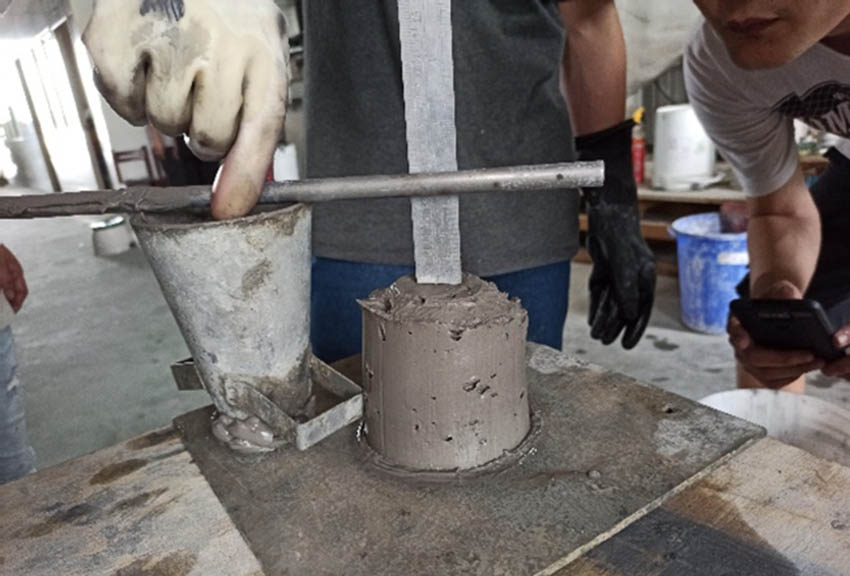
Figure 3
Appearance of the mini-slump test.
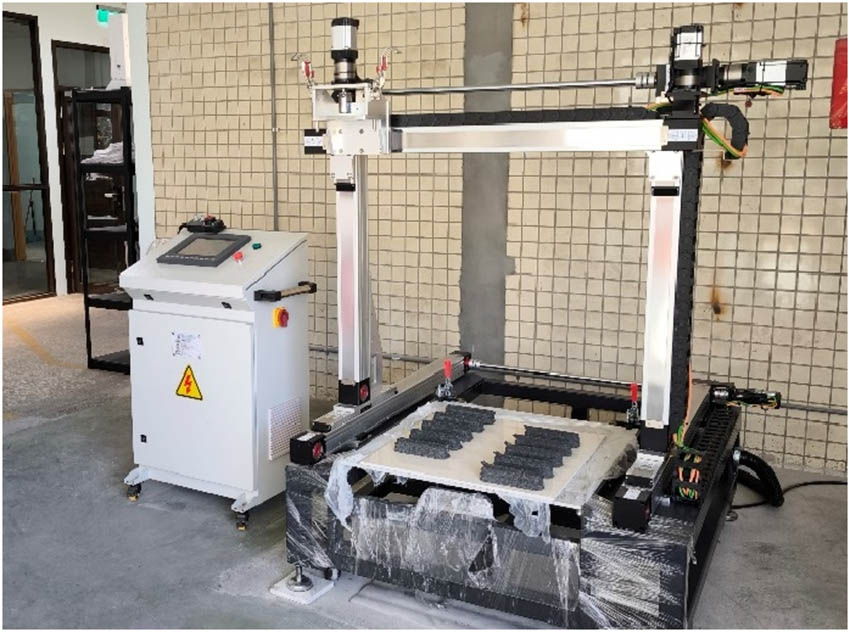
Figure 4
Appearance of the mortar-type 3D printer.
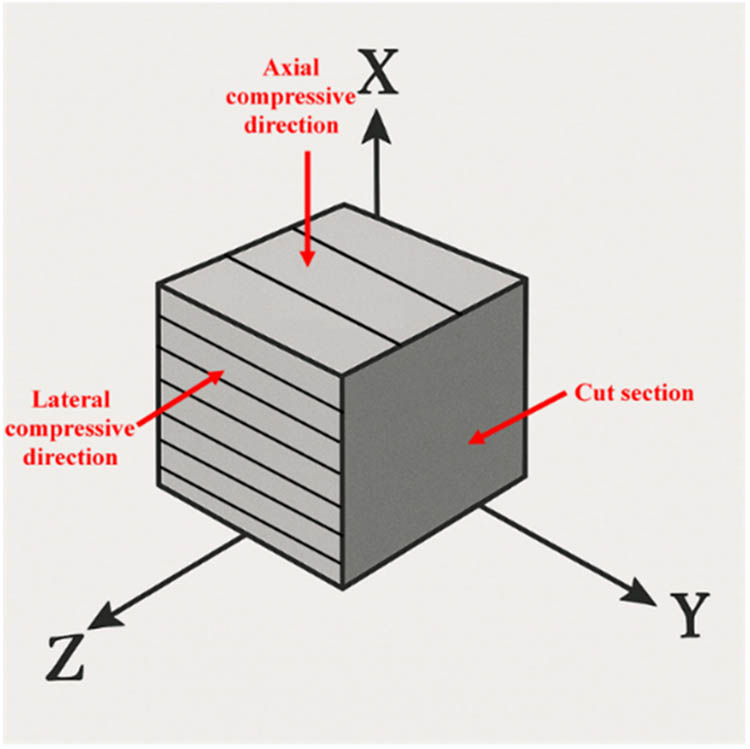
Figure 5
Schematic diagram of the specimen orientation.
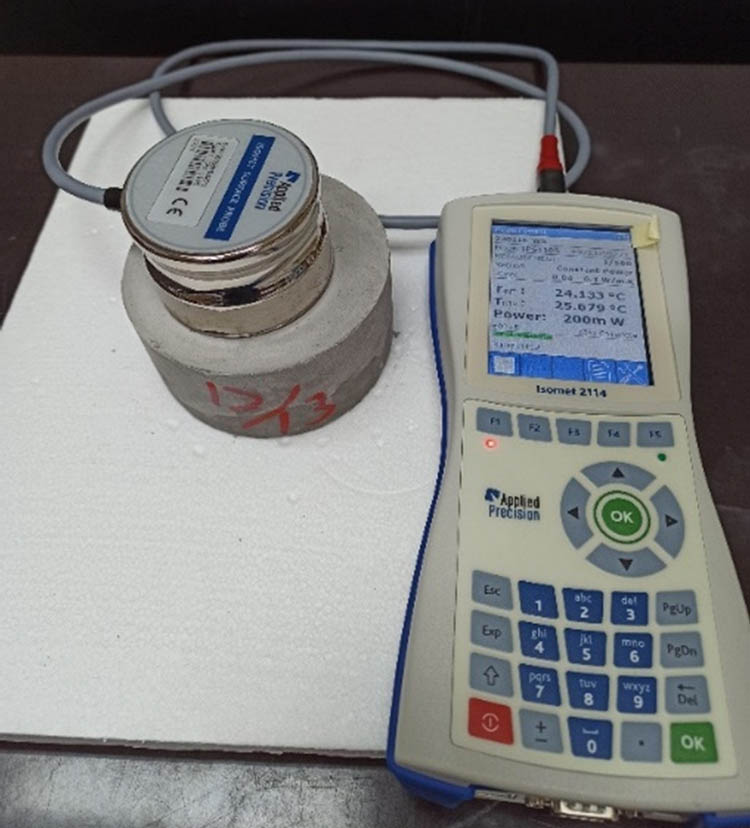
Figure 6
Appearance of the thermal conductivity device.
Table 4
Lists of test methods.
| Type | Experimental | Specification | Specimen size | Test age |
|---|---|---|---|---|
| Fresh properties | Setting time | ASTM C191 | — | — |
| Fluidity | ASTM C1437 | — | — | |
| Mini-slump | ASTM C143 | — | — | |
| Mechanical and thermal properties | Compressive strength (mold casting) | ASTM C109 | 5 cm × 5 cm × 5 cm | 7, 14, 28, 56 |
| Compressive strength (3D printing) | ASTM C109 | 5 cm × 5 cm × 5 cm | 7, 28 | |
| Thermal conductivity | — | ϕ10 cm × 5 cm | 28, 56 | |
| Gap inspection | Optical microscopy (OM) | — | 5 cm × 5 cm × 5 cm for printed specimens | 56 |
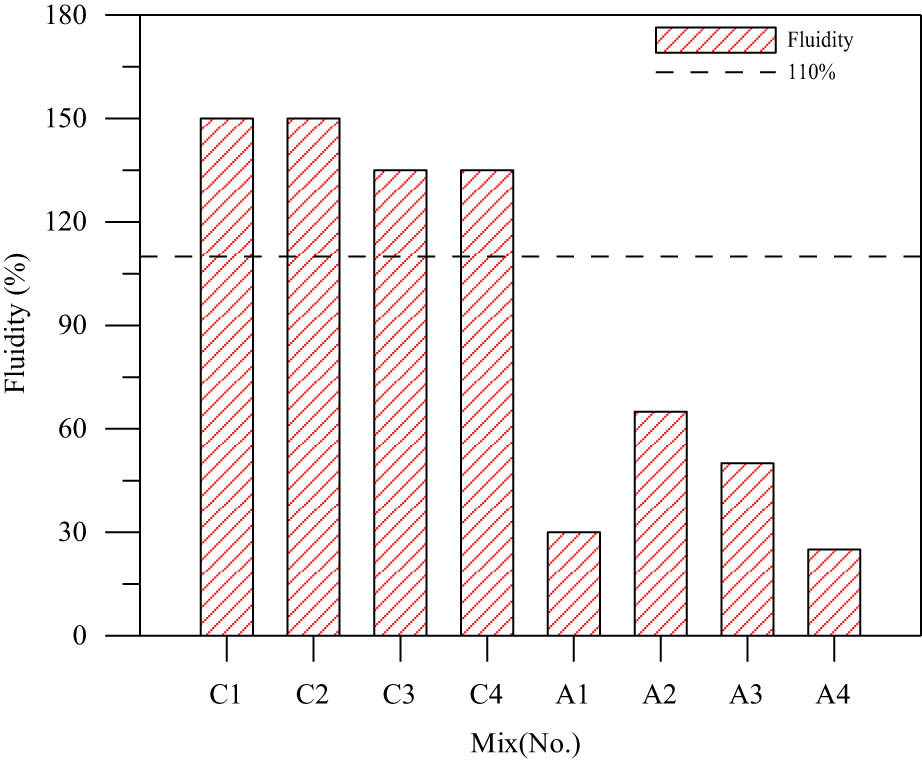
Figure 7
Fluidity histograms.
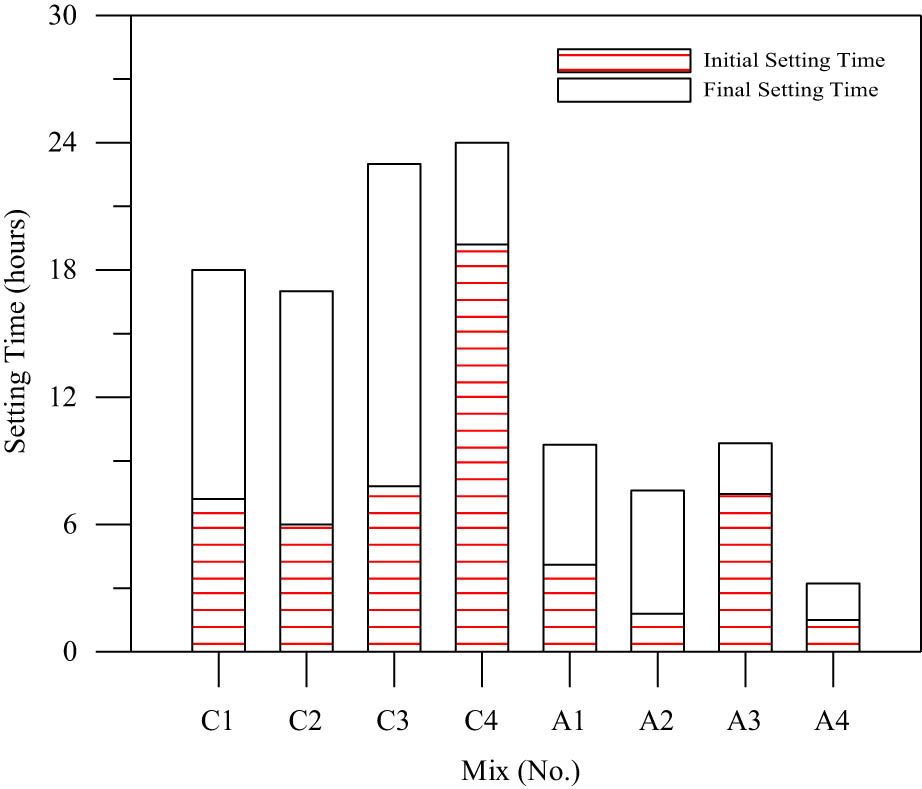
Figure 8
Setting time histograms.
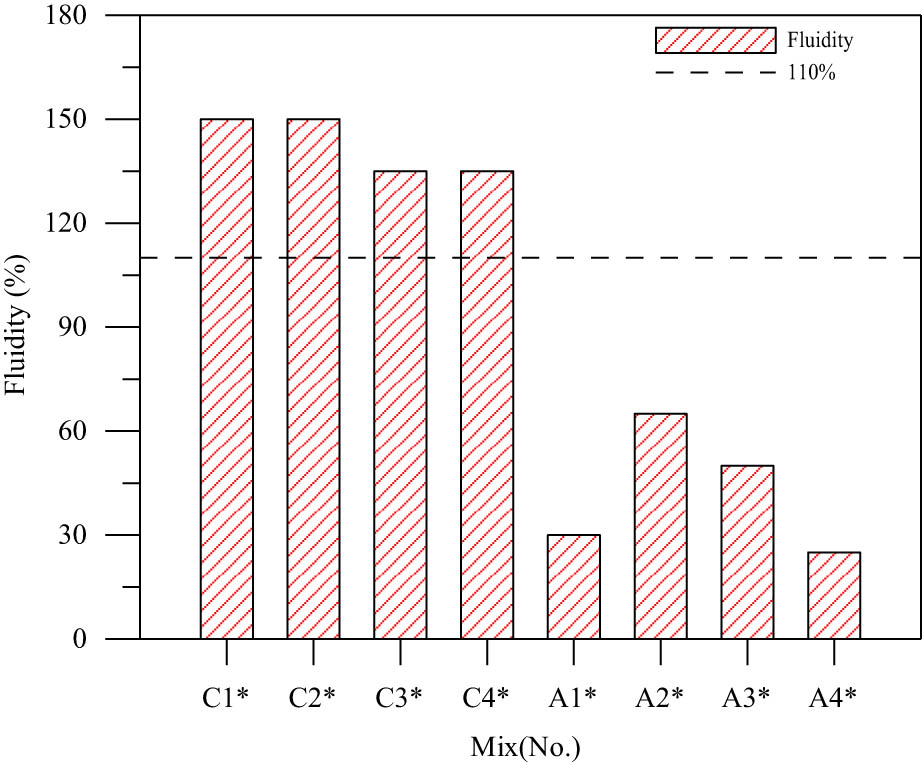
Figure 9
Fluidity histograms designed for 3D printing.
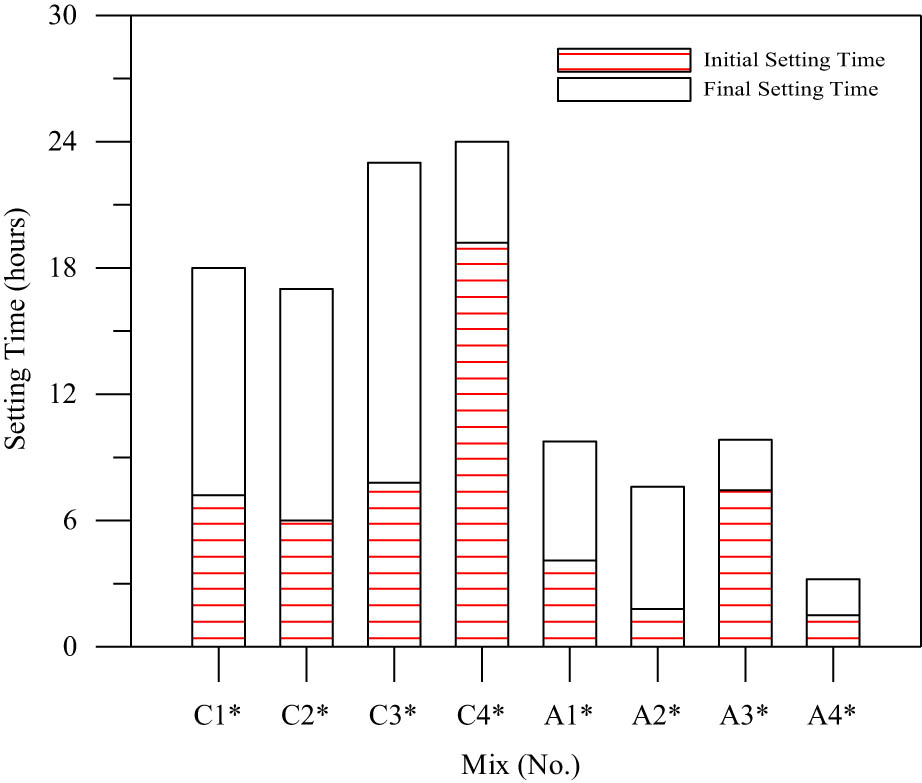
Figure 10
Setting time histograms designed for 3D printing.
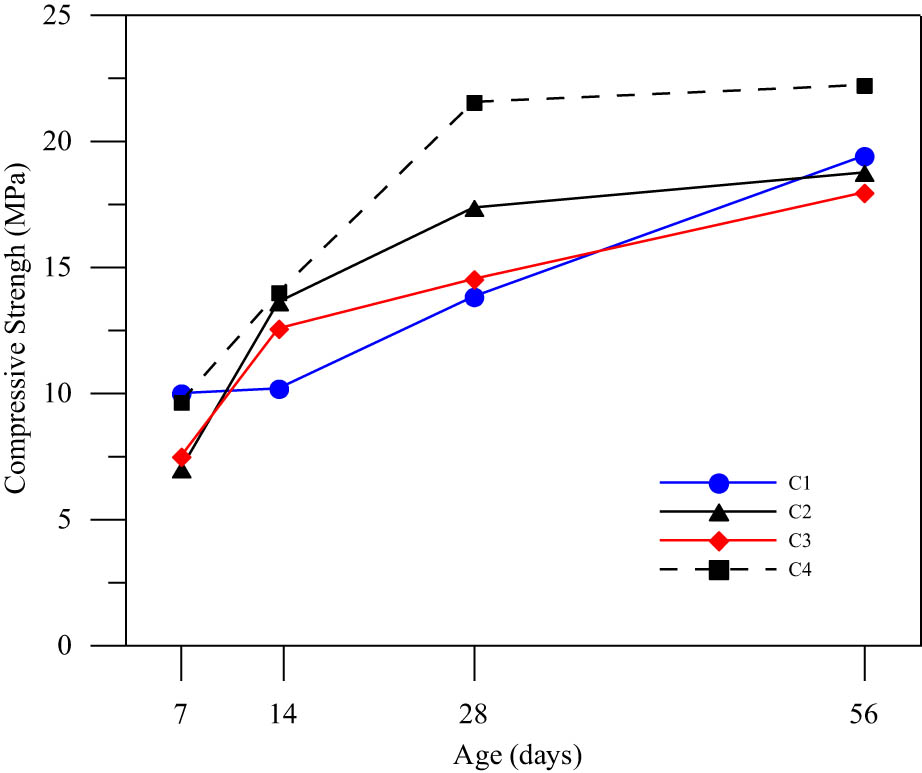
Figure 11
Compressive strength development curves (C1 series, molded specimens).
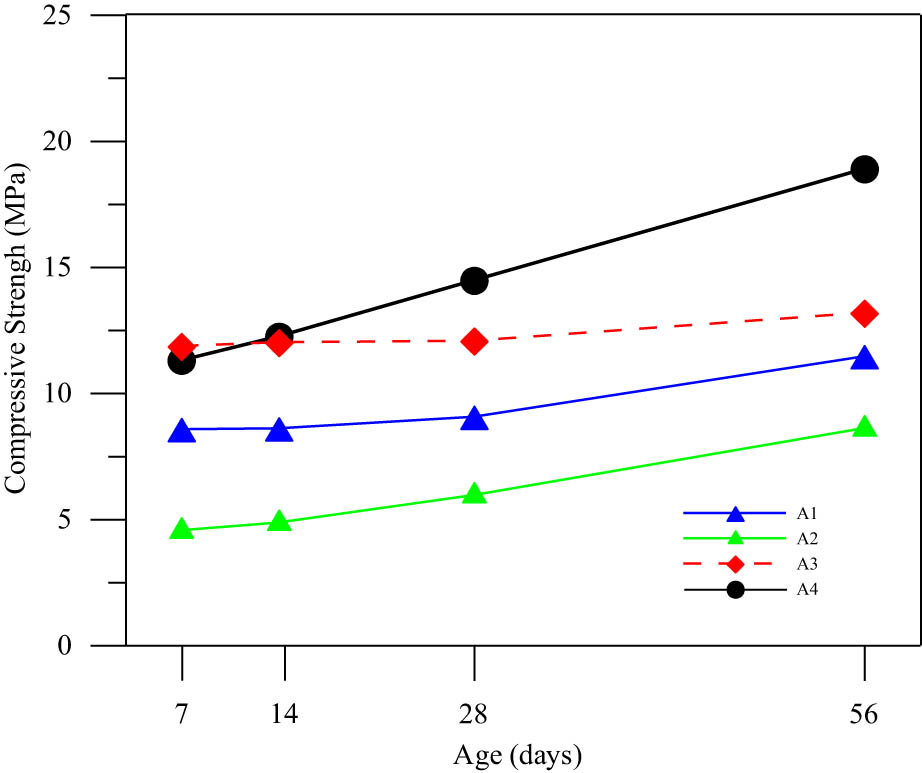
Figure 12
Compressive strength development curves (A1 series, molded specimens).
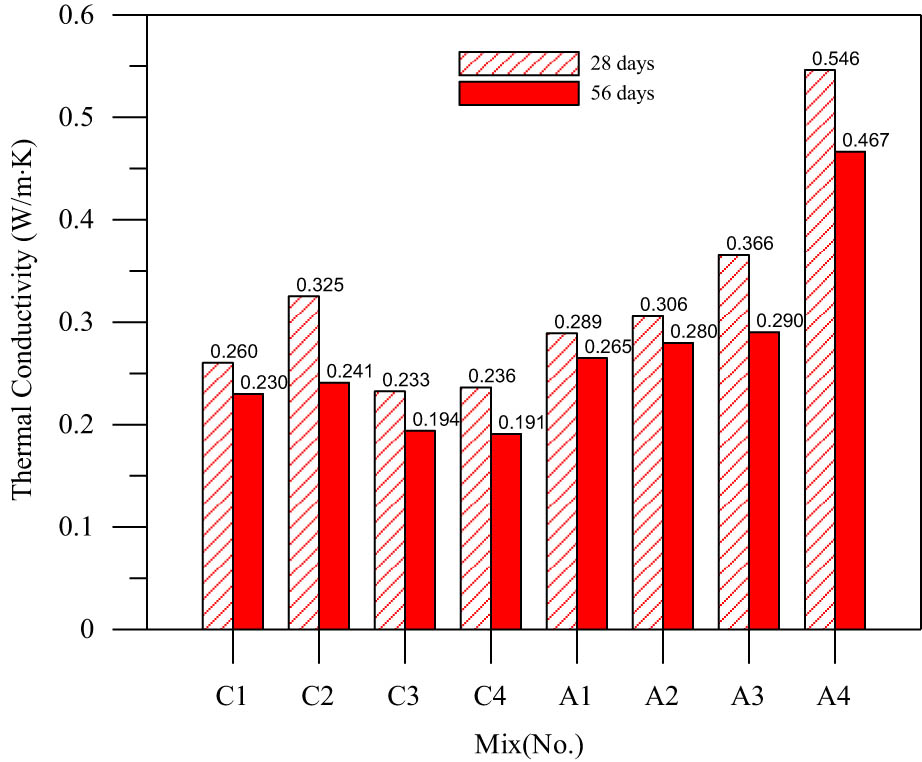
Figure 13
Thermal conductivity histograms.
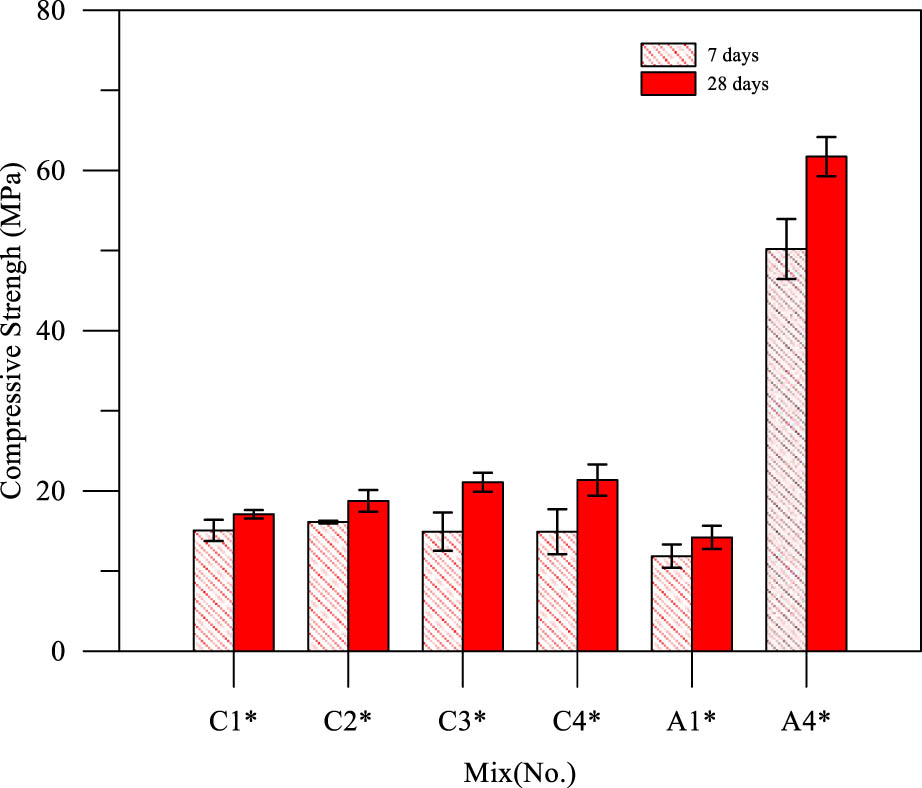
Figure 14
Compressive strength histograms designed for 3D printing (molded specimens).
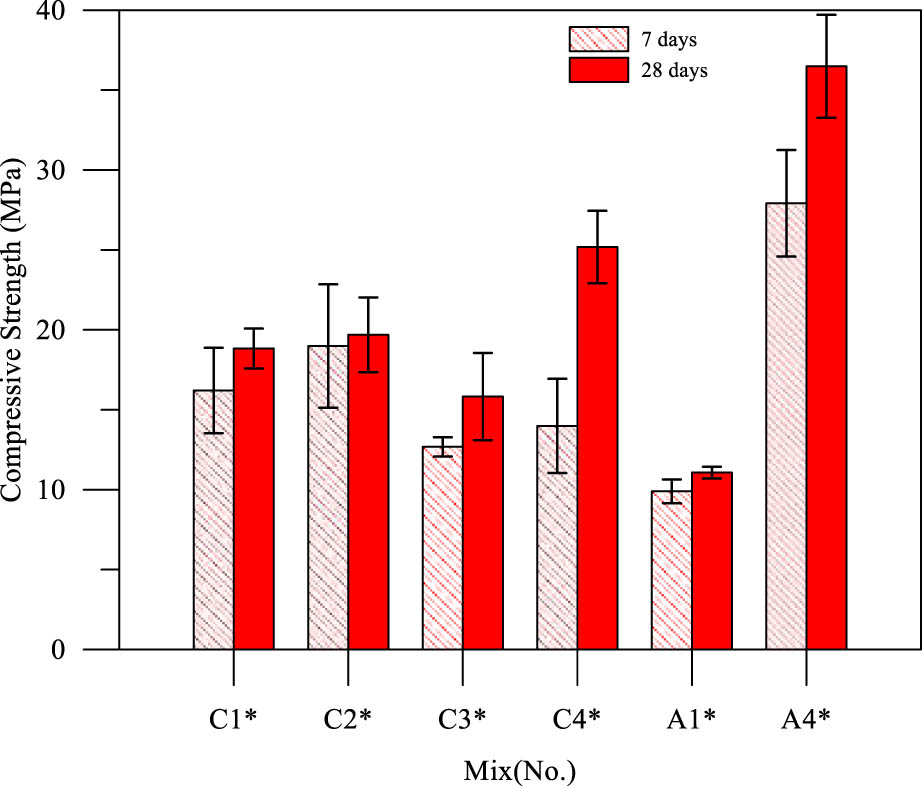
Figure 15
Compressive strength histograms designed for 3D printing (printed specimens in axial direction).
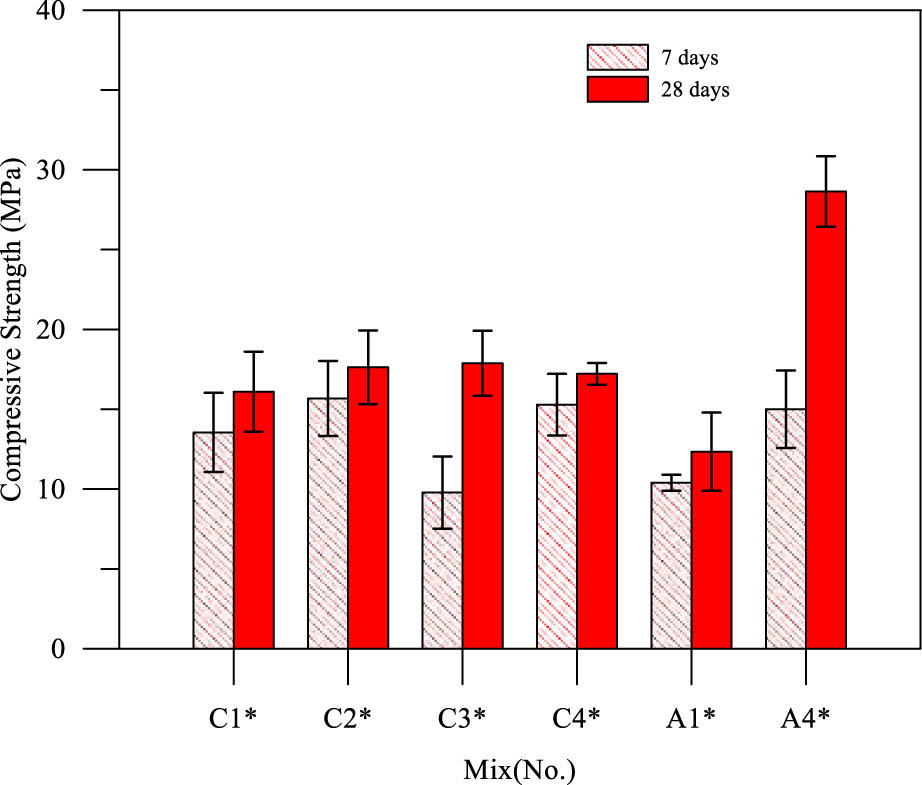
Figure 16
Compressive strength histograms designed for 3D printing (printed specimens in the lateral direction).
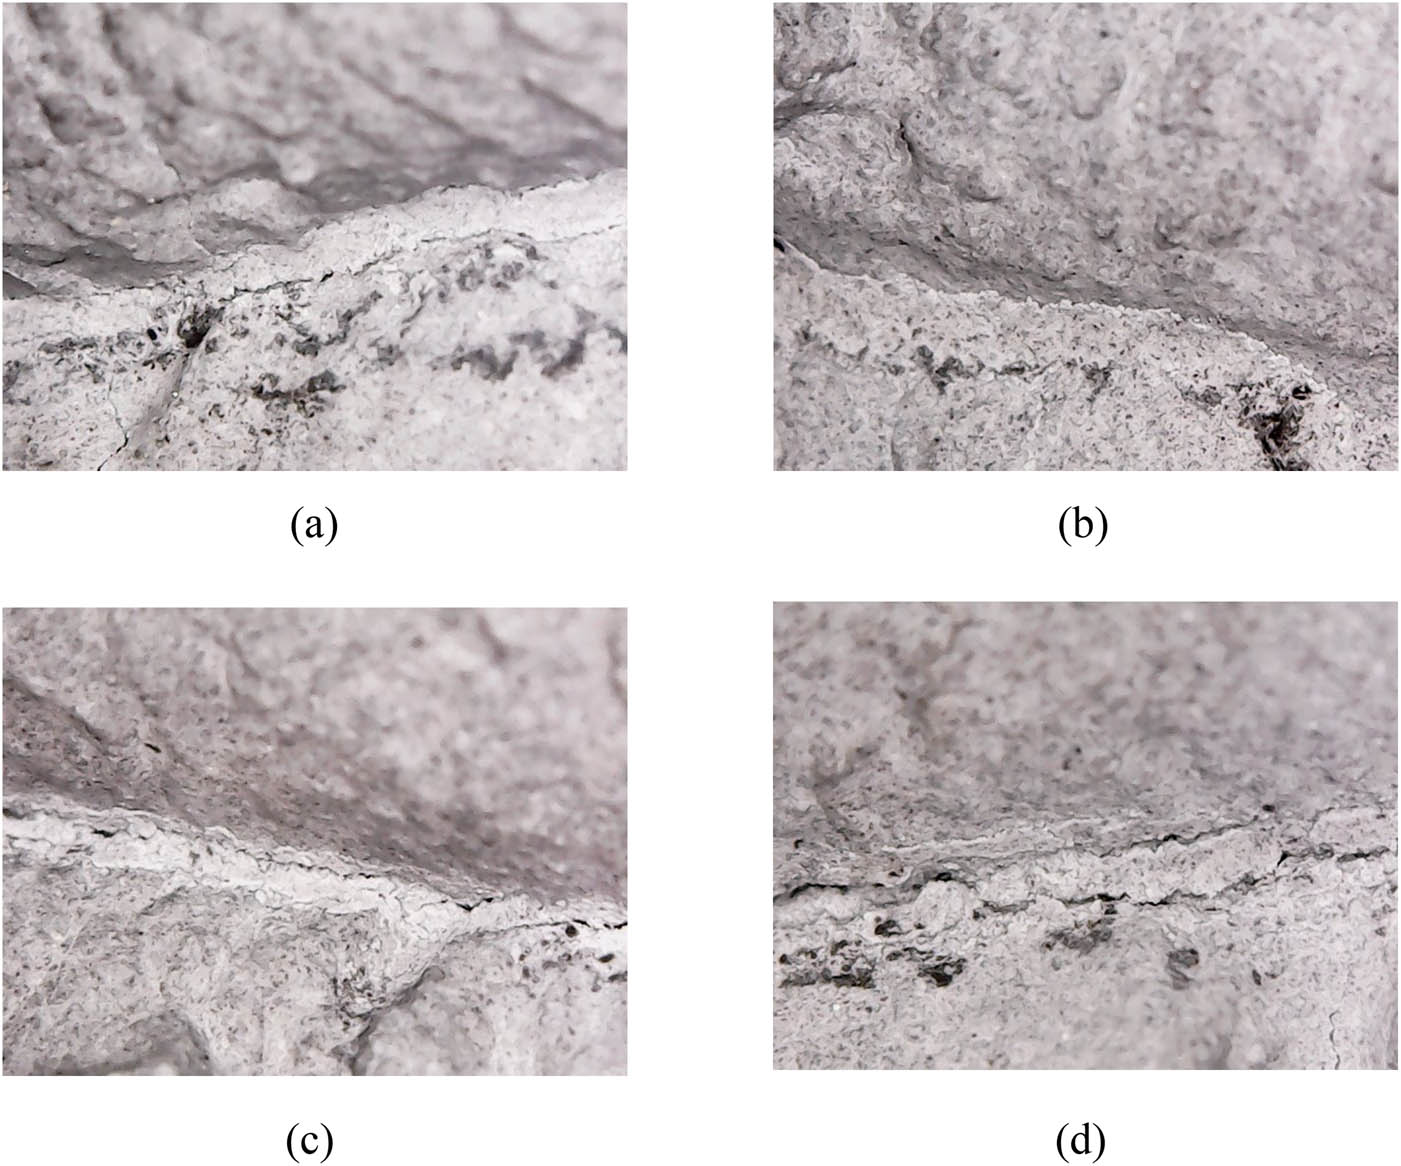
Figure 17
OM Photos for 3D printing specimens (C-series, ×1,000, 56 days). (a) C1*, (b) C2*, (c) C3*, and (d) C4*.
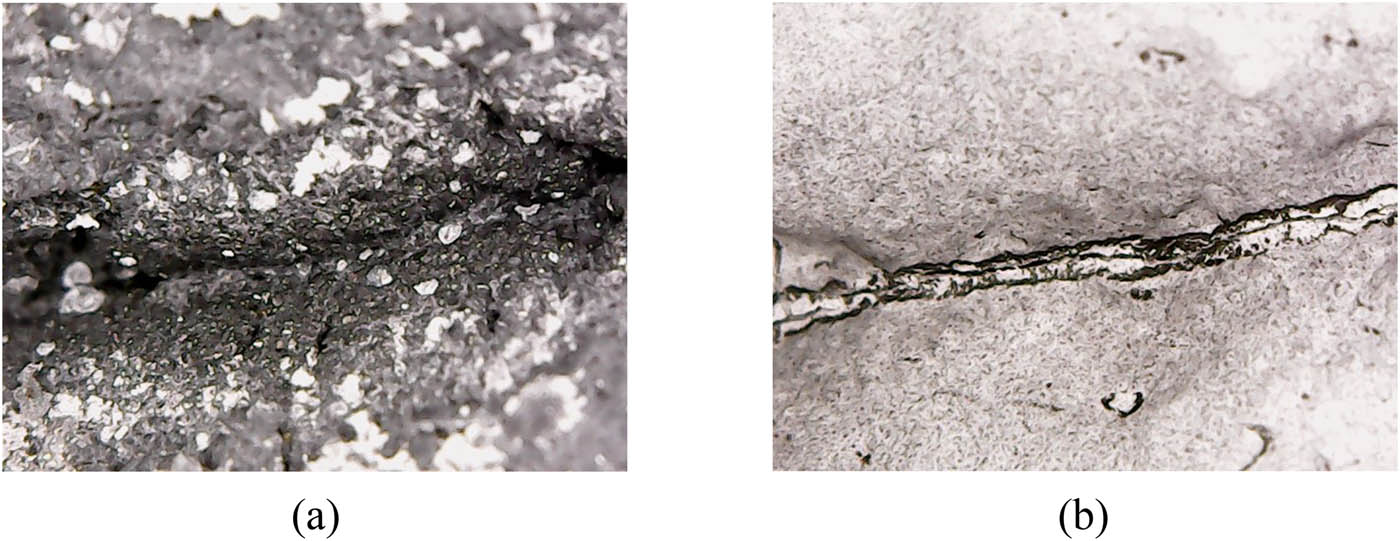
Figure 18
OM Photos for 3D printing specimens (A-series, ×1,000, 56 days). (a) A1* and (b) A4*.