
Figure 1

Figure 2
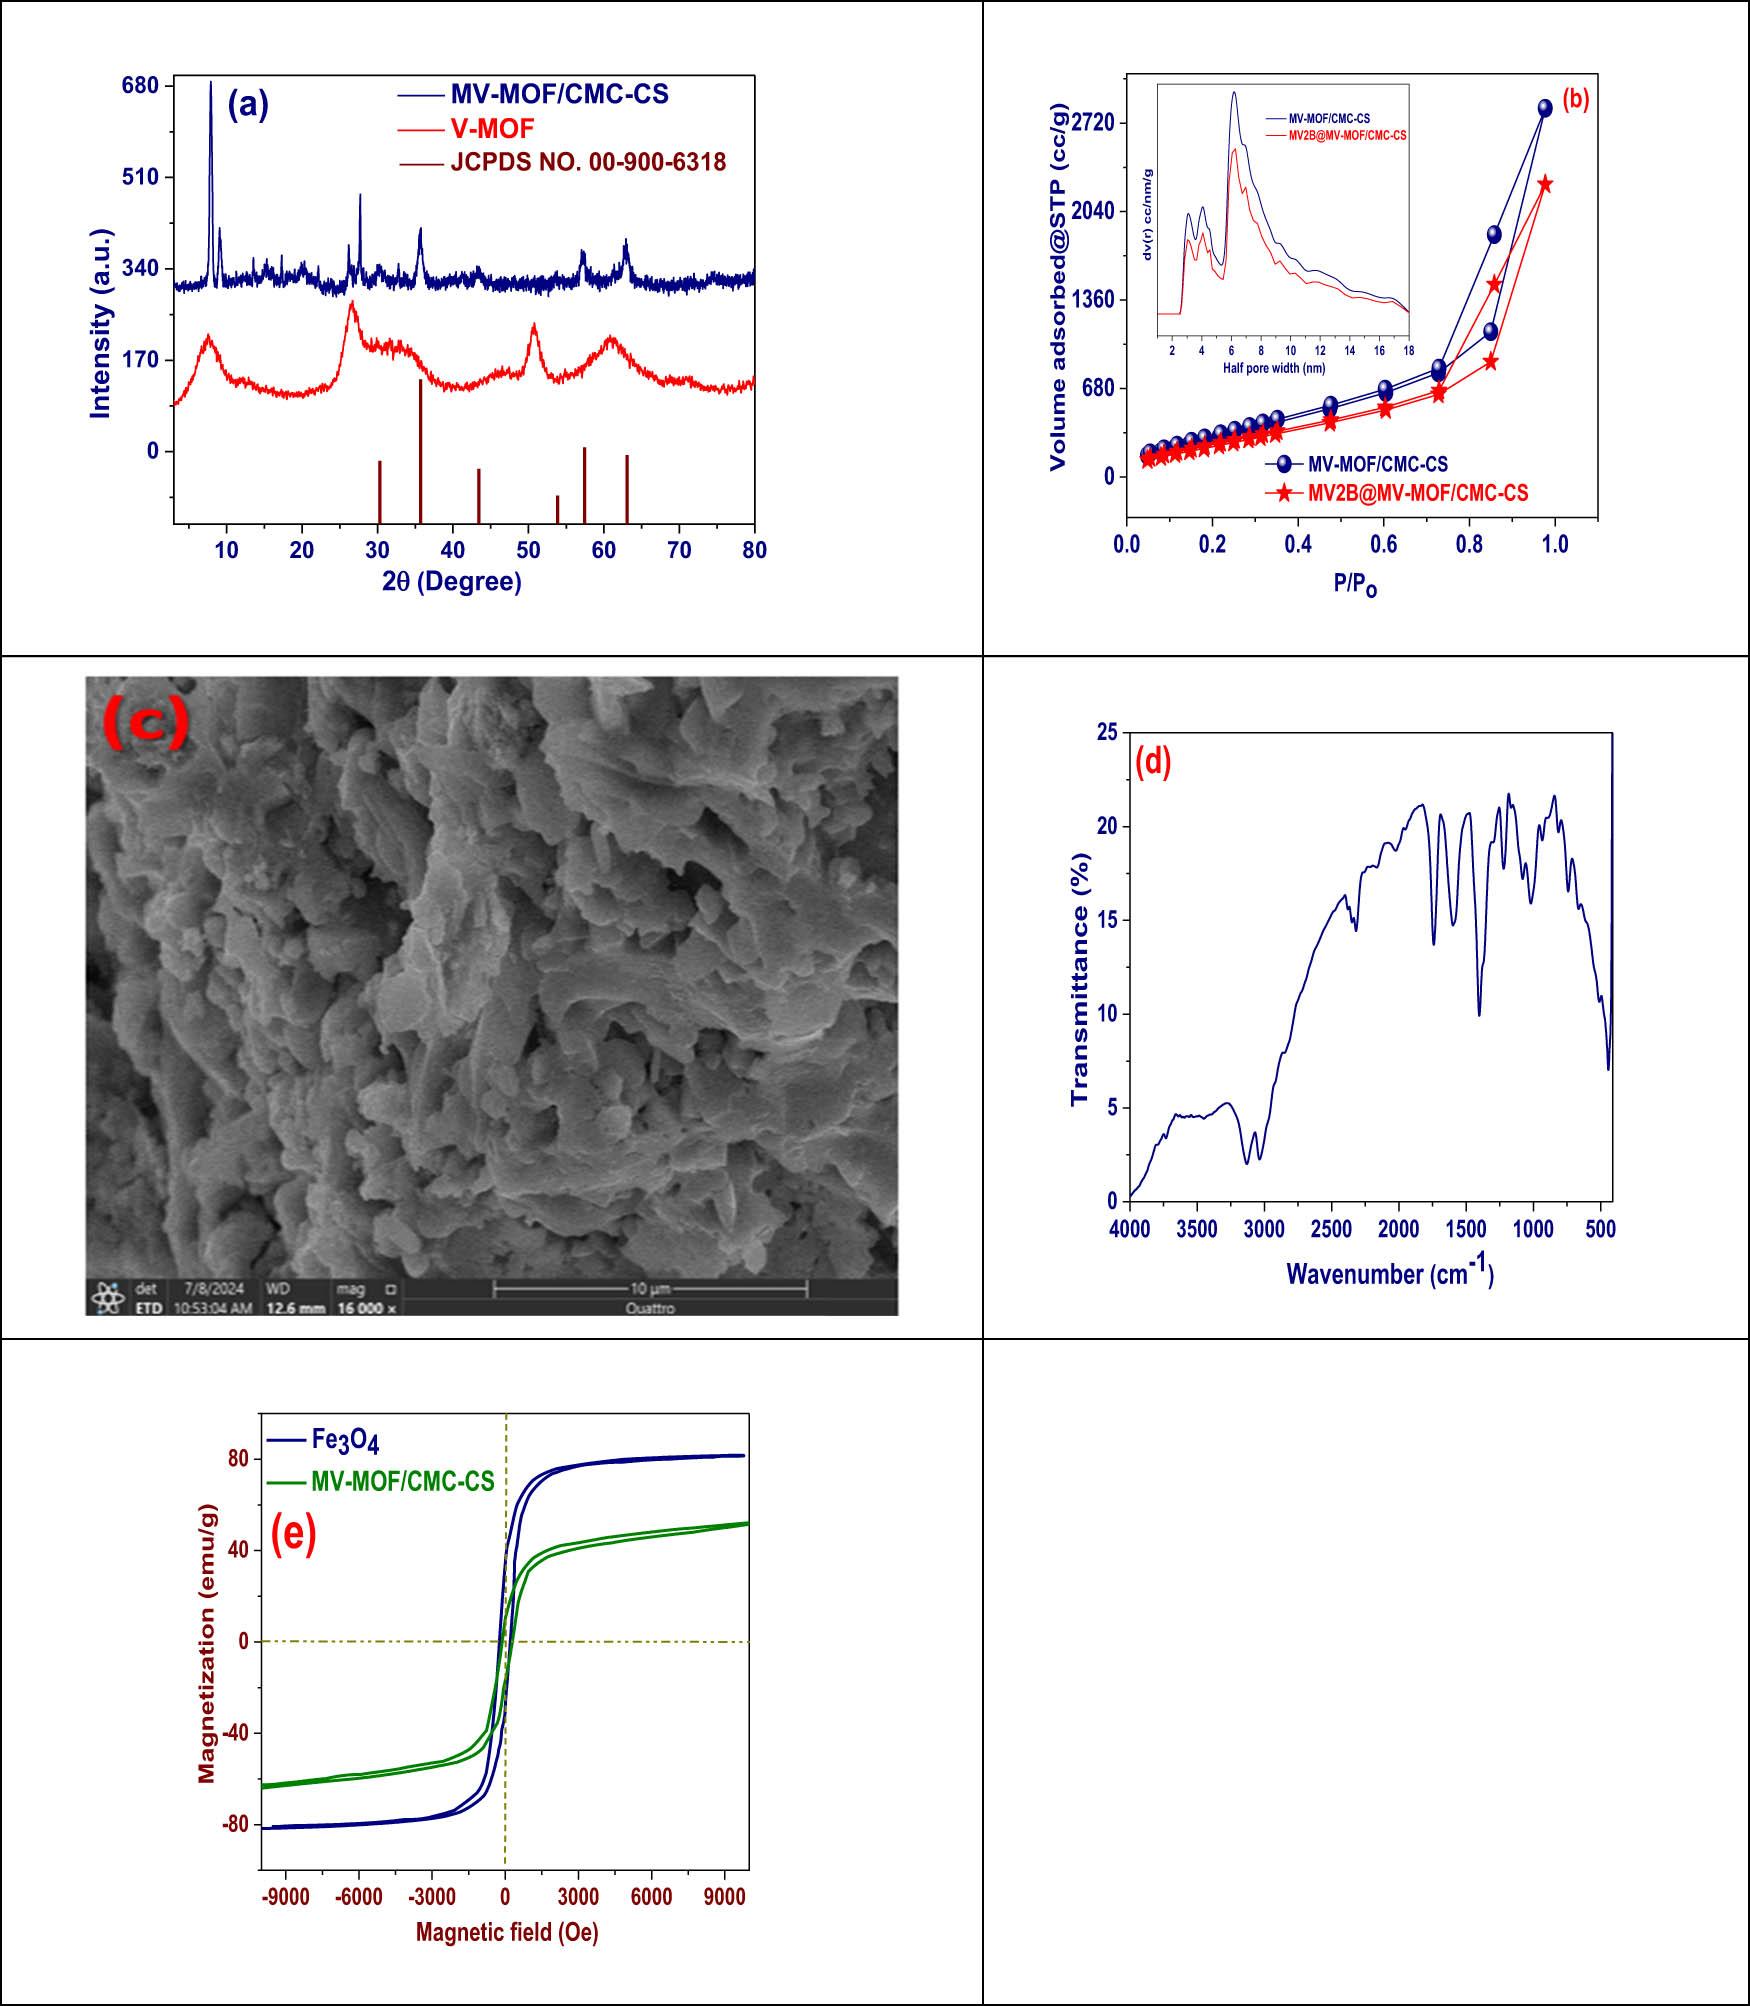
Figure 3
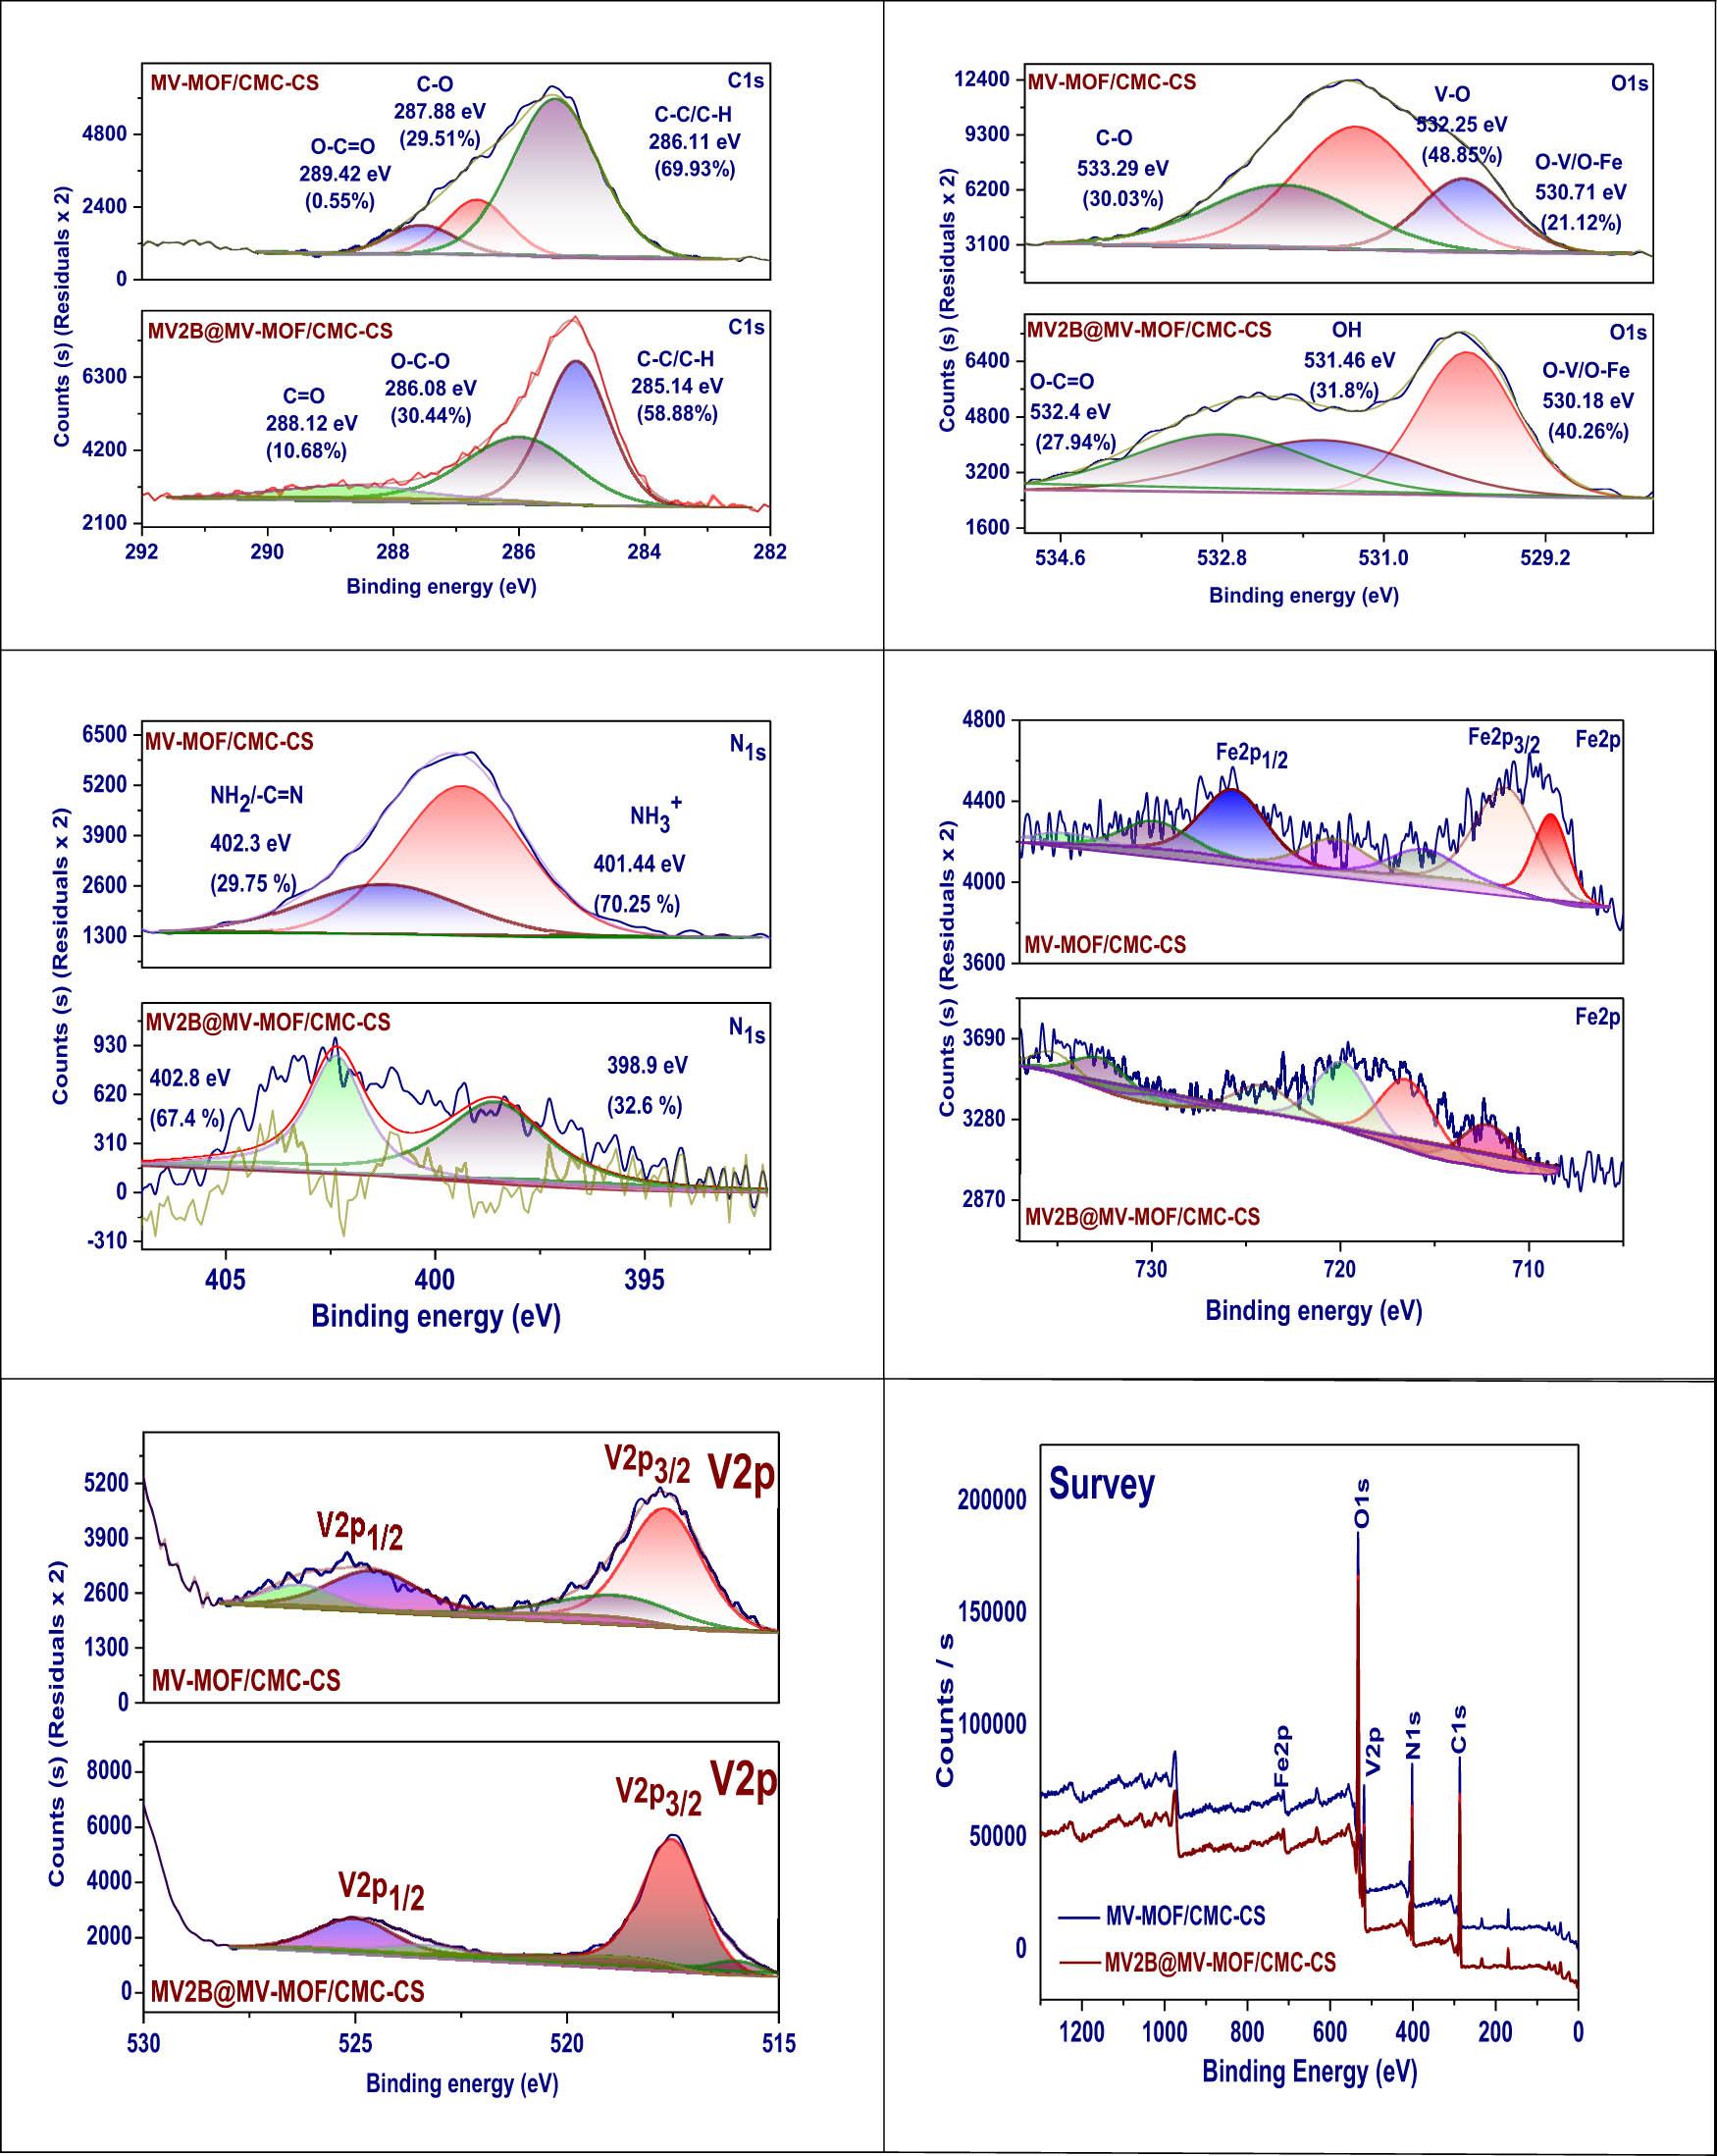
Figure 4
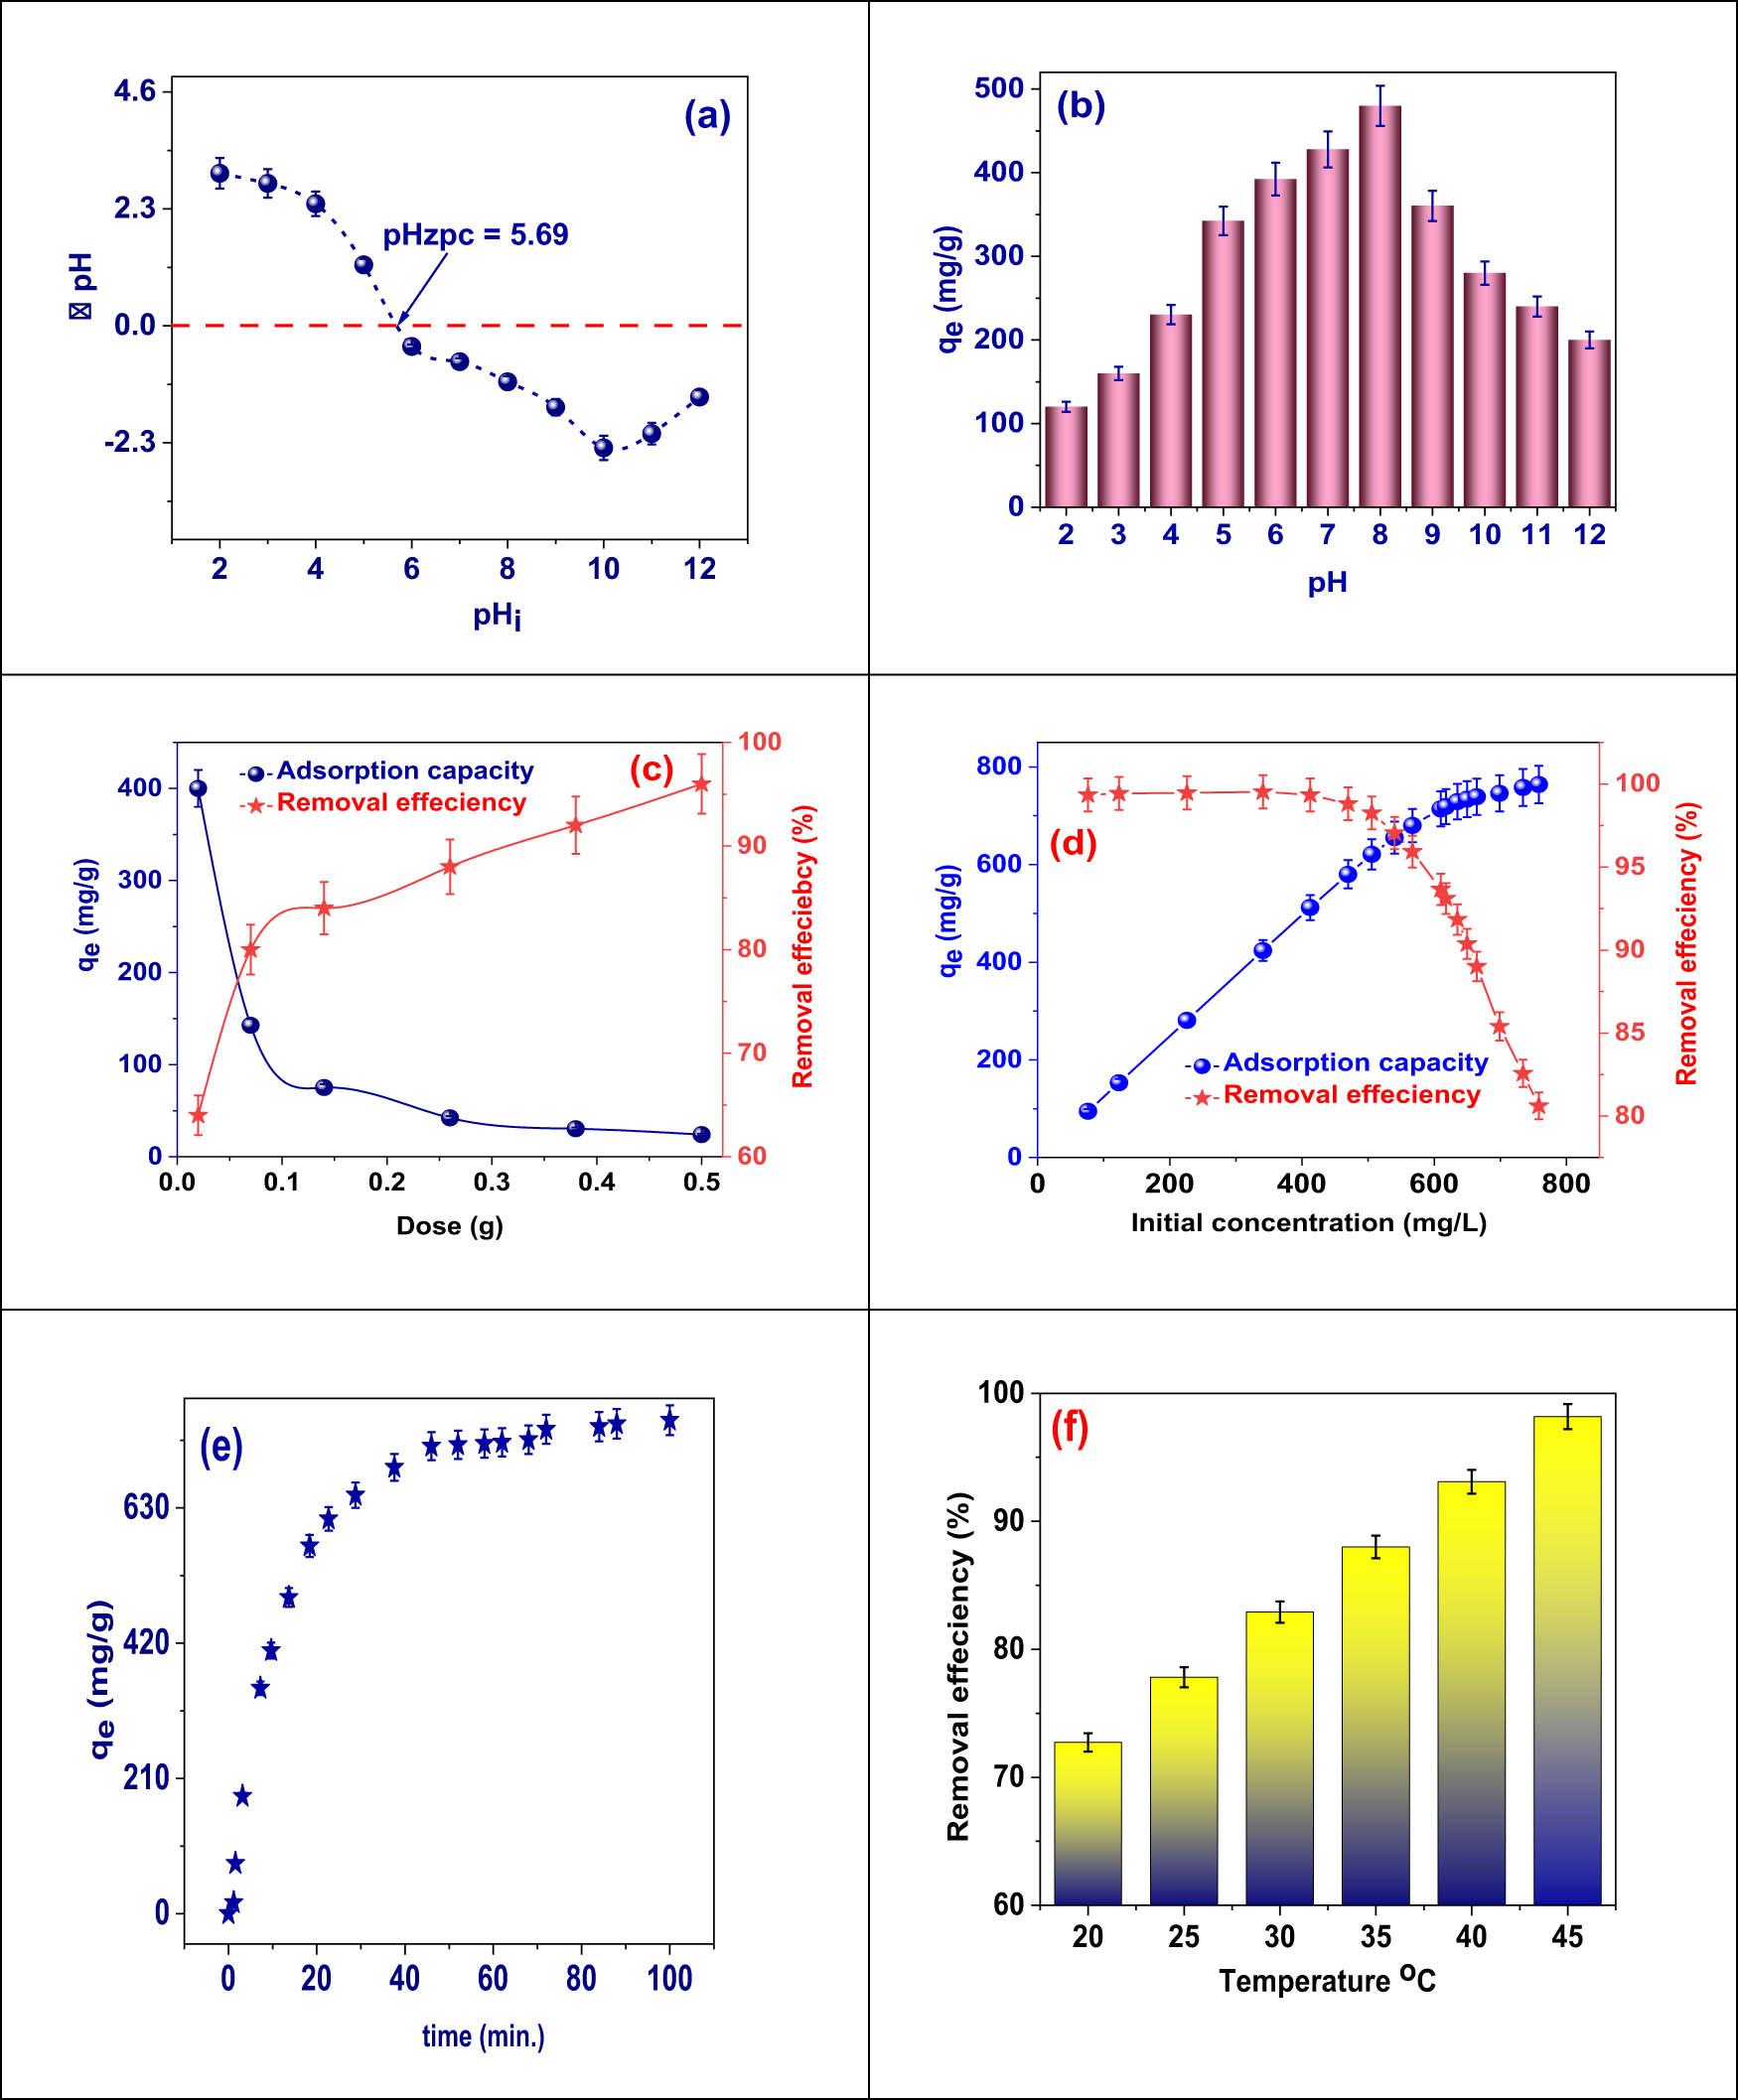
Figure 5
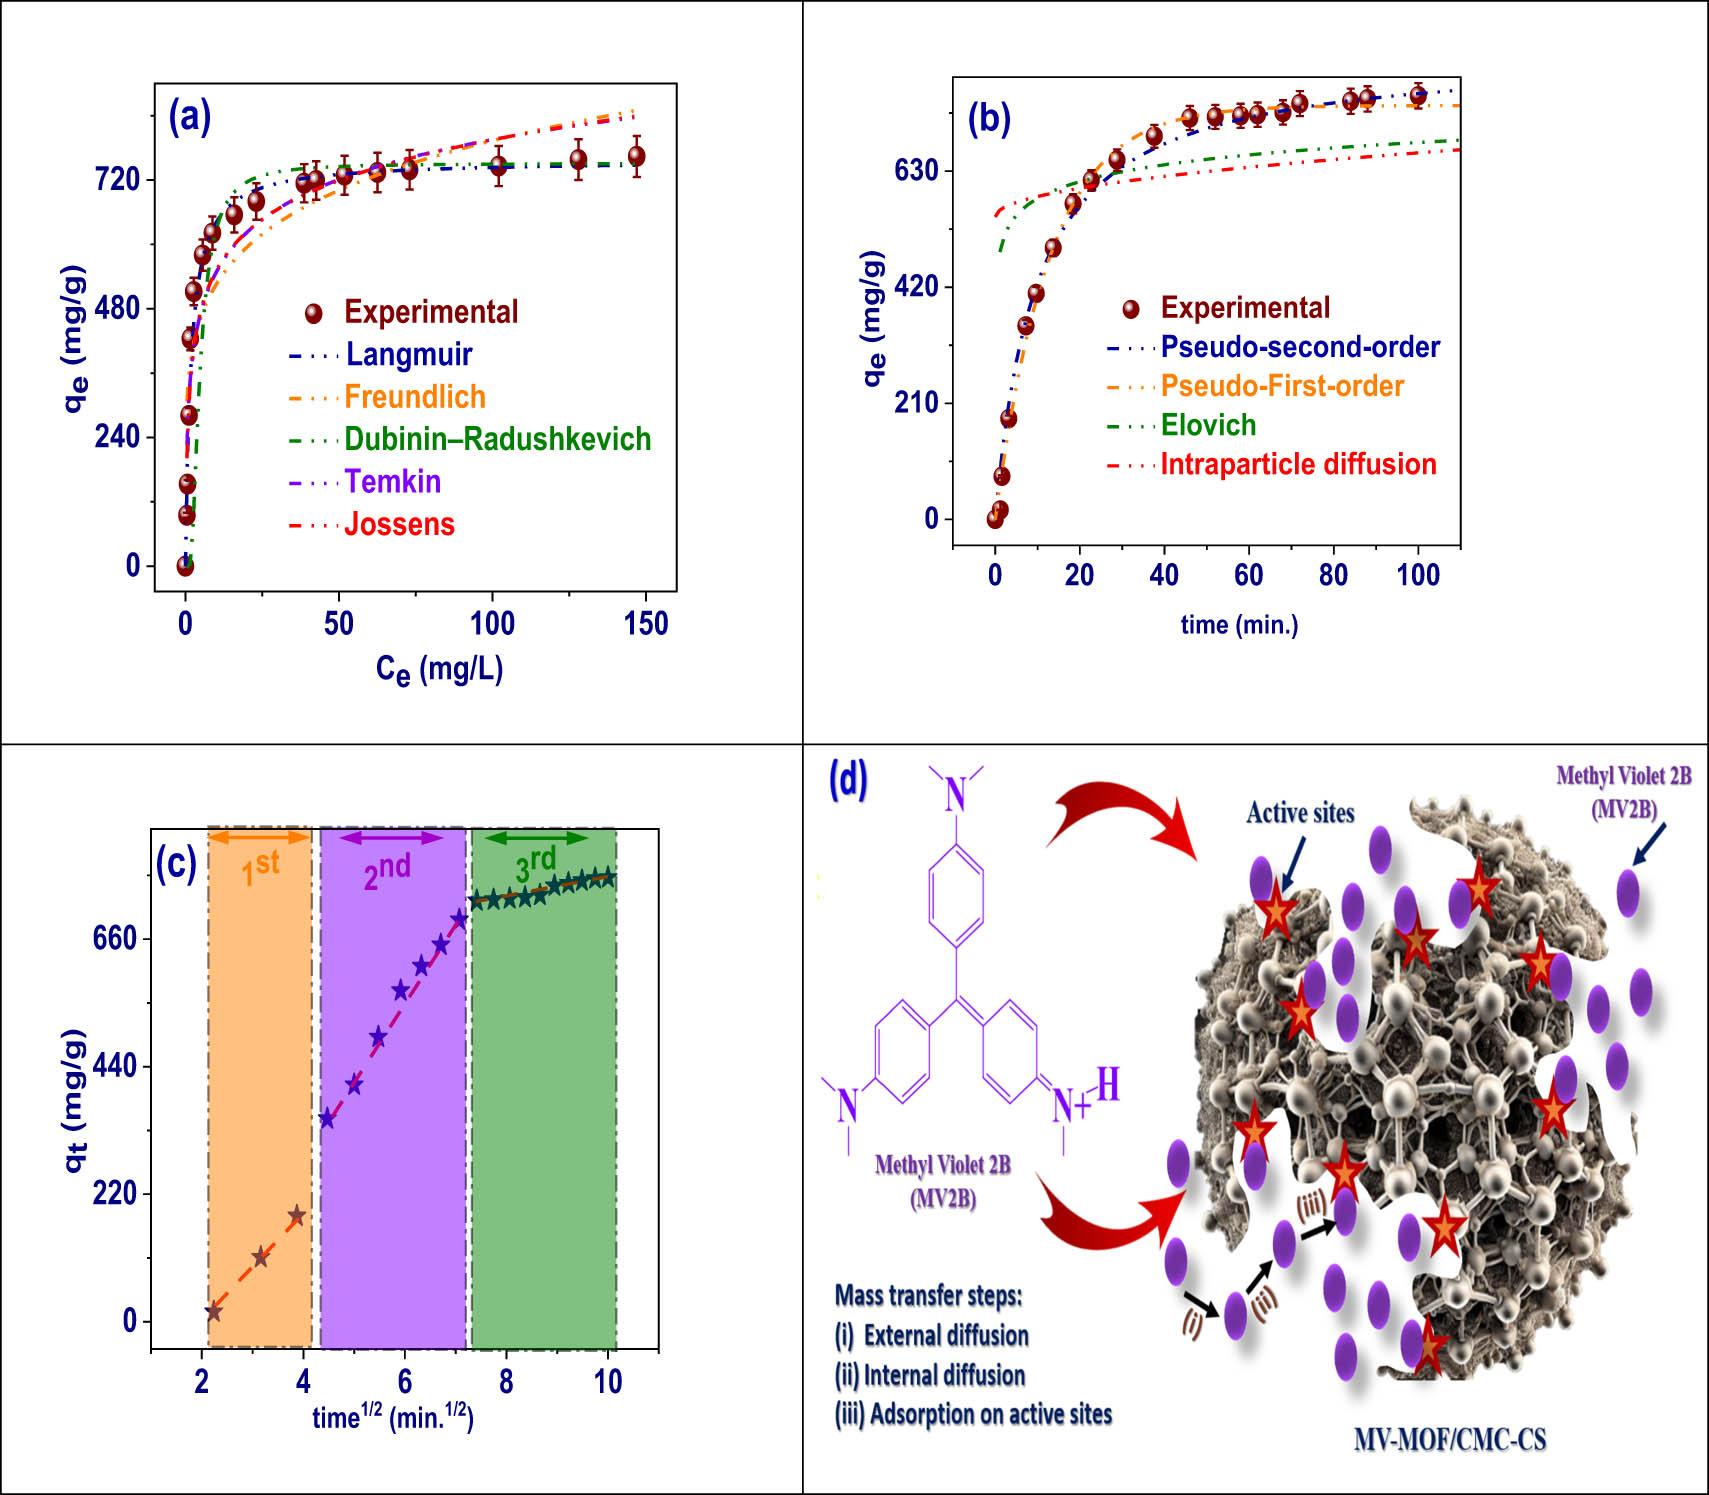
Figure 6
Figure 7
Figure 8
Figure 9
Figure 10
Figure 11
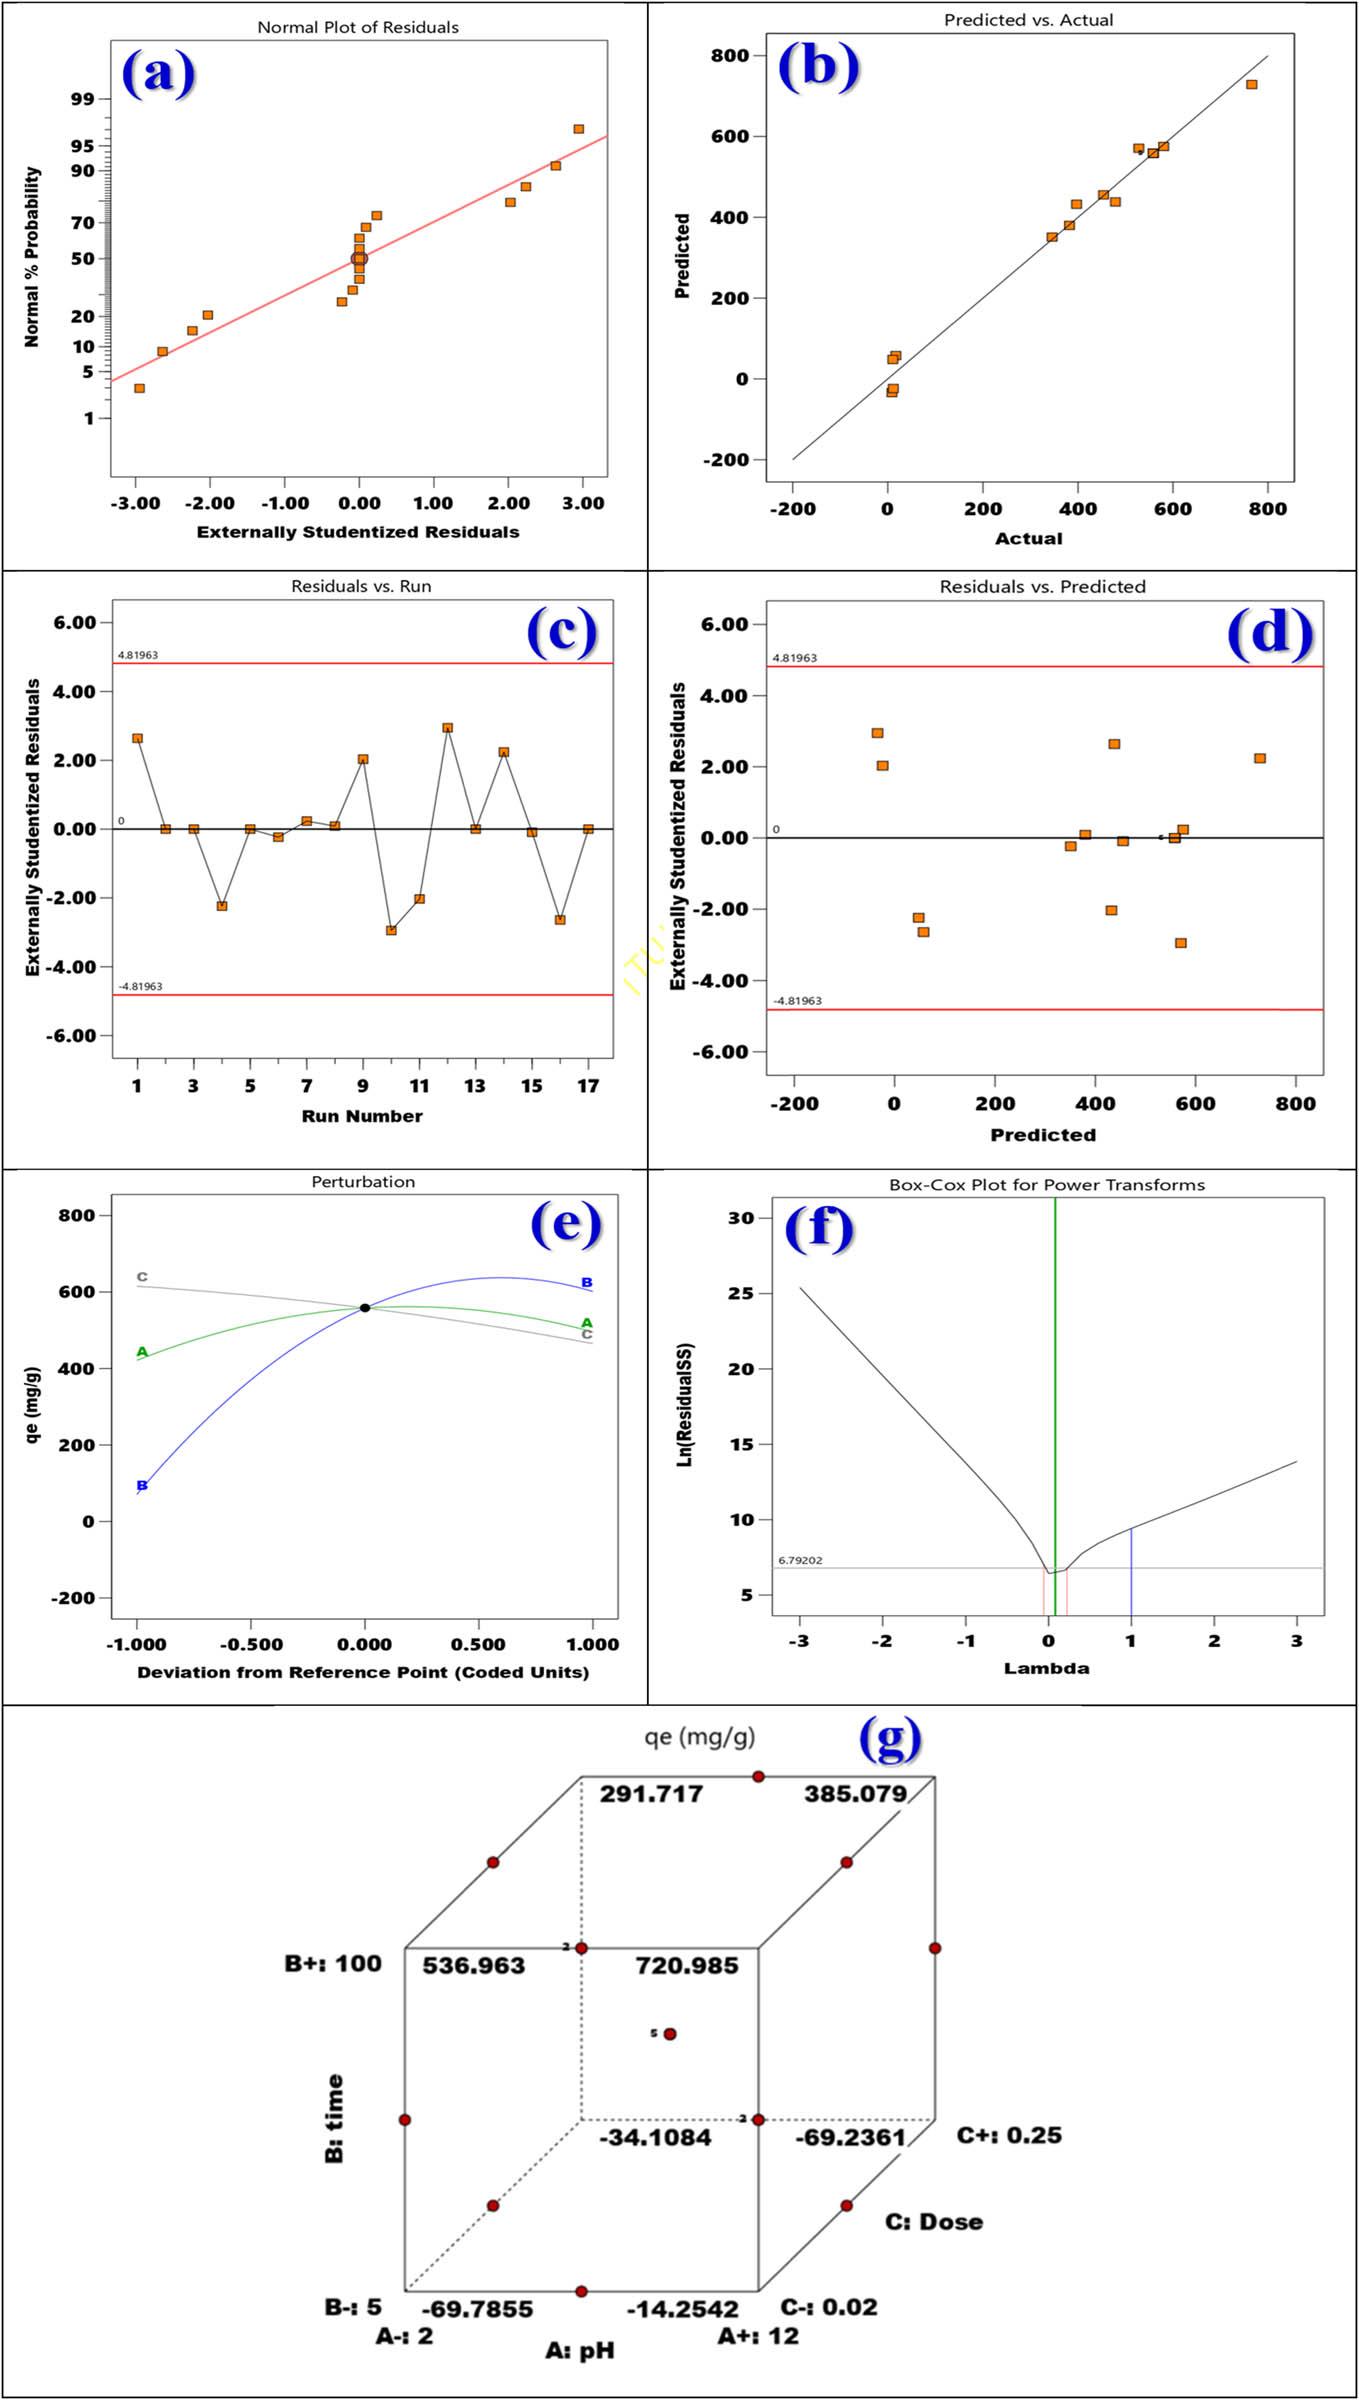
Figure 12
Figure 13
Statistical examination of numerous adsorption models for MV2B dye on the MV-MOF/CMC-CS_
| Source | Sum of square | Std. Dev. | Sequential p-value | Press | Adj R 2 | Pred R 2 | Remark |
|---|---|---|---|---|---|---|---|
| Linear | 3.040 × 10⁵ | 152.93 | 0.0019 | 5.130 × 10⁵ | 0.5946 | 0.4443 | |
| 2F1 | 2.781 × 10⁵ | 166.77 | 0.8174 | 9.157 × 10⁵ | 0.5179 | 0.0081 | |
| Quadratic | 12337.38 | 41.98 | <0.0001 | 1.974 × 10⁵ | 0.9695 | 0.7862 | Suggested |
| Cubic | 0.0000 | 0.0000 | 1.0000 | Aliased |
Examination of the variance for the models being fitted_
| Source | Sum of squares | df | Mean square | F-value | p-value | Standard error | 95% CI low | 95% CI high | |
|---|---|---|---|---|---|---|---|---|---|
| Intercept | 558.46 | 18.77 | 514.07 | 602.86 | |||||
| Model | 9.108 × 10+05 | 9 | 1.012 × 10+05 | 57.42 | <0.0001 | Significant | |||
| A-pH | 11084.74 | 1 | 11084.74 | 6.29 | 0.0405 | 14.84 | 2.13 | 72.32 | |
| B-time | 5.629 × 10⁵ | 1 | 5.629 × 1005 | 319.40 | <0.0001 | 14.84 | 230.17 | 300.36 | |
| C-Dose | 45068.61 | 1 | 45068.61 | 25.57 | 0.0015 | 14.84 | −110.15 | −39.96 | |
| AB | 4127.46 | 1 | 4127.46 | 2.34 | 0.1698 | 20.99 | −17.51 | 81.76 | |
| AC | 2054.76 | 1 | 2054.76 | 1.17 | 0.3161 | 20.99 | −72.30 | 26.97 | |
| BC | 19729.55 | 1 | 19729.55 | 11.19 | 0.0123 | 20.99 | −119.87 | −20.60 | |
| A 2 | 41923.08 | 1 | 41923.08 | 23.79 | 0.0018 | 20.46 | −148.16 | −51.40 | |
| B 2 | 2.078 × 10+05 | 1 | 2.078 × 10⁵ | 117.92 | <0.0001 | 20.46 | −270.55 | −173.79 | |
| C 2 | 1377.33 | 1 | 1377.33 | 0.7815 | 0.4060 | 20.46 | −66.47 | 30.29 | |
| Residual | 12337.38 | 7 | 1762.48 | ||||||
| Lack of fit | 12337.38 | 3 | 4112.46 | ||||||
| Pure error | 0.0000 | 4 | 0.0000 | ||||||
| Cor total | 9.231 × 10⁵ | 16 | |||||||
| Std. Dev. | 41.98 | ||||||||
| Mean | 398.44 | ||||||||
| C.V. % | 10.54 | ||||||||
| R 2 | 0.9866 | ||||||||
| Adjusted R 2 | 0.9695 | ||||||||
| Predicted R 2 | 0.7862 | ||||||||
| Adeq precision | 23.6848 |
Modeling the sum of squares in a sequential fashion_
| Source | Sum of squares | df | Mean squares | F-value | P-value remark | |
|---|---|---|---|---|---|---|
| Mean value vs Total | 2.699 × 10⁶ | 1 | 2.699 × 10⁶ | |||
| Linear vs Mean value | 6.191 × 10⁵ | 3 | 2.064 × 10⁵ | 8.82 | 0.0019 | |
| 2FI vs Linear | 25911.77 | 3 | 8637.26 | 0.3106 | 0.8174 | |
| Quadratic vs 2FI | 2.658 × 10⁵ | 3 | 88594.70 | 50.27 | <0.0001 | Suggested |
| Cubic vs Quadratic | 12337.38 | 3 | 4112.46 | Aliased | ||
| Residual | 0.0000 | 4 | 0.0000 | |||
| Total | 3.622 × 10⁶ | 17 | 2.13 × 10⁵ |
Efficiency of MV2B dye adsorption via the reaction surface’s CCD_
| Run | Actual variables | Yield (mg/g) | ||||||
|---|---|---|---|---|---|---|---|---|
| pH | Time (min) | Dose (g) | Experimental | Predicted | Residue | Internally studentized residuals | Externally studentized residuals | |
| 1 | 7 | 100 | 0.25 | 478.88 | 438.18 | 40.69 | 1.939 | 2.637 |
| 2 | 7 | 52.5 | 0.135 | 558.46 | 558.46 | 0.0000 | 0.000 | 0.000 |
| 3 | 7 | 52.5 | 0.135 | 558.46 | 558.46 | 0.0000 | 0.000 | 0.000 |
| 4 | 7 | 5 | 0.25 | 10.67 | 48.11 | −37.44 | −1.784 | −2.236 |
| 5 | 7 | 52.5 | 0.135 | 558.46 | 558.46 | 0.0000 | 0.000 | 0.000 |
| 6 | 2 | 52.5 | 0.25 | 345.71 | 350.98 | −5.26 | −0.251 | −0.233 |
| 7 | 12 | 52.5 | 0.02 | 580.80 | 575.54 | 5.26 | 0.251 | 0.233 |
| 8 | 12 | 52.5 | 0.25 | 382.11 | 380.09 | 2.01 | 0.096 | 0.089 |
| 9 | 12 | 5 | 0.135 | 11.77 | −23.66 | 35.43 | 1.688 | 2.029 |
| 10 | 12 | 100 | 0.135 | 528.41 | 571.12 | −42.70 | −2.034 | −2.946 |
| 11 | 2 | 100 | 0.135 | 397.00 | 432.43 | −35.43 | −1.688 | −2.029 |
| 12 | 2 | 5 | 0.135 | 8.84 | −33.86 | 42.70 | 2.034 | 2.946 |
| 13 | 7 | 52.5 | 0.135 | 558.46 | 558.46 | 0.0000 | 0.000 | 0.000 |
| 14 | 7 | 100 | 0.02 | 766.20 | 728.76 | 37.44 | 1.784 | 2.236 |
| 15 | 2 | 52.5 | 0.02 | 453.75 | 455.76 | −2.01 | −0.096 | −0.089 |
| 16 | 7 | 5 | 0.02 | 17.07 | 57.76 | −40.69 | −1.939 | −2.637 |
| 17 | 7 | 52.5 | 0.135 | 558.46 | 558.46 | 0.0000 | 0.000 | 0.000 |