The swift growth of industrial activities, especially in the textile, dyeing, paper, and leather industries, has led to a significant release of synthetic dyes into water ecosystems. Among various industrial pollutants, synthetic dyes stand out as particularly persistent and harmful due to their intricate aromatic molecular structures, high solubility in water, and resistance to biological degradation [1]. Even in minimal concentrations, these dyes can greatly reduce the clarity and visual quality of natural water bodies, hinder photosynthesis by obstructing sunlight, and pose long-term ecological risks to aquatic organisms and human health. One such example is methyl violet 2B (MV2B), a triphenylmethane dye widely employed in the textile and printing segments, recognized for its vivid color, potential for causing mutations, and long-lasting environmental impact. Therefore, the effective elimination of MV2B and similar substances from wastewater is crucial for both community health and environmental safety [2].
Conventional approaches for the elimination of dyes, such as coagulation, flocculation, advanced oxidation processes, membrane filtration, and electrochemical treatments, have shown inconsistent effectiveness [3]. These techniques often come with significant disadvantages, including high working costs, complicated maintenance, the generation of secondary contaminants, or limited efficacy against certain types of dyes. Amongst the numerous physicochemical methods, adsorption is recognized as one of the greatest adaptable, cost-effective, and scalable approaches for extracting dye molecules from water [4]. Its ease of operation, flexibility in handling different types of wastewaters, and low energy requirements make it especially appropriate for large-scale industrial usage. However, the effectiveness of adsorption technologies is closely tied to the chemical and physical properties of the adsorbent used. A key challenge in contemporary water purification research is to create adsorbents that are high-performing, economical, eco-friendly, and possess adjustable surface chemistry along with rapid sorption rates [5].
Metal–organic frameworks (MOFs) are an innovative category of porous crystalline resources made up of metal nodes and organic linkers. They have attracted significant interest recently due to their remarkable high surface areas, well-defined pore assemblies, and customizable chemical properties. These characteristics make MOFs particularly useful in molecular adsorption and separation applications [6]. However, many unmodified MOFs exhibit limited stability in water and pose challenges for separation from aqueous suspensions after use, which restricts their effectiveness in water purification. To address these limitations, hybrid approaches that combine MOFs with other functional materials have been explored. One notable approach is the integration of magnetic nanoparticles into MOFs, creating magnetically responsive composites that allow for easy retrieval using external magnetic fields. Another promising method involves modifying the surfaces of MOFs with hydrophilic and biodegradable biopolymers, which improves their dispersion stability, introduces functional groups for binding target molecules, and enhances their structural integrity in water [7].
The magnetic vanadium metal-organic framework (MV-MOF) embedded in a carboxymethyl cellulose/chitosan (MV-MOF/CMC-CS beads) developed in this research integrate the MV-MOF’s excellent adsorption capabilities and magnetic separability with the hydrophilic, pH-sensitive, and interactive properties of the biopolymer matrix. This combination facilitates various interaction mechanisms for effective dye removal, including electrostatic attraction, π–π stacking, hydrogen bonding, and pore filling. A thorough characterization of the materials was conducted through X-ray diffraction (XRD), Fourier transform infrared spectroscopy (FT-IR), scanning electron microscope, Brunauer–Emmett–Teller (BET) surface analysis, and X-ray photoelectron spectroscopy (XPS). These studies confirm the successful creation of the composite and offer valuable insights into its structural and functional characteristics previous and subsequent to dye adsorption [8].
The primary aim of this analysis is to assess and improve the ability of MV-MOF/CMC-CS to remove MV2B dye across various environmental conditions. This approach involves a detailed examination of several key operational factors, including pH, initial dye concentration, duration of interaction, temperature, and the amount of adsorbent used [9]. The adsorption characteristics were analyzed through the adsorption isotherm models that represented it was fitted to the Langmuir model. Furthermore, the kinetic analysis indicated that the pseudo-second-order model most accurately captured the adsorption dynamics, implying that chemisorption is the principal mechanism governing the rate of adsorption [8]. To enhance the adsorption process and pinpoint ideal operational parameters, Response surface methodology (RSM), applying the Box-Behnken design (BBD), was implemented [10]. This statistical approach provides an efficient framework for examining the interactive effects of various variables, thereby predicting the optimal settings for attaining maximum dye removal efficiency. By incorporating experimental data within the RSM framework, the study gains increased scientific robustness, which is critical for advancing process scale-up and optimizing design within practical treatment systems.
This research presents an innovative composite material featuring MV-MOFs embedded in a CMC/CS hydrogel matrix, loaded with activated algae specifically aimed at effectively removing MV2B dye from water. The significance of this study stems from the unique combination of high-surface-area MOFs with biodegradable, pH-sensitive biopolymers, resulting in a multifunctional adsorbent that boasts an impressive dye uptake capacity along with compatibility with environmental standards and convenient magnetic recovery. Unlike previous materials, this composite allows for various adsorption mechanisms, such as hydrogen bonding, electrostatic interactions, π–π stacking, and pore filling, while maintaining robust structural integrity and high reusability. The adsorption process was optimized in detail using RSM based on BBD, which facilitated the identification of key interactions among various operational parameters. Extensive characterization, along with kinetic, isotherm, and thermodynamic modeling, demonstrated that chemisorption is the primary mechanism of removal. This study provides a sustainable, high-efficiency solution for dye removal and sets a new course for developing polymer-functionalized MOF-based adsorbents for environmental applications.
Tables S1 and S2 give detailed information about the instruments and equipment utilized in this work, respectively.
The creation of Fe3O4 nanoparticles was executed through a co-precipitation method. Specifically, 3.42 g FeSO4·7H2O and 3.33 g FeCl3·6H2O were dissolved in a volume of 45 mL of ultrapure water. This solution was subsequently introduced into a thermostat water bath maintained at a temperature of 85°C. Subsequently, 35.5 µL of concentrated hydrochloric acid (10 mM) was introduced into the ferric/ferrous solution, followed by vigorous stirring for 1 h to ensure the development of a uniform solution. Ammonium hydroxide was then incrementally added to the iron solution at a controlled pace until the pH level reached approximately 10. The resulting chocolate-brown solid was exposed to continuous stirring for an interval of 30 min. Afterwards, it was extracted from the suspension utilizing an external magnet, followed by multiple washes with ultrapure water. The final step involved drying the solid for 12 h at a temperature of 60°C [11].
The purification process of the edible algae involved the utilization of deionized water, followed by a drying phase exposed to sunlight. Subsequently, a total of 50 g of the algae biomass was integrated with 850 mL of lime juice, which contained about 0.5 M of glutamic acid. This combined solution was subjected to stirring for a period of 30 min [12]. Following this step, it was relocated to a hydrothermal reactor before being heated in an oven at 80°C for 8 h. The final steps included centrifugation and a drying process conducted at 70°C for 6 h.
Following the completion of thorough mixing for a duration of 30 min, the synthesized Fe3O4 (0.5 g) were dispersed with 250 mL of water and exposed to sonication for an additional 30 min. Following this process, a magnetic technique was used to remove the modified Fe3O4 from the solution, and water was then used for washing [11]. This process created the V-MOF adsorbent in a simple and naturally sustainable manner. The process included combining 1.88 g of vanadium chloride (0.012 moles) and 4.05 g of 2-methyl imidazole (0.05 moles) in equal proportions with deionized water in a 100 mL vessel containing 1 g of activated algae. After this, the blend was upheld at a temperature of 80°C for 5 h within a hydrothermal furnace. Utilizing a centrifuge, the resulting dark dusty material was separated from the liquid. To eliminate any residual organic residues from the micropores, the residue was subjected to extensive cleaning, filtration, and an overnight soaking in methanol (Figure 1).
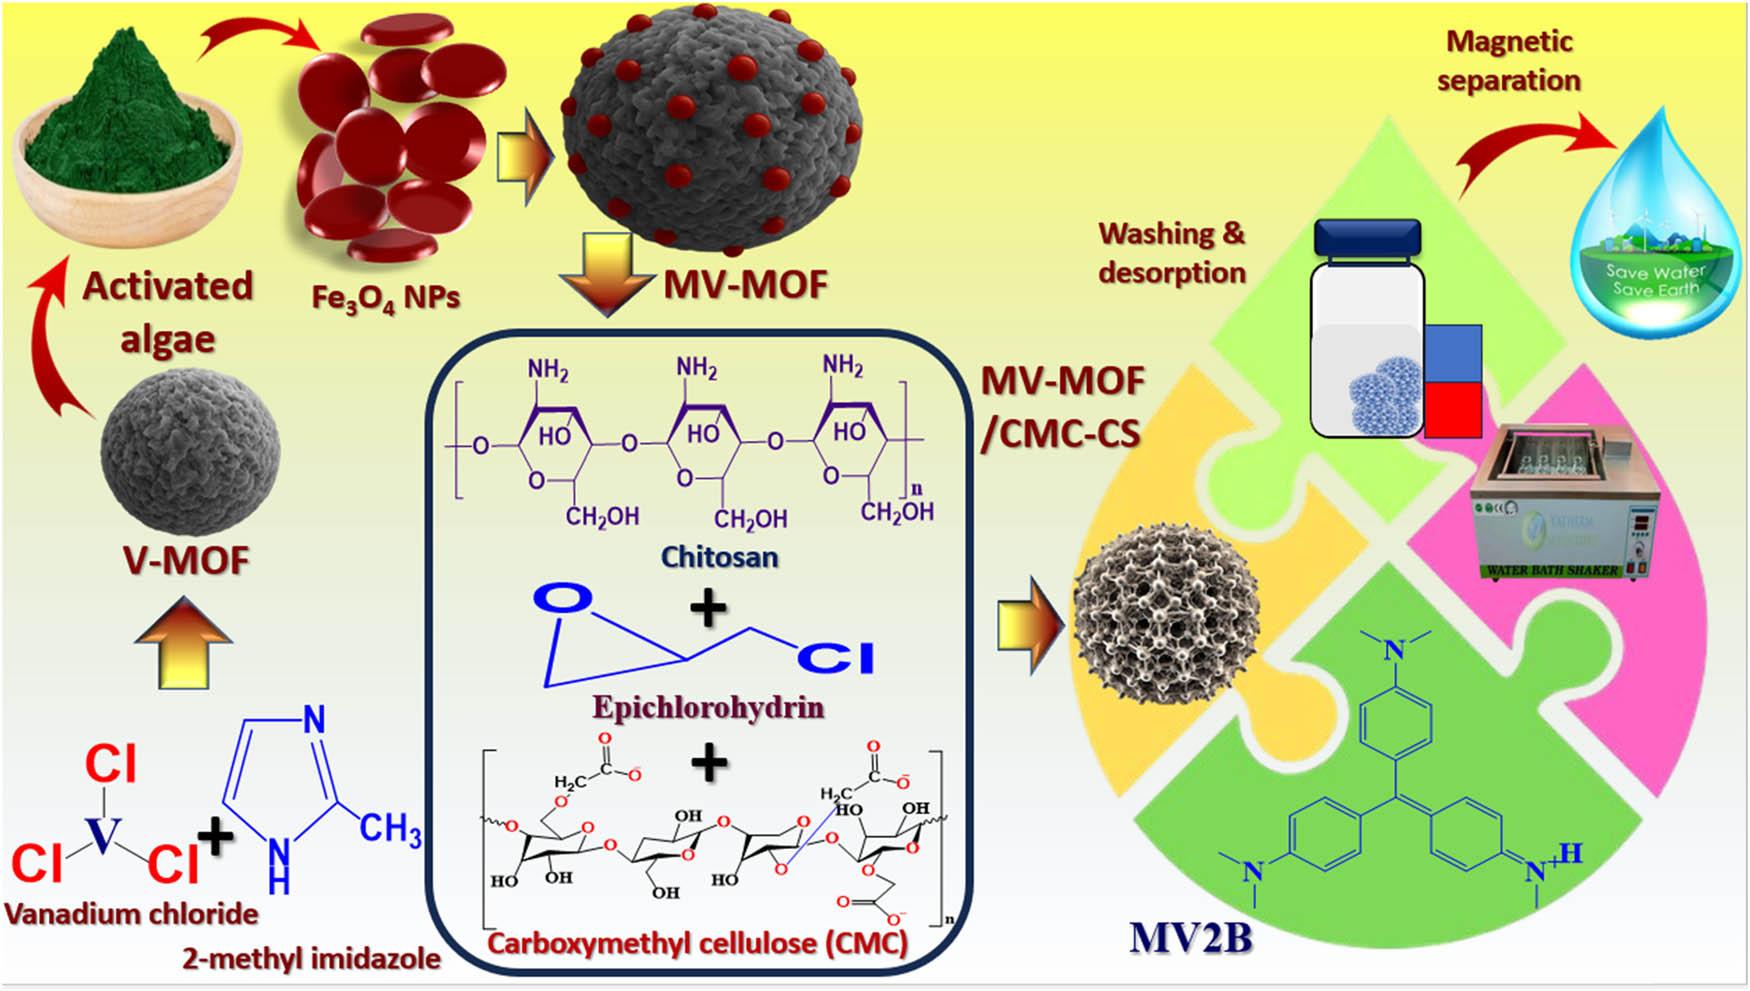
The schematic diagram shows the creation of the MV-MOF/CMC-CS composite and its MV2B dye adsorption capability.
The hydrogels of CMC and CS were produced by chemical crosslinking. The two polysaccharide-based polymers, CMC and CS, are mixed at a weight proportion of 1:1 in 50 mL of a 5% water-based solution of CH3COOH until they fully dissolved. After 30 min of subjecting the CMC/CS solution to ultrasonic treatment, incorporate 2 g of MV-MOF and continuously stir for a duration of 3 h [13]. Following this, gradually infuse 200 mL of a 1.0 molar NaOH solution into the blended solution, drop by drop. Upon exposure to the NaOH solution, the drops quickly produced (MV-MOF/CMC-CS) hydrogel beads. The cross-linking process was then started by mixing these hydrogel beads with 5 mL of epichlorohydrin solution and 100 mL of bi-distilled water. For an entire day, the mixture was stirred and the hydrogel beads were then created by centrifugation and freeze-drying [14].
A sequence of batch examinations was directed to explore the adsorption characteristics and effectiveness of MV-MOF/CMC-CS hydrogel beads in connection to MV2B dye. These investigations examined the properties of temperature, original dye concentration, interaction time, adsorbent quantity, and pH level on the adsorption procedure [14]. Prior to the study’s commencement, MV2B dye was liquefied in pure water to produce a principal solution with a 50–750 mg/L concentration. Subsequently, 25 mL of MV2B dye solutions, separately possessing unique concentration, were introduced into 50 mL conical flasks. Separately the flask was then supplemented with 0.02 g of MV-MOF/CMC-CS to conduct contact time studies. During the experiment, specified time intervals were applied to gauge the quantity of MV2B dye left in the glass vessel (Figure 1). The adsorption capability of the MV-MOF/CMC-CS was evaluated over a range of temperature rises (293–318 K). To evaluate the pH level, 0.02 g of adsorbent were inserted into conical bottles containing 25 mL of MV2B dye solutions with a concentration of 500 mL/L. Following the adsorption equilibrium, the remaining amount of MV2B dye was determined, and its pH was modified by means of 0.01 mol of NaOH or HCl [15]. The process of adsorption was carried out in total darkness during the trials, and the shaker water-bath was adjusted to 120 RPM to maintain the temperature. After the solutions reached adsorption equilibrium, they were detached by centrifugation, and their absorbance at λ = 575 nm was measured by means of a UV-Vis spectrophotometer. The effectiveness of elimination equation (1), the adsorption capacity at time t (q
t, mg/g), besides the adsorption capacity at equilibrium (q
e, mg/g) equation (2) [16,17,18]. The subsequent formulas attended as the foundation for these calculations [13,19,20]:
One commonly utilized method for experimental design to thoroughly assess the desired product is the BBD procedure. This method is known for its high level of effectiveness in achieving comprehensive and detailed results. By employing mathematical modeling to accurately depict the composed data, this method clarifies the controlling factors of the independent variables specifically adsorbent quantity, pH, and time that are important for attaining the primary objective of the reaction, which is the elimination of MV2B. This study’s primary focus is the use of the sophisticated Design-Expert software platform (Stat-Ease, Version 13) to conduct adsorption trials guided by the BBD technique. The information provides a thorough analysis of the diverse factor stages and their conforming codes at each level. It is typically made up of P center runs, “2 × n” axial runs, and 2n factorial runs. Depending on the response variables, the required number of experimental runs can be determined using equation (3).
One useful technique for determining the optimal mixtures of several constituents to yield the best testing consequences is RSM. This method makes use of the BBD, utilizing three-level incomplete factorial designs and accurate models to remove first and second-order coefficients. As an illustration of this method, a scenario will be created in which the ability to adsorb is improved with regards to four particular factors: duration, acidity level, quantity, and additional variables. Consequently, a three-level inquiry was conducted: neutral, affirmative, and adverse (Table S3) [22].
Figure S1(a) shows the XRD pattern of synthesized Fe3O4 nanoparticles and reference diffraction lines for magnetite (JCPDS No. 00-900-6318). The pattern displays reflections at 2θ around 30.4°, 35.8°, 43.5°, 53.9°, 57.5°, and 63.1°, corresponding to the (220), (311), (400), (422), (511), and (440) facets of the cubic spinel Fe3O4 structure. The strong match of experimental peaks with the reference standard confirms the synthesis of crystalline magnetite and the absence of additional peaks suggests high phase purity and good crystallinity of the nanoparticles. The XRD analysis corroborates that the synthesized iron oxide is exclusively pure magnetite (Fe3O4), with no evidence of hematite (α-Fe2O3) or maghemite (γ-Fe2O3). The obtained experimental diffraction peaks at 2θ values of approximately 30.47°, 35.84°, 43.51°, 53.95°, 57.51°, and 63.11° display a remarkable correlation with the standard JCPDS card 00-900-6318 for Fe3O4 and can be indexed to the distinctive crystal planes (220), (311), (400), (422), (511), and (440) characteristic of the cubic spinel structure. Importantly, no diffraction peaks associated with α-Fe2O3 (for instance, approximately at 24.1°, 33.1°, 49.5°, and 54.1°) or γ-Fe2O3 (notably around 23.7°, 26.1°, and 32.8°) were observed, indicating a lack of Fe2O3 phases within the XRD detection limits. Additionally, the strong correspondence between the experimental and reference peak intensities, as demonstrated by the congruent bars and comparative tabulation, reinforces the conclusion that a single-phase Fe3O4 material has formed. This phase purity aligns perfectly with the coprecipitation synthesis executed under stringent alkaline conditions in an inert atmosphere, known to promote magnetite formation while inhibiting oxidation to Fe2O3. In summary, these findings conclusively establish that the iron oxide produced in this study is pure Fe3O4, free from detectable Fe2O3 contaminants (Figure S1(b)). Table S5 compares the experimental XRD peaks of synthesized Fe3O4 nanoparticles with standard data (JCPDS card No. 00-900-6318). The observed reflections at 2θ values of 30.47°, 35.84°, 43.51°, 53.95°, 57.51°, and 63.11° align closely with reference peaks. The derived interplanar spacings (d-spacing = 2.93, 2.50, 2.08, 1.70, 1.60, and 1.47 Å) match expected values for the cubic spinel structure of magnetite. The results indicate highly crystalline, single-phase Fe3O4 with no extra peaks, confirming phase purity [21].
The main goals of XRD involve determining the proposed structure of the MV-MOF/CMC-CS and examining additional structural information. XRD techniques were employed to assess the structural reliability of the produced MV-MOF/CMC-CS. Figure 2(a) represents the XRD of the MV-MOF/CMC-CS, which were obtained by scanning over a range of 3–80°. The results show that the monoclinic crystalline structure belongs to the P4 space group. The considered limits indicate the crystal size as follows: a = 11.46 Å, b = 5.089 Å, c = 9.98 Å, α = 90°, β = 105.12°, and γ = 90°. Table S4 displays the distance between planes (d hkl ) and Miller indices (hkl) for MACC. It is worth noting that the MV-MOF/CMC-CS nanospheres reserved their diffraction peaks following adsorption, representative of the exceptional durability of the crystal assembly (Figure 2(a)). The distinct diffraction patterns of Fe3O4 created using solvothermal technique align completely with the standard designs of Fe3O4, as represented in Figure 2(a) [JCPDS card No. 00-900-6318], thus verifying the effective production of Fe3O4. The findings suggest that there has been an effective application of V-MOF onto the Fe3O4 surface. The produced MV-MOF/CMC-CS demonstrate outstanding absorption performance and effective magnetic separation ability [23].
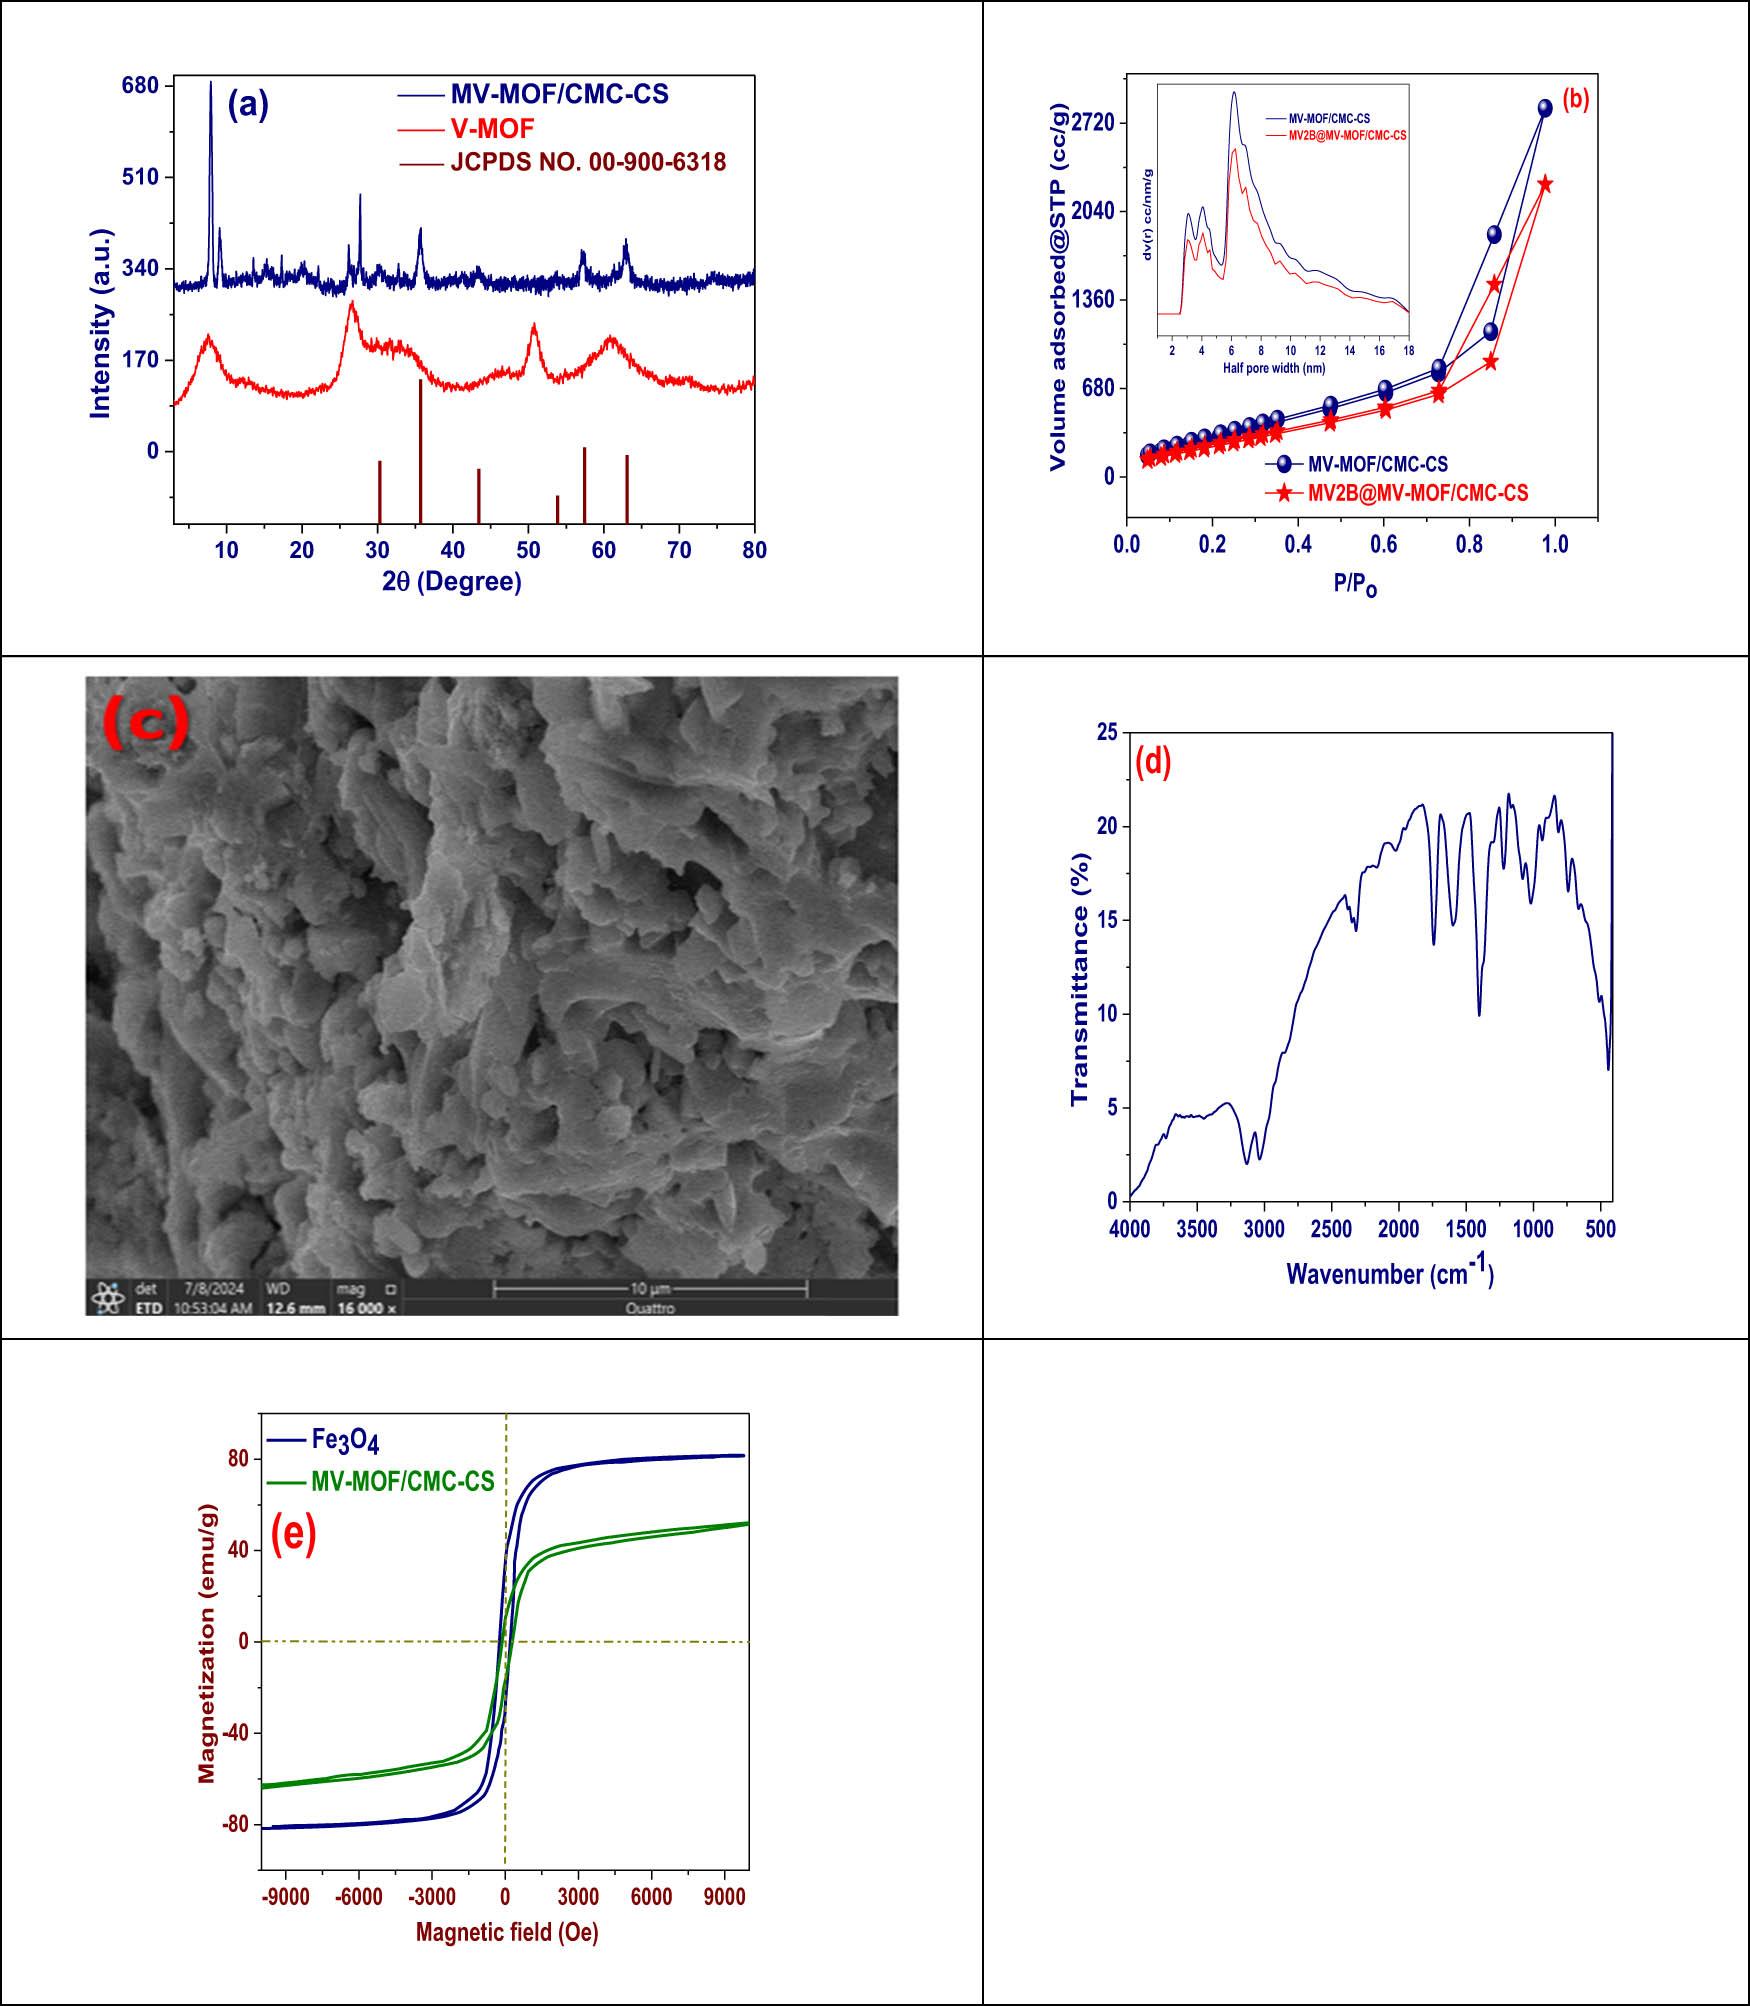
(a) XRD of MV-MOF/CMC-CS, (b) N2 adsorption/desorption of MV-MOF/CMC-CS and MV2B@ MV-MOF/CMC-CS, (c) SEM of MV-MOF/CMC-CS (d) FT-IR, and (e) magnetization of MV-MOF/CMC-CS, and MV2B@ MV-MOF/CMC-CS.
The BET adsorption isotherm is a crucial analytical tool for researching gas adsorption on the solid surfaces, particularly in the presence of MOFs. The BET Type III isotherm offers indispensable visions into the adsorption presentation of MV-MOF/CMC-CS. Observation of the typical Type III graph, which originally demonstrates a rapid increase at low pressure, representing the development of a monolayer on the MOF surface can be anticipated. The isotherm leveling out into a plateau as pressure rises signifies the beginning of monolayer saturation and multilayer adsorption. The distinct properties of MV-MOF/CMC-CS, such as their specific configuration and structure, are anticipated to have an impact on the form and features of the isotherm. An in-depth inspection of the MV-MOF/CMC-CS hydrogel beads’ BET Type III isotherm can expose crucial information about the material’s surface characteristics and adsorption potential. These data are crucial for prospective studies and the integration of MOFs in various scientific and technological fields. It is also important for enhancing MV-MOF/CMC-CS for numerous uses, including gas storage and catalysis (Figure 2(b)). This advises that, in contrast to adsorption, desorption can take place effectively at lower pressures. The MV-MOF/CMC-CS beads’ 8.28 nm pore size and 886.24 m2/g surface area have demonstrated their efficacy as an adsorbent. Its pore capacity of 4.39 cm3/g has designated it as mesoporous. The pore volume, in addition to surface area, decreased to 2.86 cm3/g and 642.86 m2/g, respectively, during the adsorption process. A portion of the MV2B dye was adsorbed within the MV-MOF/CMC-CS pores as part of the underlying interaction mechanism, as evidenced by the decrease in pore volume and surface area [23].
The SEM image of the MV-MOF/CMC-CS composite reveals a rough, irregular surface with a hierarchical porous structure ideal for adsorption (Figure 2(c)). It shows tightly packed, crumpled layers with folds and interconnected pores, highlighting a successful hydrogel framework. This morphology arises from crosslinking CMC with CS, forming a polymeric matrix that effectively integrates MV-MOF particles. The lack of significant agglomeration indicates a well-dispersed MV-MOF within CMC-CS, enhancing stability and uniformity. Additionally, micro- and meso-scale voids boost accessible surface area and dye molecule diffusion toward active sites. The rough texture offers multiple adsorption sites, facilitating strong interactions with dye molecules through various mechanisms. SEM analysis confirms that the MV-MOF/CMC-CS composite has a highly porous architecture, essential for effective adsorption and mass transfer [24].
The FT-IR spectrum of the MV-MOF/CMC-CS composite (Figure 2(d)) provides compelling evidence for the effective incorporation of the MV-MOF into the CMC–CS hydrogel system, while also illustrating the presence of various surface functional groups that contribute to adsorption phenomena. A broad and pronounced band observed in the 3,400–3,200 cm−1 region is attributed to the overlapping stretching vibrations of hydroxyl (–OH) groups from CMC and amine (–NH) groups from CS. This observation suggests a significant degree of hydrogen bonding within the polymer matrix. Additionally, the subtle bands detected around 2,920–2,850 cm−1 are ascribed to the aliphatic C–H stretching vibrations of –CH2 and –CH3 moieties present in the biopolymer backbone. A notable absorption band located at approximately 1,650–1,600 cm−1 is linked to amide I (C═O stretching) and/or C═C vibrations associated with the organic linker of the MOF, while the band observed near 1,540–1,500 cm−1 pertains to amide II (N–H bending concomitant with C–N stretching), thereby affirming the incorporation of CS within the composite structure. Furthermore, peaks observed in the range of 1,420–1,380 cm−1 are indicative of the symmetric stretching of carboxylate (–COO⁻) groups from CMC, suggesting their role in coordination and electrostatic interactions. The spectral bands identified between 1,150 and 1,000 cm−1 are ascribed to C–O–C and C–O stretching vibrations within the polysaccharide architecture, reflecting the establishment of a crosslinked hydrogel network. In the low-wavenumber region, the emergence of bands around 650–580 cm−1 corresponds to Fe–O vibrations, confirming the presence of magnetic Fe3O4. Moreover, the band located below 520 cm−1 is associated with V–O or V–N vibrations, attesting to the successful integration of vanadium metal nodes within the MOF framework. Collectively, these spectral characteristics substantiate the successful synthesis of the MV-MOF/CMC-CS composite, demonstrating that its rich array of oxygen- and nitrogen-containing functional groups can facilitate dye adsorption via mechanisms such as electrostatic attraction, hydrogen bonding, coordination interactions, and π–π stacking [24].
The magnetization characteristics of the developed MV-MOF/CMC-CS composite were examined through vibrating sample magnetometry to evaluate its magnetic properties and to approve the effective integration of Fe3O4. This examination is crucial for verifying the composite’s ability to be effectively separated from aqueous systems using an exterior magnetic field, which is a vital aspect for its request in water treatment. The ease and speed of recovering the adsorbent are key factors for both reusability and economic feasibility. Figure 2(e) displays the magnetic hysteresis loop, indicating that the MV-MOF/CMC-CS composite has a saturation magnetization (Ms) of 53.31 emu/g, in contrast to 82.5 emu/g for pure Fe3O4. Although the inclusion of Fe3O4 within the biopolymer-coated MOF results in a slight reduction in overall magnetic strength, the magnetization level remains adequate for efficient magnetic separation. This finding demonstrates that the composite retains its superparamagnetic characteristics following surface modification and structural encapsulation, thereby facilitating straightforward solid–liquid separation without the need for additional filtration processes. Consequently, the magnetization test supports the conceptual framework of developing a recyclable and magnetically retrievable adsorbent that is well-suited for efficient and scalable dye removal applications [25].
The analysis of the C1s XPS spectra for MV-MOF/CMC-CS and MV2B@MV-MOF/CMC-CS reveals significant alterations in the carbon chemical environments following the adsorption of the MV2B dye. These changes indicate the dye’s engagement with the composite surface. In the unmodified MV-MOF/CMC-CS sample, the C1s spectrum displays three prominent peaks. The principal peak at 286.11 eV (69.93%) is attributed to C–C/C–H bonds associated with the backbone of the MOF and biopolymer. The peak observed at 287.88 eV (29.51%) is linked to C–O functional groups, which are characteristic of CMC and CS; additionally, a minor peak at 289.42 eV (0.55%) is attributable to O–C═O functionalities (carboxyl or ester groups), suggesting a minimal occurrence of oxidized carbon species within the composite structure. Upon the adsorption of MV2B, noteworthy modifications in peak positions and intensities are observed. The primary peak experiences a minor shift to 285.14 eV (58.88%), still indicative of C–C/C–H bonds, though with a reduction in intensity. This suggests that there may be partial surface coverage or a reorganization of the carbon framework. Additionally, the C–O peak at 286.08 eV shows a considerable increase to 30.44%, which points to an enhancement in surface polarity and the participation of hydroxyl or ether functionalities in the interaction with the dye. Most notably, the O–C═O component at 288.12 eV increases significantly to 10.68%, indicating the formation or exposure of more carboxyl-related species. This is likely a result of connections, such as hydrogen bonding or electrostatic forces, with the functional groups present in MV2B. These spectral modifications unequivocally illustrate that the adsorption of MV2B induces changes in the composite’s electronic structure and surface chemistry, facilitated by interactions involving polar and oxidized carbon species [26].
The XPS O1s spectra of the MV-MOF/CMC-CS composite, both prior to and following the adsorption of MV2B dye, exhibit notable alterations in the oxygen chemical environment. These changes serve to confirm the strong contact among the composite material and the dye molecule. In the unmodified state of MV-MOF/CMC-CS, the predominant peak observed at 532.25 eV (48.85%) is associated with V–O bonds present in the MOF. This is succeeded by a peak at 533.29 eV (30.03%), which is linked to the C–O groups derived from the biopolymer (CS-CMC). Additionally, a less intense peak at 530.71 eV (21.12%) is identified, which pertains to bridging species such as O–V or O–Fe. Subsequent to the adsorption of MV2B, a notable alteration in the spectral data is detected, with the primary peak shifting to 530.18 eV (40.26%). This shift implies a strengthened interaction with lattice oxygen or oxygen atoms associated with metal centers, potentially as a result of chelation or electrostatic interactions with MV2B. Furthermore, the presence of a peak at 531.46 eV (31.8%) suggests an increased degree of hydrogen bonding among the functional groups of MV2B and the surface hydroxyl groups. In contrast, the C–O/O–C═O peak located at 532.4 eV (27.94%) shows a minor decrease, indicating a partial participation of biopolymer oxygen functionalities in non-covalent bonding processes. These observed changes in both peak positions and intensities serve as evidence of effective adsorption and subsequent structural rearrangement at the surface, primarily influenced by coordination, hydrogen bonding, and complexation dynamics [15].
The high-resolution N1s XPS spectra of MV-MOF/CMC-CS and MV2B@MV-MOF/CMC-CS display prominent modifications in the nitrogen chemical states subsequent to the adsorption of the MV2B dye, indicating a direct interaction with nitrogen-rich useful groups in the composite material. In the unmodified MV-MOF/CMC-CS sample, two main nitrogen species are detected: a prominent peak at 401.44 eV (70.25%), associated with protonated amine groups (NH3⁺), and a secondary peak at 402.3 eV (29.75%) linked to imine or amide-type nitrogen (NH2/–C═N), which are typically found in the CS backbone or within the coordination framework of the MOF. Post MV2B adsorption, significant shifts in the spectra are noted. The predominant peak shifts to 402.8 eV (67.4%), reflecting a shift and heightened intensity of nitrogen species that may be elaborate in hydrogen bonding otherwise electrostatic interactions with sulfonate or amine groups present in the dye, potentially leading to the stabilization of imine or oxidized nitrogen functionalities. A novel or displaced lower binding energy peak at 398.9 eV (32.6%) has been detected, which can be attributed to neutral amine or pyridinic nitrogen species. This observation implies either a partial reduction or a reconfiguration of nitrogen functionalities due to dye adsorption. The spectral modifications distinctly indicate that MV2B engages with both protonated and unprotonated nitrogen species within the composite, resulting in modified nitrogen environments. This alteration is likely facilitated by mechanisms such as coordination, hydrogen bonding, or electron transfer [26].
The Fe2p XPS spectra analysis of MV-MOF/CMC-CS, conducted prior to and following the adsorption of MV2B dye, reveals significant alterations in both the chemical environment and the oxidation states of iron [27]. This suggests direct interaction between the dye molecules and the iron centers present within the composite material. In its unaltered form, the MV-MOF/CMC-CS displays distinct spin-orbit doublets in the Fe2p region, corresponding to Fe2p3/2 and Fe2p₁/2, which are indicative of Fe3⁺ species often observed in iron-oxo clusters typical of MOFs [28]. Additionally, the presence of satellite peaks suggests that the iron exists in a stable oxidized state prior to dye interaction. Upon the adsorption of MV2B, the Fe2p spectrum exhibits significant broadening and splitting, alongside the attendance of new peaks and heightened satellite features. This remark proposes the existence of mixed-valence states, particularly indicating a partial reduction of Fe3+ to Fe2+. The alterations in the peak profile and energy are indicative of strong coordination or electrostatic connections among the useful groups of MV2B, notably the amino groups, and the iron centers. Consequently, there is a rearrangement of electron density and modifications in the oxidation state of iron. These spectral alterations provide clear evidence that iron plays an active role in the adsorption mechanism, facilitating the stabilization of MV2B through redox-sensitive and coordination interactions. This process, in turn, leads to changes in the local chemical structure of the composite [29].
The V2p XPS spectra of both MV-MOF/CMC-CS and MV2B@MV-MOF/CMC-CS reveal notable changes in the oxidation states and electronic environments of vanadium after the adsorption of MV2B dye. This emphasizes the active involvement of vanadium in the interaction process. In the unaltered MV-MOF/CMC-CS spectrum, two prominent peaks are observable: the V2p3/2 peak, which is the most intense and indicates vanadium in an oxidized state (likely V5+ or a mixture of V4+/V5+), and the V2p1/2 peak, its spin–orbit counterpart [30]. These findings suggest the presence of well-distributed vanadium species within the structure of the MOF. The characteristics of the peaks indicate stable and uniform V–O bonding environments in the composite substantial. Following the adsorption of MV2B, the V2p spectrum exhibits increased intensity, especially for the V2p3/2 peak, along with a sharpening and greater asymmetry in the peak profile. This suggests a greater influence from vanadium in a slightly reduced or altered coordination state. The alterations observed suggest significant electronic interactions between the vanadium sites and the dye that has been adsorbed. This interaction likely arises from coordination with nitrogen-bearing or electron-dense groups present in MV2B. The enhanced V2p3/2 signal and the changes in peak structure indicate a concentration of electron density surrounding the vanadium atoms. This observation substantiates the hypothesis that these atoms participate in stabilizing the dye through mechanisms that are sensitive to redox changes or mediated by ligands. Additionally, this analysis underscores the function of vanadium centers as effective sites for adsorption within the hybrid composite (Figure 3) [26].
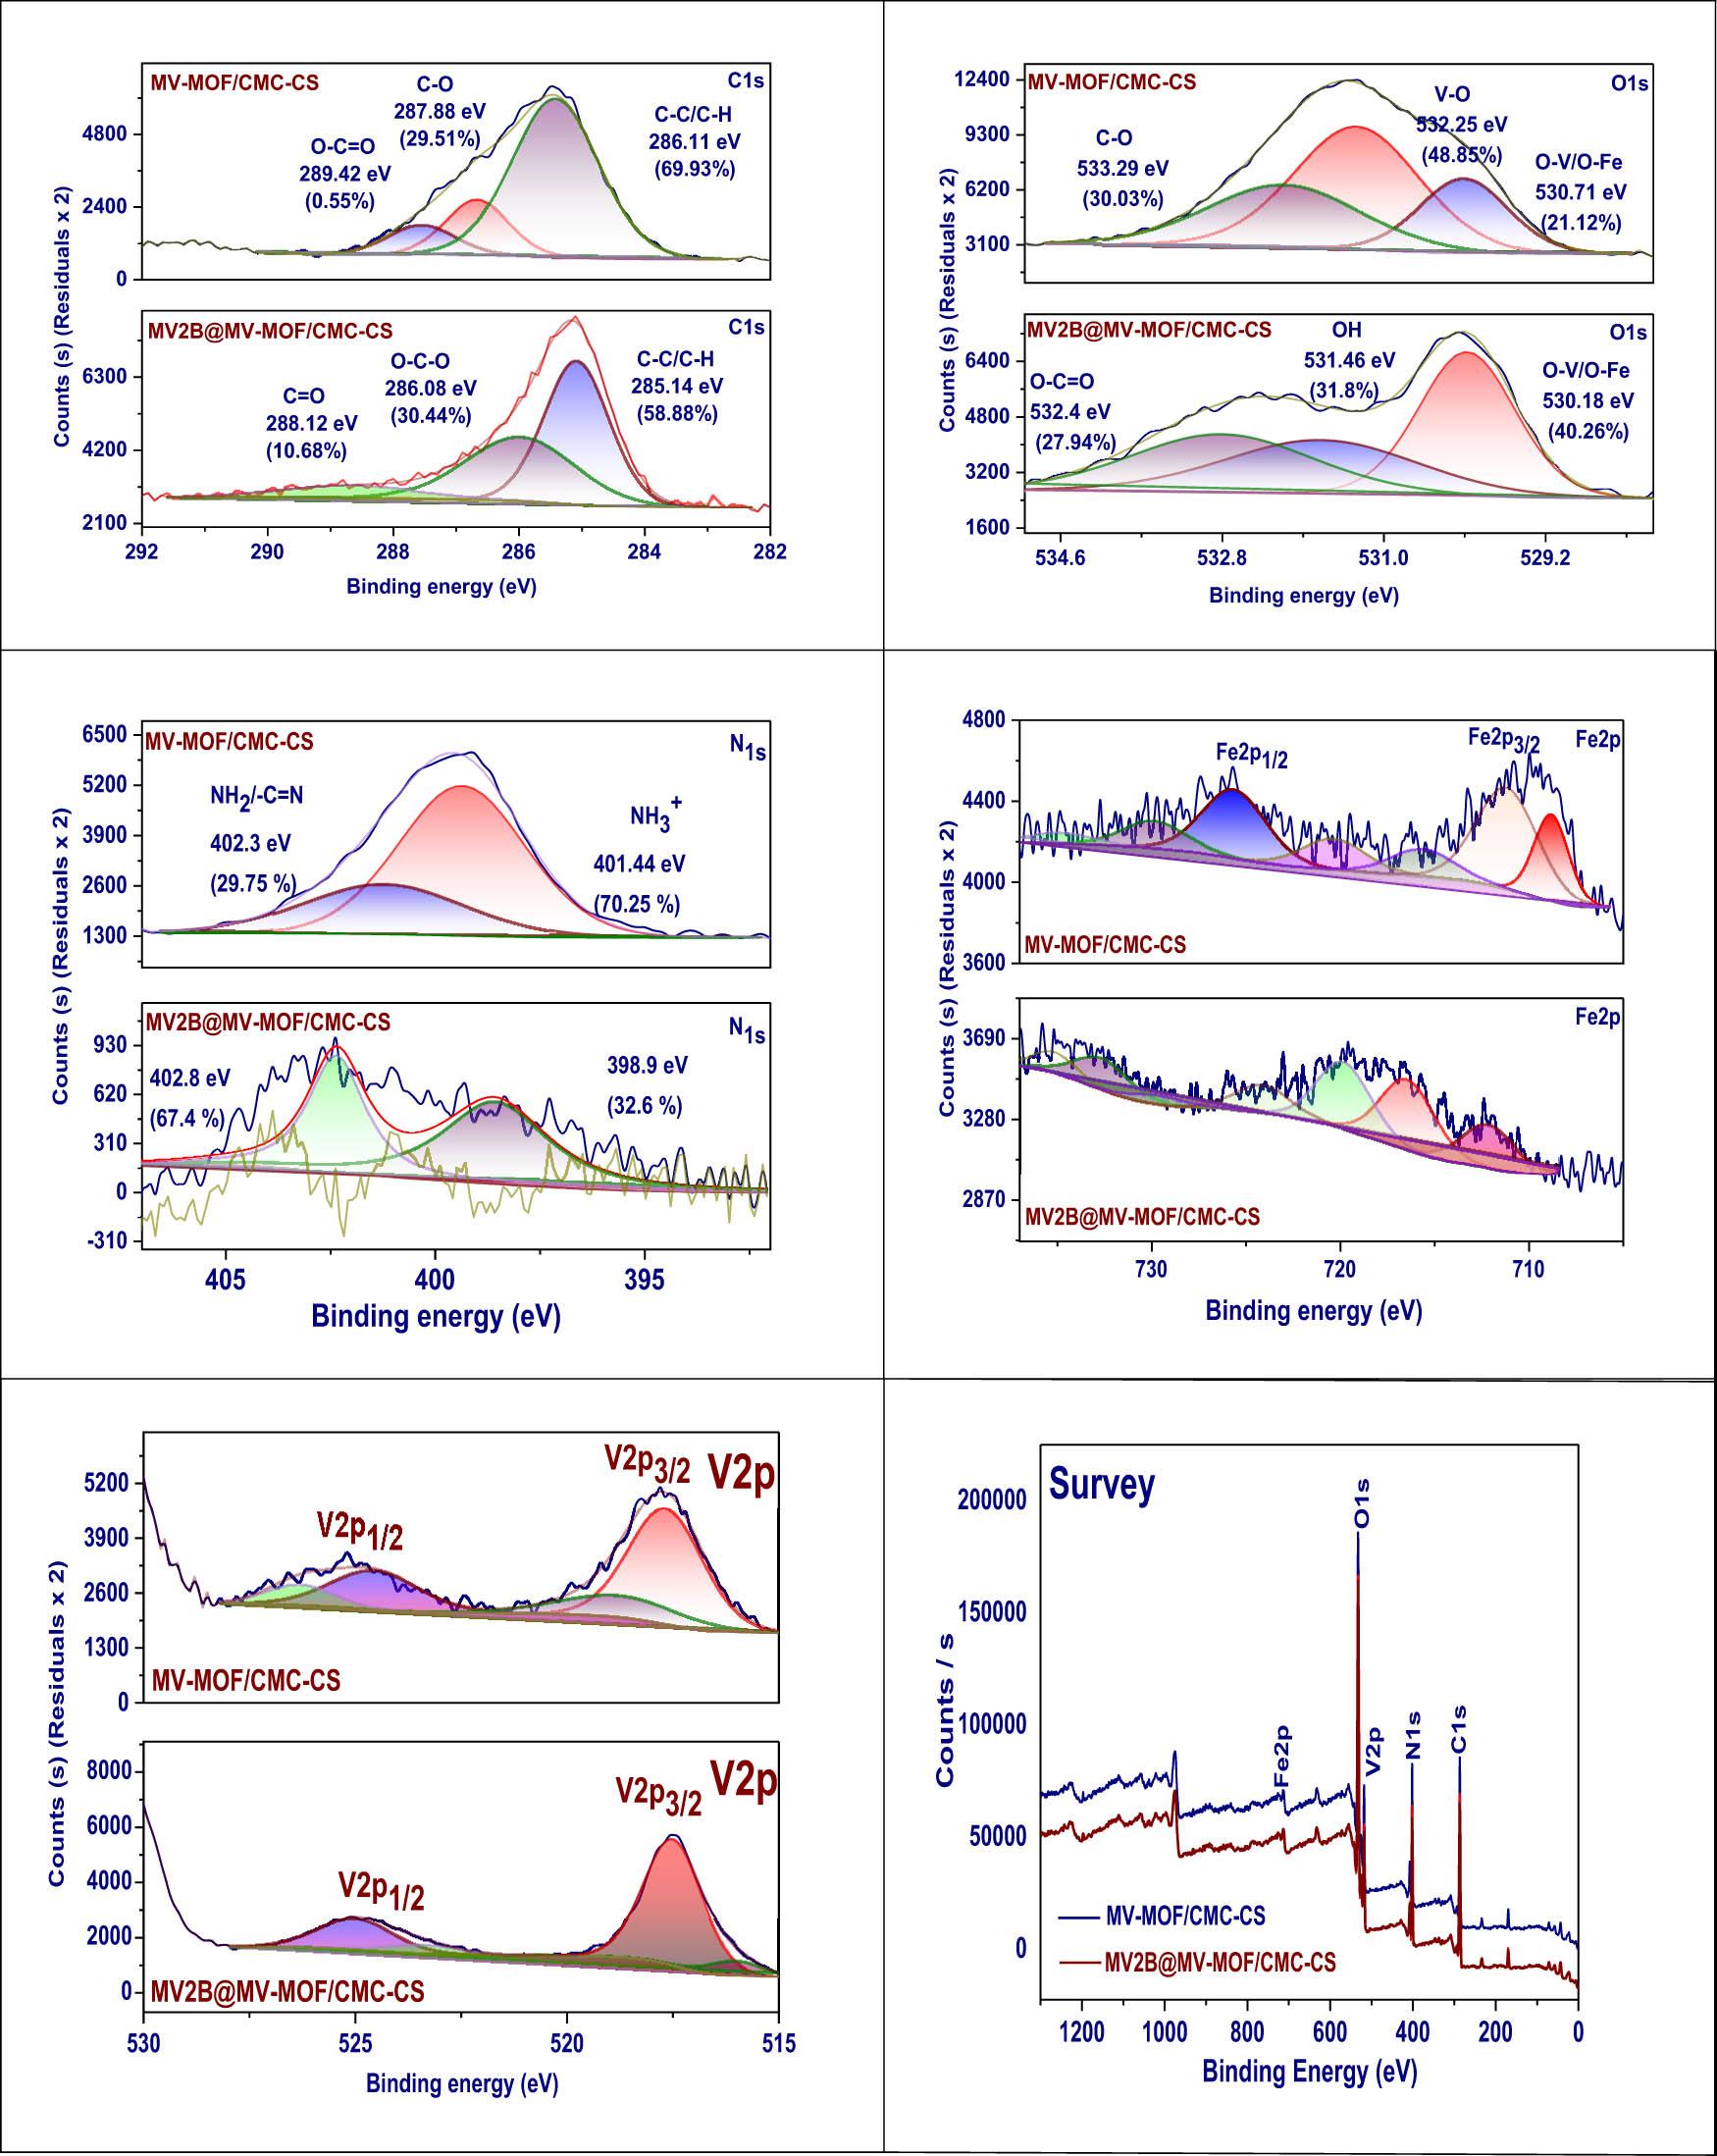
XPS of MV-MOF/CMC-CS and MV2B@ MV-MOF/CMC-CS.
The wide-scan XPS survey spectra of MV-MOF/CMC-CS and MV2B@ MV-MOF/CMC-CS provide an inclusive overview of the elemental composition and confirm the successful incorporation and surface interaction of MV2B dye with the composite. In the pristine MV-MOF/CMC-CS (blue spectrum), prominent peaks corresponding to O1s, C1s, N1s, V2p, and Fe2p are clearly observed, reflecting the contributions from the MOF (vanadium and iron), the biopolymer components (CS and CMC), and their functional groups. After MV2B adsorption (red spectrum), the survey spectrum exhibits several notable changes: an increase in N1s intensity, indicating an elevated nitrogen content due to the nitrogen-rich structure of MV2B, and a slight enhancement in the C1s peak, reflecting the organic nature of the dye. Additionally, the Fe2p and V2p signals remain present, but slight shifts or intensity differences can be observed, suggesting subtle changes in their oxidation states or surface coverage by the dye molecules. The clear presence of O1s in both spectra confirms the dominance of oxygen-containing groups across both the MOF and polymer matrix, which play key roles in adsorption. These overall spectral changes confirm that MV2B has been successfully adsorbed onto the surface of MV-MOF/CMC-CS, altering the surface chemical composition through incorporation of additional nitrogen and carbon species, and reinforcing the conclusions drawn from high-resolution scans of individual elements. Following the adsorption of MV2B dye onto the MV-MOF/CMC-CS composite, the O1s XPS spectrum reveals three distinct peaks, each representative of different oxygen environments that illustrate the chemical interactions at play. The first peak observed at 530.18 eV (40.26%) is linked to lattice oxygen or oxygen atoms associated with metal centers (O–V/O–Fe). The heightened intensity of this peak indicates a robust coordination interaction among the dye particles and the vanadium or iron sites in the MOF structure, suggesting potential chelation or electrostatic binding. The second peak at 531.46 eV (31.8%) is ascribed to adsorbed oxygen species or hydroxyl groups (–OH) present on the surface. The relatively high proportion of this peak indicates reinforced hydrogen bonding interactions among the practical groups of MV2B (such as sulfonic acid or amine groups) and the surface hydroxyls of the composite. The third peak at 532.4 eV (27.94%) is associated with oxygen in C–O or O–C═O groups that originate from the biopolymer matrix (CS-CMC). The slight reduction in its contribution compared to the unmodified material implies that some of these groups are complicated in non-covalent interactions with the dye molecules or are partially shielded after adsorption. These changes in the O1s spectrum confirm that the adsorption of MV2B induces significant chemical interactions with both the MOF and polymer components of the composite, engaging mechanisms such as coordination, hydrogen bonding, and surface complexation [31].
Establishing the pH at which the investigated adsorbent MV-MOF/CMC-CS reaches the zero-charge point (pHpzc) provides a better understanding of how varying pH levels impact their adsorption effectiveness. Generally, the surface materials carry a positive charge at pH values lower than pHpzc and a negative charge at values greater than pHpzc. Figure 4(a) displays the pHpzc curve for the MV-MOF/CMC-CS. If the pH exceeds the pHpzc value, the MV-MOF/CMC-CS exhibits a negative surface charge, rendering them appropriate for adsorbing positively charged adsorbates. Robust electrostatic interactions may occur between the opposing charges of the MV-MOF/CMC-CS composite and the solutions of MV2B dye with a pH higher than the pHpzc for MV-MOF/CMC-CS, as depicted in Figure 4(a). This shows that solutions with a pH greater than 5.69 are favored for the absorption of MV2B dye by the MV-MOF/CMC-CS adsorbent [32].
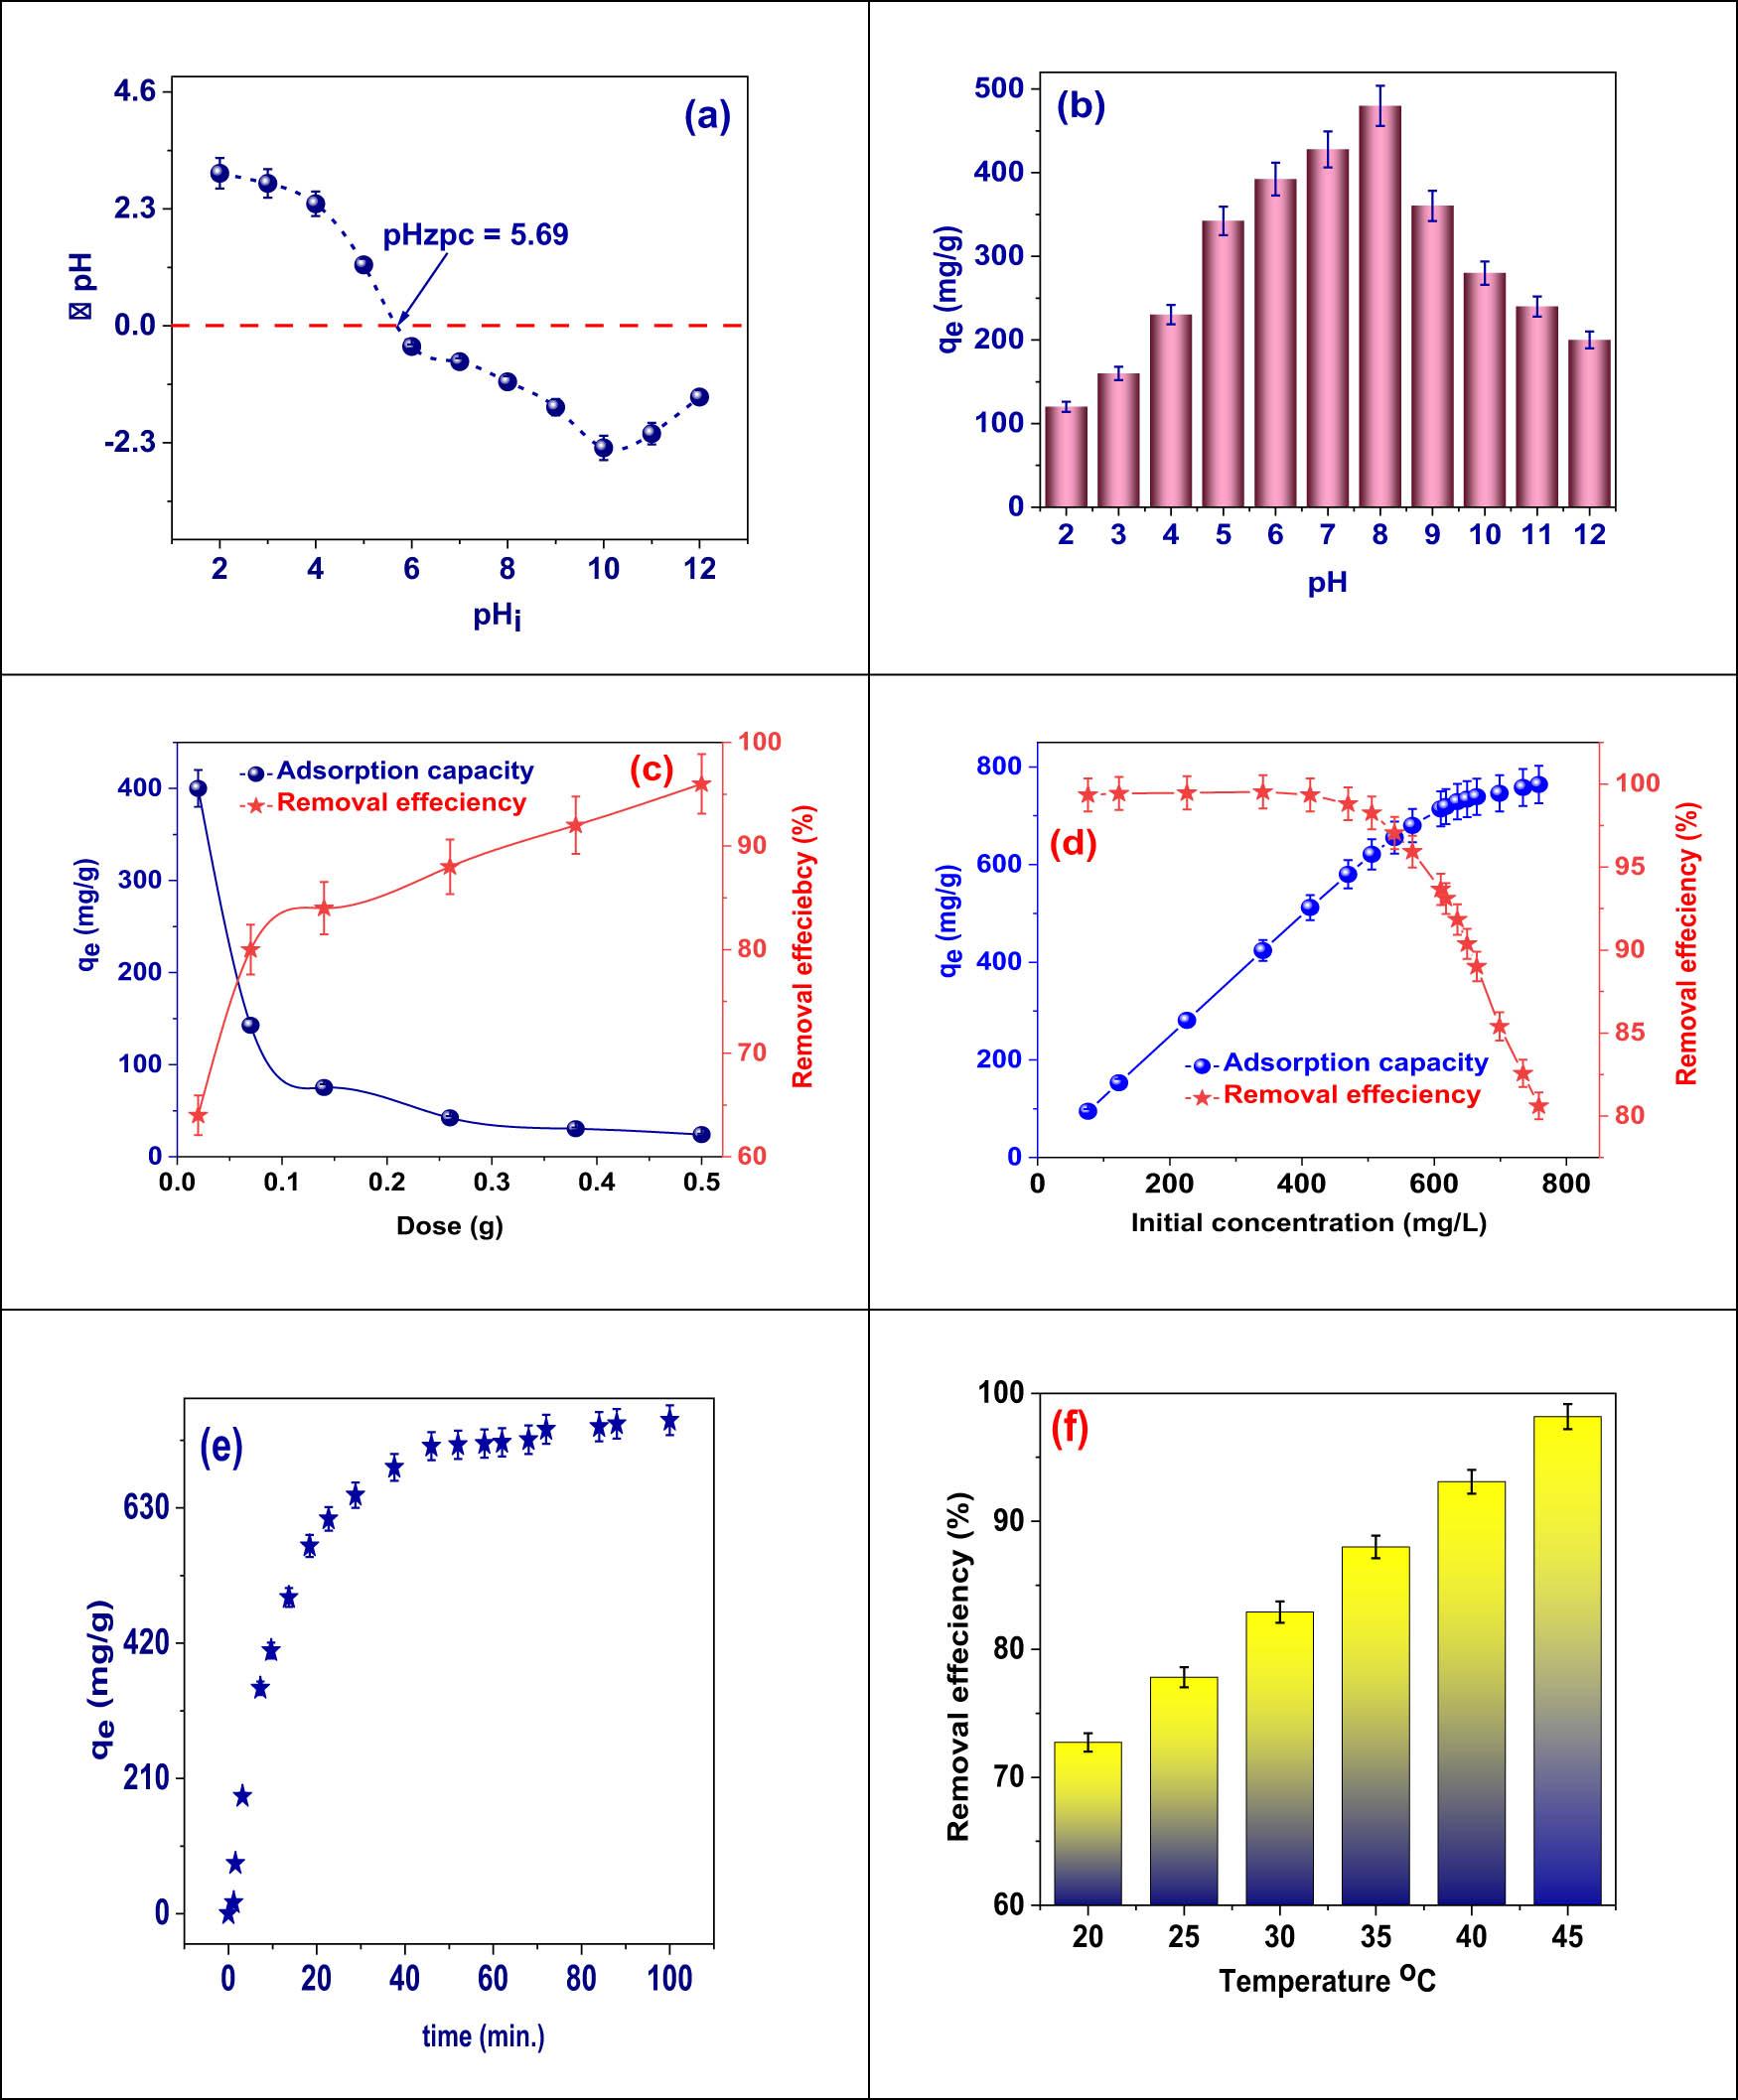
(a) Determination of pHpzc, (b) influence of pH on adsorption of MV2B dye, (c) influence of dose, (d) influence of original concentration of MV2B dye, (e) influence of communication time, and (f) temperature’s influence on MV2B dye adsorption on MV-MOF/CMC-CS.
The adsorption capabilities of MV-MOF/CMC-CS hydrogel beads are notably affected by the pH of the solution, as depicted in the accompanying figures. The analysis of the ΔpH about the initial pH (pH0) allowed for the resolve of the zero point of charge (pHzpc) of MV-MOF/CMC-CS, which was found to be 5.69. This means that when the pH falls below this threshold, the surface of the adsorbent shows a positive charge, while as the pH rises over this threshold, it shows a negative charge. The plot illustrating adsorption capacity (qₑ vs pH) reveals a significant increase in dye uptake between pH 2 and 8, with a peak of roughly 480 mg/g at pH 8, shadowed by a weakening at elevated pH levels (Figure 4(b)). This movement can be clarified by the charge characteristics of the surface: when pH is less than 5.69, the positively charged surface repels the cationic MV2B dye, leading to reduced adsorption. In contrast, at pH values larger than 5.69, the surface gets a negative charge, which enhances the electrostatic attraction to the dye, thus improving adsorption efficiency. The decrease observed beyond pH 8 may result from a high concentration of OH− ions competing with the dye particles or varying the interactions at the surface. Overall, these results underscore the critical influence of pH on the electrostatic interactions and other mechanisms, such as π–π stacking, hydrogen bonding, and pore-filling, in the adsorption process of MV2B dye, with optimal adsorption occurring at pH 8 [33].
The adsorption efficiency for a given concentration is also significantly influenced by the amount of adsorbent utilized. As shown in Figure 4(c), a higher adsorbent dose, ranging from 0.02 to 0.50 g/25 mL, resulted in an improved elimination percentage (R%) of MV2B dye. However, once the adsorbent dose surpassed this range, there was no significant change observed. The significant rise in the elimination rate during the initial phase is indicative of an increase in the number of active places, thus enabling the retention of MV2B dye particles. The percentage of removal has risen from 64.2 to 96.6% initially, while the adsorbent capacity has decreased from 400 to 24 mg/g. These findings support those found in earlier studies of removing cationic dye using MV-MOF/CMC-CS [34].
As indicated by the outcomes of equation (1), the influence of the primary concentrations of MV2B (reaching from 75 to 750 mg/L) and a interaction period of 100 min on the elimination of adsorbent dye is depicted in Figure 4(d). The efficiency of elimination decreased from 98.3 to 80.6% as the primary concentration of MV2B dye elevated from 75 to 750 mg/L. The regions of adsorption by the adsorbent’s surface normally fill up as the concentration of a dye in a solution increases, lowering the removal efficiency. The values of q e and the mass transfer driving force increase in tandem with the initial concentration of MV2B dye because there are more dye molecules surrounding the active sites of MV-MOF/CMC-CS [35].
Based on the results of equation (1), it is critical to provide sufficient contact time to attain equilibrium in the bio-sorbent dye organization, after which there is no longer any net mass transfer among the solid and solution phases. Effective adsorption is essential for treating water and wastewater since it relies on the adsorbent’s speedy absorption and stability development. The quick adsorption of MV2B dye was observed at first 50 min Figure 4(e). The rate of the process decelerated when the vacant spots on MV-MOF/CMC-CS were filled with the dye, resulting in the establishment of equilibrium. Additionally, once the ideal duration of agitation was allowed, the removal capacity at the point of equilibrium was not influenced by time, thus the 100 min settling period was considered optimal in all of the equilibrium experiments [35].
The study observed the reduction in MV2B dye at altered temperatures, from 20 to 45°C, to establish the adsorption thermodynamic parameters. Findings from the experiment designate that the elimination of dye increased from 72.7 to 98.18% as the temperature elevated from 20 to 45°C, as depicted in Figure 4(f). Fluctuations in temperature influence the adsorbent’s ability to reach equilibrium capacity for a specific adsorbate because the rate of dispersion of dye molecules is regulated by temperature. Since the viscous forces of the solution provided less resistance, raising the temperature in the current study promoted the quick diffusion of dye particles toward the outer boundary layer and the interior pores of the adsorbent subdivisions. Under certain circumstances, the ability of adsorbate molecules to dissolve was altered, leading to a significant influence on the extraction process. The increase in pore size could also contribute to the enhanced adsorption capacity of adsorbents at elevated temperatures [36].
The use of adsorption isotherm models, such as Langmuir [37], Freundlich [38], Dubinin–Radushkevich (D–R) [39], Temkin [40], and Jossens, offers substantial assistances for comprehending MV2B dye adsorption on MV-MOF/CMC-CS. These models explain all the adsorption mechanisms, capacity, and character of the connections between adsorbates and adsorbents (Table S6).
The utilization of adsorption isotherm models, precisely the Langmuir isotherm, to investigate the adsorption of MV2B dye onto MV-MOF/CMC-CS offers numerous significant benefits. The Langmuir model, characterized by a K L value of 0.55 L/mg and a q m value of 764.2 mg/g, reveals a significant attraction between the hydrogel beads and the dye, as well as a substantial maximum adsorption capacity. The K L parameter indicates the equilibrium binding strength, indicating the level of interaction among the adsorbent besides adsorbate, with a greater value indicating efficient adsorption at lower concentrations (Tables S7 and S8). The q m parameter signifies the maximum potential uptake of MV2B dye by the beads, highlighting the impressive adsorption capability of the material. Applying the Langmuir model allows for the anticipation of adsorption patterns under different circumstances and aids in enhancing the adsorption procedure for optimal effectiveness. Additionally, it confirms the monolayer adsorption process on a homogeneous surface, offering crucial data for the development of effective adsorbents for practical requests like effluent treatment [37].
Using the models of adsorption isotherm, specifically the Freundlich isotherm, for examining the MV2B dye adsorption on MV-MOF/CMC-CS offers significant benefits, as described in Figure 5(a). The Freundlich model’s K F value, at 347.83 mg/g (L/mg)1/n and a 1/n value of 0.171, proposes that the adsorption procedure takes place on a diverse surface and is multilayer in its characteristics. This K F value demonstrates the adsorption capability, representing that the hydrogel beads possess a high capability to adsorb MV2B dye at elevated concentrations. The value of 1/n designates promising adsorption, since values of 1/n < 1 indicate that adsorption becomes more efficient as the concentration increases, demonstrating that the adsorbent performs effectively even at varying concentrations of MV2B dye. This model offers adaptability in explaining the adsorption characteristics in intricate systems with diverse surface energies, leading to a more comprehensive comprehension of the adsorbent’s efficiency across a broad spectrum of concentrations. It is particularly beneficial for systems with surface heterogeneity and multilayer adsorption, assisting in the optimization of adsorption procedures [38].
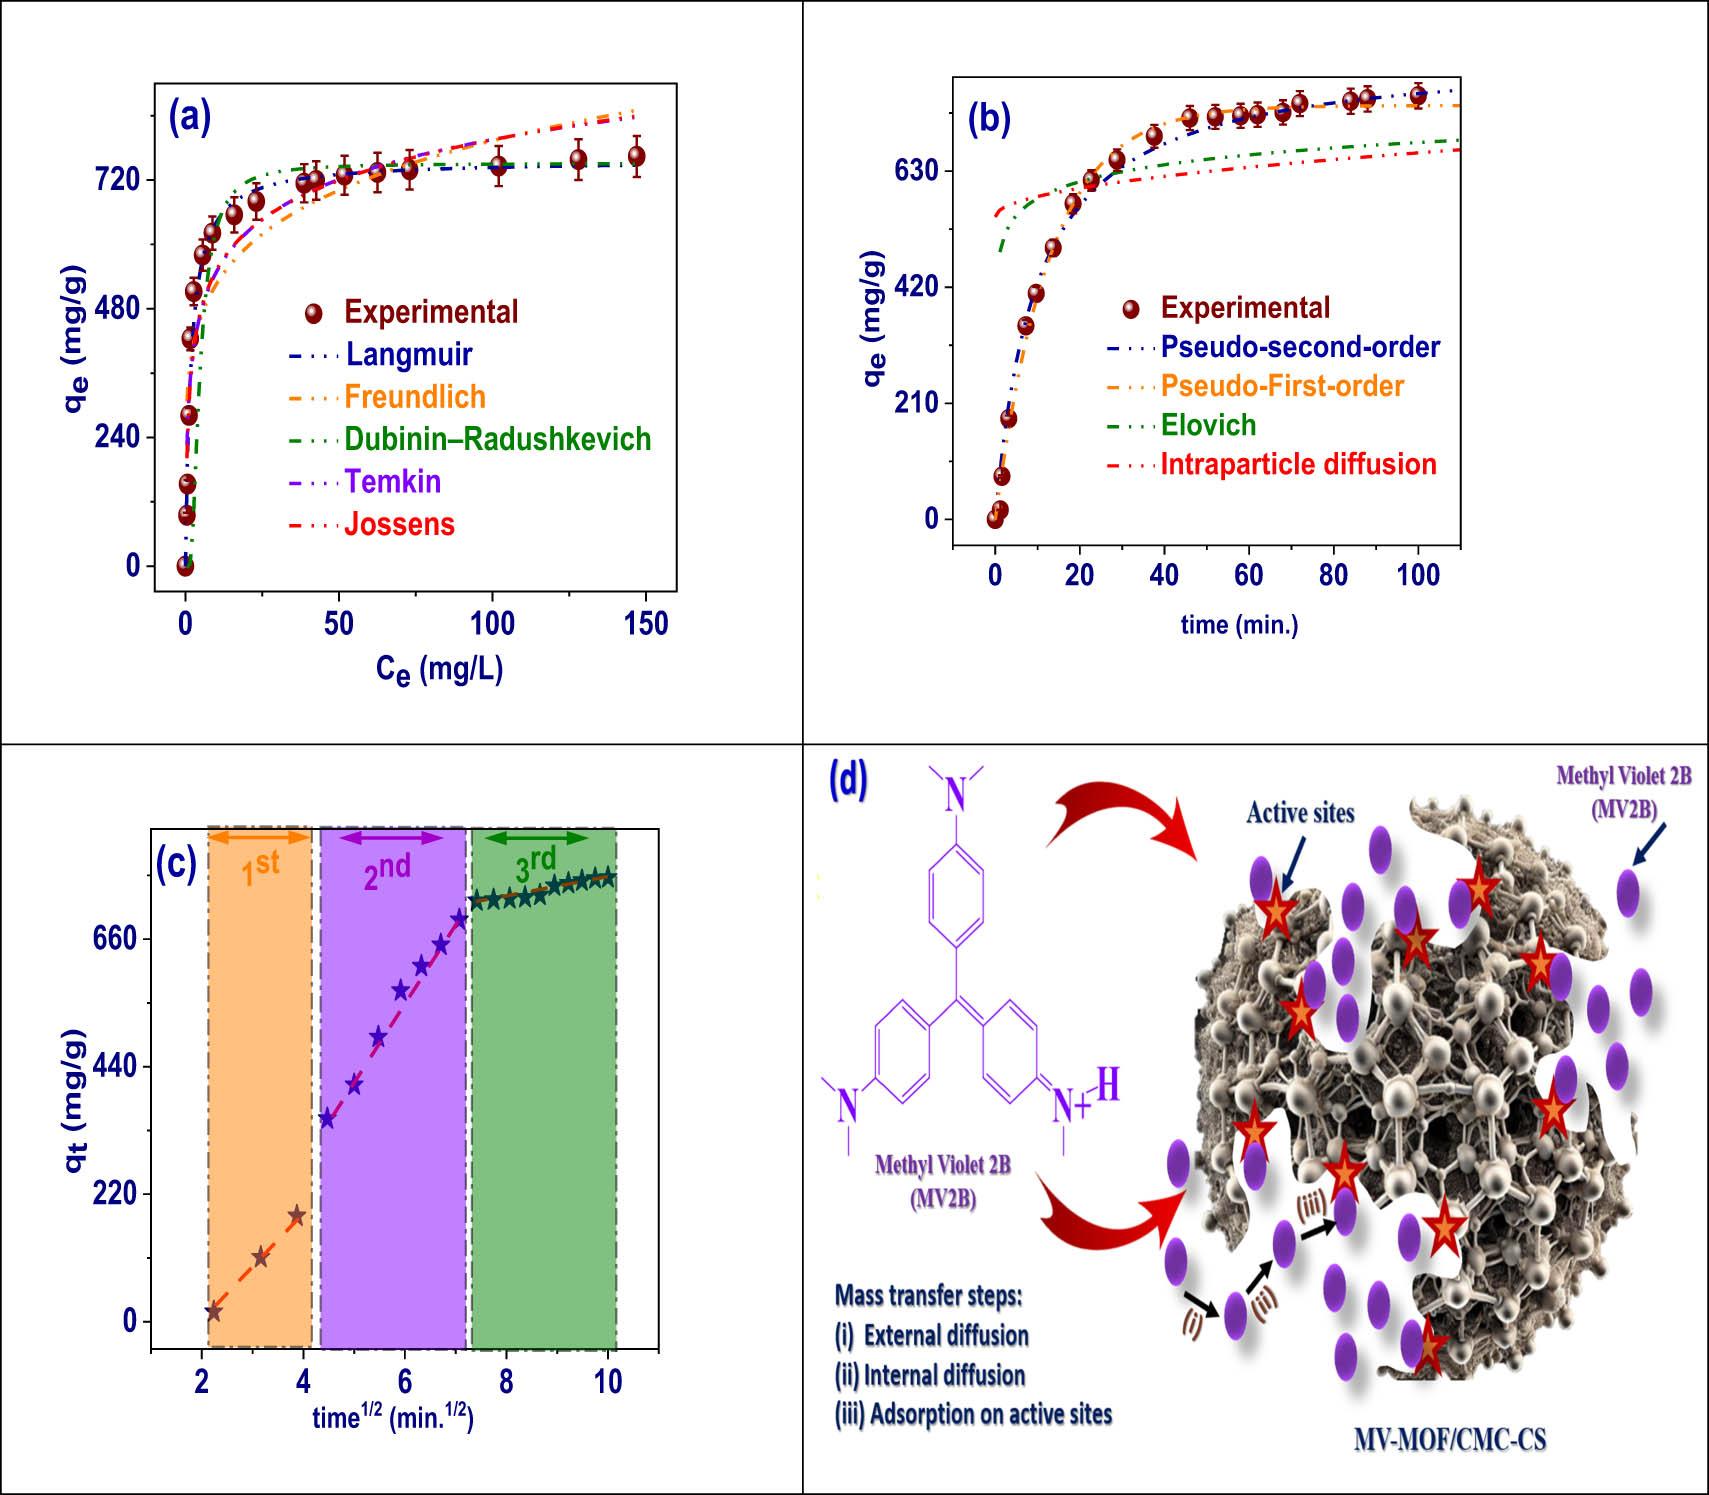
(a) Models of the adsorption isotherm, (b) adsorption kinetic model, (c) IPD model, and (d) illustration of diffusion of MV2B dye onto MV-MOF/CMC-CS.
The employment of the models of adsorption isotherm, specifically the D–R model, suggestions substantial aids in comprehending the adsorption of MV2B dye onto MV-MOF/CMC-CS. With a Q DR value of 751.03 mg/g, the model suggests a significant adsorption capacity for the hydrogel beads in absorbing MV2B dye. The K DR importance of 3.24 × 10⁻⁶ mol2/kJ2 and the activation energy (E a) of 32.8 kJ/mol indicate that the adsorption process is mainly attributed to chemisorption, considered by strong chemical bonds amongst the adsorbate and adsorbent. The D–R model is especially valuable in differentiating between physical and chemical adsorption, where E a values exceeding 20 kJ/mol signify chemisorption. This understanding is important for comprehending the power and workings of the adsorption technique, allowing for the optimization of material for specific uses that demand stronger, permanent adsorption, such as in the purification of water or the elimination of dyes from waste. The concentration on the permeable composition of the adsorbent in the D–R model offers insight into the efficient capture and retention of MV2B dye molecules by MV-MOF/CMC-CS, establishing it as a reliable model for studying adsorption on permeable materials [39].
The utilization of the model of Temkin adsorption isotherm to investigate the adsorption of MV2B dye on MV-MOF/CMC-CS presents various significant benefits. The b T value of 28.03 J/mol and the K T value of 16.27 L/mol furnish valuable information regarding the adsorption heat and equilibrium binding constant, respectively. The b T value indicates the heat of adsorption, indicating that the energy decreases in a linear manner with increasing surface coverage. This is important for comprehending the progression of the adsorption process as more MV2B dye particles adhere to the hydrogel surface. Because it implies that the adsorbent’s surface characteristics affect the interactions between the adsorbent and adsorbate, this model is suitable for heterogeneous systems such as MV-MOF/CMC-CS. The binding constant (K T value) signifies the strength of the interaction between MV2B dye and the hydrogel beads, demonstrating a strong affinity between the adsorbate and adsorbent. The Temkin model’s emphasis on the decrease in adsorption energy as sites become occupied provides insight into non-ideal adsorption behavior, particularly in systems where interaction forces on the adsorbent surfaces may fluctuate during adsorption. This model enables a more accurate portrayal of adsorption patterns in systems with intricate surface energies, offering a deeper comprehension of how hydrogel beads can be enhanced for practical uses such as dye removal and water treatment [40].
The Jossens isotherm model provides notable assistance for investigating the adsorption of MV2B dye on MV-MOF/CMC-CS, particularly in intricate systems where the adsorption behavior varies from ideal conditions. The model is especially valuable in characterizing systems with varied adsorption sites or less than perfect adsorption. In this instance, with a K value of 819.7 and a J value of 1.88, the model signifies robust adsorption tendencies and offers understanding into the intricacy of the adsorption surface. The K value indicates the equilibrium constant and indicates the total efficiency of the adsorption procedure. A large K value, such as 819.7, designates that the beads have a strong attraction to MV2B dye, indicating a high level of efficacy in capturing and preserving the dye molecules. The J factor, which characterizes the heterogeneity of adsorption, reflects the extent of non-ideal behavior during the adsorption process. A J factor of 1.88 implies that the adsorption occurs on heterogeneous exteriors, where the adsorption places possess different energies. Utilizing the Jossens model offers a more precise description of adsorption, particularly in instances where the adsorbent surface is non-uniform and various adsorption mechanisms may take place [41].
Table S8 presents an analysis of adsorption isotherms for the elimination of MV2B dye, illustrating the enhanced effectiveness of MV-MOF/CMC-CS compared to other options. Based on the Langmuir model, MV-MOF/CMC-CS exhibits the highest experimental adsorption capability of 764.2 mg/g, a theoretical capacity of 762.8 mg/g, and the most favorable affinity constant (K L = 0.55 L/mg), along with an advantageous separation factor (R L = 0.6). Further analysis using the Freundlich model demonstrates that MV-MOF/CMC-CS beads possess the highest intensity (n = 5.87) and constant (K F = 347.83), indicating substantial adsorption on a non-uniform surface Figure 5(a). The D–R model indicates a maximum capacity (Q DR = 751.03 mg/g) and adsorption energy (Eₐ = 32.8 kJ/mol) for MV-MOF/CMC-CS beads, suggesting significant chemisorption capabilities. Additionally, analysis through the Temkin model shows a notable binding energy (b T = 23.03 J/mol) and equilibrium constant (K T = 16.27 L/mol) for FTMCP, reflecting strong interactions. The Jossens model supports the homogeneity of MV-MOF/CMC-CS beads, evidenced by the highest K value (819.7) and the lowest J value (1.88). In conclusion, the incorporation of the MV-MOF CS-CMC hydrogel matrix significantly improves adsorption capacity and contact consistency, establishing MV-MOF as the most effective adsorbent among those evaluated, as illustrated in Figure S2(a).
The use of adsorption models of kinetics, including pseudo-first-order [42], pseudo-second-order [43], intraparticle diffusion (IPD) [44], and Elovich [40], gives a detailed explanation of the mechanism and rate of MV2B dye adsorption onto MV-MOF/CMC-CS. The pseudo-first-order model is valuable in forecasting the initial rate of MV2B adsorption in systems where physisorption predominates since it asserts that the rate of adsorption is proportional to the number of obtainable adsorption sites (Table S6). The pseudo-second-order model, designed for systems controlled by chemisorption, delivers a more detailed estimation of the equilibrium adsorption capability and indicates a more robust, non-reversible connection among the dye and the hydrogel beads. The IPD model investigates the influence of pore diffusion on the adsorption procedure, specifically determining if the rate is restricted by the diffusion of MV2B dye particles into the porous assembly of the beads. The Elovich model holds significant value for systems characterized by heterogeneous surfaces, donating valuable visions into the impact of surface interactions and activation energy barriers on the rate of adsorption, particularly as surface coverage steadily increases Table S7 and S9.
Utilizing the model of pseudo-first-order kinetic to analyze the adsorption of MV2B dye onto MV-MOF/CMC-CS, which has a rate constant (K 1) of 0.077 min−1 × 10⁻², presents numerous benefits in comprehending the adsorption procedure. The request of the pseudo-first-order kinetic model in the examination of MV2B dye adsorption on MV-MOF/CMC-CS, with a rate constant (K 1) of 0.077 min−1 × 10⁻², offers several advantages in understanding the adsorption procedure. The K 1 value provides insight into the speed at which equilibrium is reached, with a lower value indicating a moderate adsorption rate (Table S7). This suggests that while MV2B dye is steadily adsorbed on the beads, the process is not instantaneous but progresses over time. The model helps in predicting the initial adsorption behavior, optimizing the contact time needed for effective dye removal, and offers a foundation for comparing different adsorbents or experimental conditions to achieve maximum adsorption efficiency in practical applications like wastewater treatment [42].
The employment of adsorption kinetic models, specifically the pseudo-second-order model, to investigate the adsorption of MV2B dye on MV-MOF/CMC-CS provides notable benefits, particularly with a rate constant (K 2) of 1.208 × 10⁻⁴ g mg−1 min−1 × 10⁻² and an equilibrium adsorption capacity (q e) of 766.2 mg/g. The pseudo-second-order model accepts that chemisorption drives the adsorption rate, which is comparative to the square of the number of accessible sites to begin with. This model suggests that MV2B dye binds tightly to the hydrogel beads, which is especially helpful for systems where the adsorbent and adsorbate have strong, irreversible connections (Figure 5(b)). Despite being relatively low, the K 2 value, which represents the rate of adsorption, shows a continuous increase toward equilibrium. The hydrogel beads’ outstanding adsorption capacity for MV2B is demonstrated by the high q e value of 766.2 mg/g, which shows that the substance can absorb a sizable amount of the dye. In practical applications, such as wastewater treatment, where knowing the strong binding capacity and slow but stable adsorption rate is essential for designing effective adsorbents, this model is very helpful for optimizing adsorption procedures. It also predicts equilibrium adsorption capacity more precisely than the model of pseudo-first-order [43].
The intraparticle diffusion (IPD) model proposes significant understanding of the process of adsorption, particularly for determining the stages that limit the rate of adsorption of MV2B dye onto MV-MOF/CMC-CS. With a rate constant (K i ) measuring 11.55 mg g−1 min1/2 and an intercept (X) of 574.42 mg/g, this model assists in defining if IPD aids as the chief factor impeding the adsorption procedure. The rate at which MV2B molecules diffuse through the hydrogel beads’ pores is indicated by the K i value; a comparatively high value implies rapid IPD. On the other hand, the X value (the intercept) tells us how thick the boundary layer is, suggesting that surface adsorption is just as important as pore diffusion. Optimizing the presentation of the adsorbent requires knowing whether the adsorption procedure is ruled by IPD (adsorption within the pores) or external diffusion (adsorption on the outer surface), which may be done by using this model. High K i and X values together imply that surface adsorption plays a major role, particularly in the early phases, even though IPD is also substantial. For real-world uses like wastewater dye removal, an understanding of these dynamics aids in the design of adsorbents with improved pore structure and the optimization of conditions to optimum adsorption effectiveness [44].
MV2B dye adsorption onto MV-MOF/CMC-CS can be better agreed by means of the Elovich kinetic model, especially when β is 1234.4 g/mg and α is 43.96 mg g−1 min−1. Usually, the Elovich model is used in systems with heterogeneous surfaces where activation energy barriers or surface coverage cause adsorption rates to gradually decline. As more MV2B dye particles are adsorbed onto the beads, the rate of adsorption reduces, as indicated by the β value, which represents the desorption constant. In situations where the adsorbent surface is saturated or has fewer accessible active sites, a greater β value indicates that the adsorption rate drops off considerably as surface coverage rises. With a rate constant of 11.55 mg g−1 min1/2 and an intercept of 574.42 mg/g, this model helps in ascertaining whether IPD is the primary factor hindering the adsorption process. Utilizing the Elovich model delivers a more precise description of the adsorption performance over a duration, especially in situations where surface diversity and energy obstacles influence the adsorption process. This approach proves advantageous in informing the design of adsorbents to increase the understanding of adsorption rate evolution and determine optimal conditions for maximizing adsorption efficiency. This is particularly relevant in applications such as removing dyes from wastewater. Furthermore, this approach offers appreciated visions into the extended presentation of the adsorbent, with the gradual decline in the adsorption rate being a significant consideration [40].
Tables S9 represented the results from the kinetic modeling clearly demonstrate that the adsorption efficiency of MV-MOF is significantly improved after its encapsulation with CMC and CS to create MV-MOF/CMC-CS beads. The model of pseudo-second-order kinetic, which is the most accurate in telling the chemisorption process, showed a slight increase in the rate constant K 2, which rose from 9.4 × 10⁻⁵ to 1.208 × 10⁻⁴ (g mg−1 min−1) × 10−2. Additionally, the theoretical adsorption capacity (q e) notably increased from 523.4 to 766.2 mg/g. This theoretical capacity is in close agreement with the experimental data (q e exp = 521.64 mg/g for MV-MOF and 766.6 mg/g for the beads), providing validation for the model and underscoring the significant enhancement due to encapsulation. Furthermore, the pseudo-first-order rate constant K 1 also increased from 0.052 to 0.077 min−1, indicating an accelerated rate of initial dye uptake. The Elovich model, which is commonly used for heterogeneous surfaces, indicated elevated values of both β and α parameters for the composite beads (β: 1234.4 vs 119.32 g/mg, α: 43.96 vs 36.42 mg g−1 min−1), reinforcing the notion of improved surface reactivity and complexity following encapsulation. Additionally, the IPD model showed an increase in the diffusion constant K i and the boundary layer thickness X, highlighting enhanced diffusion dynamics within the bead matrix Figure 5(b). Collectively, these findings confirm that the creation of MV-MOF/CMC-CS beads not only expands the available surface area and functional groups for adsorption but also accelerates the uptake of dye molecules, establishing the composite as a more effective adsorbent compared to the unmodified MV-MOF Figure S2(b) [45].
The adsorption procedure is comprised of three main fundamentals, as demonstrated in Figure 5(c). At first, the dye sticks to the adsorbent’s surface. Equilibrium then causes the MV2B dye to go beside the wall to bigger pores that are located deeper inside the adsorbent. Third, the leftover herbicide molecules reside inside the adsorbent grain. This procedure is carried out repeatedly until the adsorbent is unable to absorb any more dyes. Temperature, pH, interaction time, and activation type all have a direct influence on the maximum adsorption, which varies depending on the material. The aforementioned stages of the adsorption process can also be described in terms of mass transfer since the phenomenon of adsorption is dependent on both the mass transport stages and the physicochemical characteristics of the adsorbent. Through the liquid boundary layer, the adsorbate molecule moves from the bulk solution to the adsorbent’s exterior [46]. This procedure causes the movement of substances across the layer of material next to the particle that absorbs them, as well as the movement of substances inside the particle’s surface, identified by the spread of the substance from outside into the pores of the substantial that absorbs it. Adsorption occurs once the adsorbate particle binds to the active places within the pores of the adsorbent. As shown in Figure 5(c), surface area is a significant influence in adsorption. Adsorption and surface area have a direct association. The area, pore volume, and pore width all affect how well MV2B dye molecules enter the pores. Functional groups and active binding sites found in synthetic materials efficiently draw and bind MV2B dye to the adsorbent’s surface. Adsorbent surfaces with enhanced surface capacity and cationic activation can attract MV2B dye particles. A method for analyzing IPD curves involves partitioning them into three segments, enabling the easy valuation of curve-appropriate degrees through χ 2 and R 2 values as shown in Figure 5(d).
Existing research clarifies the several absorption pathways that influence MV2B dye uptake. A quick initial phase followed by slower phases is demonstrated by the increasing K i values in each step, which provide insight into the sorption kinetics. Importantly, a linear curve that deviates from the origin indicates that the sorption rates for MV-MOF/CMC-CS imply that IPDE could not be the main factor limiting the adsorption rate [46].
Consequently, research was done to find out how temperature affected MV2B dye adsorption. Figure 6(a) shows the correlation between temperature and the removal of MV2B dye. The investigation used a 500 ppm dye solution and lasted for 100 min, by means of an optimal adsorbent quantity of 0.02 g. The variety of temperatures studied spanned from 20 to 45°C. The amount of MV2B dye removed dramatically increased with temperature, as indicated by Table S5, signifying that the adsorption procedure is endothermic. Furthermore, the viscosity of the MV2B dye solutions reduces with increasing temperature, making it easier for the dye molecules to move. The dye molecules will be able to migrate into the adsorbent’s interior more quickly thanks to their improved mobility. The thermodynamic parameters ΔH o, ΔG o, and ΔS o can be found by graphing ln K c vs 1/T, as seen in Figure 6(b). These thermodynamic properties indicate the desirability of the adsorption process [47]. Since a larger negative ΔG o improves the probability of spontaneous and energetically favorable adsorption, it may be concluded that higher temperatures enhance the adsorption procedure. By examining the equilibrium between the dye concentration on the exteriors of MV-MOF/CMC-CS and its attention in the solution, researchers can determine crucial adsorption characteristics including intensity and capability [48]. Even while the model of Arrhenius provides useful information, its empirical constituent may not completely capture the complexities of adsorption on MV-MOF/CMC-CS beads. Consequently, the goal of comprehensive study should be to integrate mechanical information from theory with empirical models (Figure 6(b)). The increased attraction of MV-MOF/CMC-CS, combined with the more noticeable movement of MV2B dye particles depending on temperature, is the main purpose of this phenomenon (Table S8). The positive ΔH o values for MV2B dye, which were measured at 94.14 kJ mol−1, demonstrate that the adsorption procedure is endothermic. After the adsorption procedure, it was observed that the ΔS o values were likewise positive, at 329.4 J mol−1 K−1, suggesting an increase in disorder or unpredictability. This leads to a dissociation happening taking place at the surface of MV2B dye through adsorption. The amount of activation energy involved can be used to define the kind of adsorption. A chemical adsorption process typically has an activation energy ranging from 4 to 40 kJ/mol. In this research, the activation energy was resolute to be 18.8 kJ/mol, representative of a chemical adsorption process. Furthermore, the potential for chemisorption adsorption is suggested by the enthalpy change (ΔH o) above 40 kJ/mol, as depicted in Figure 6(c).
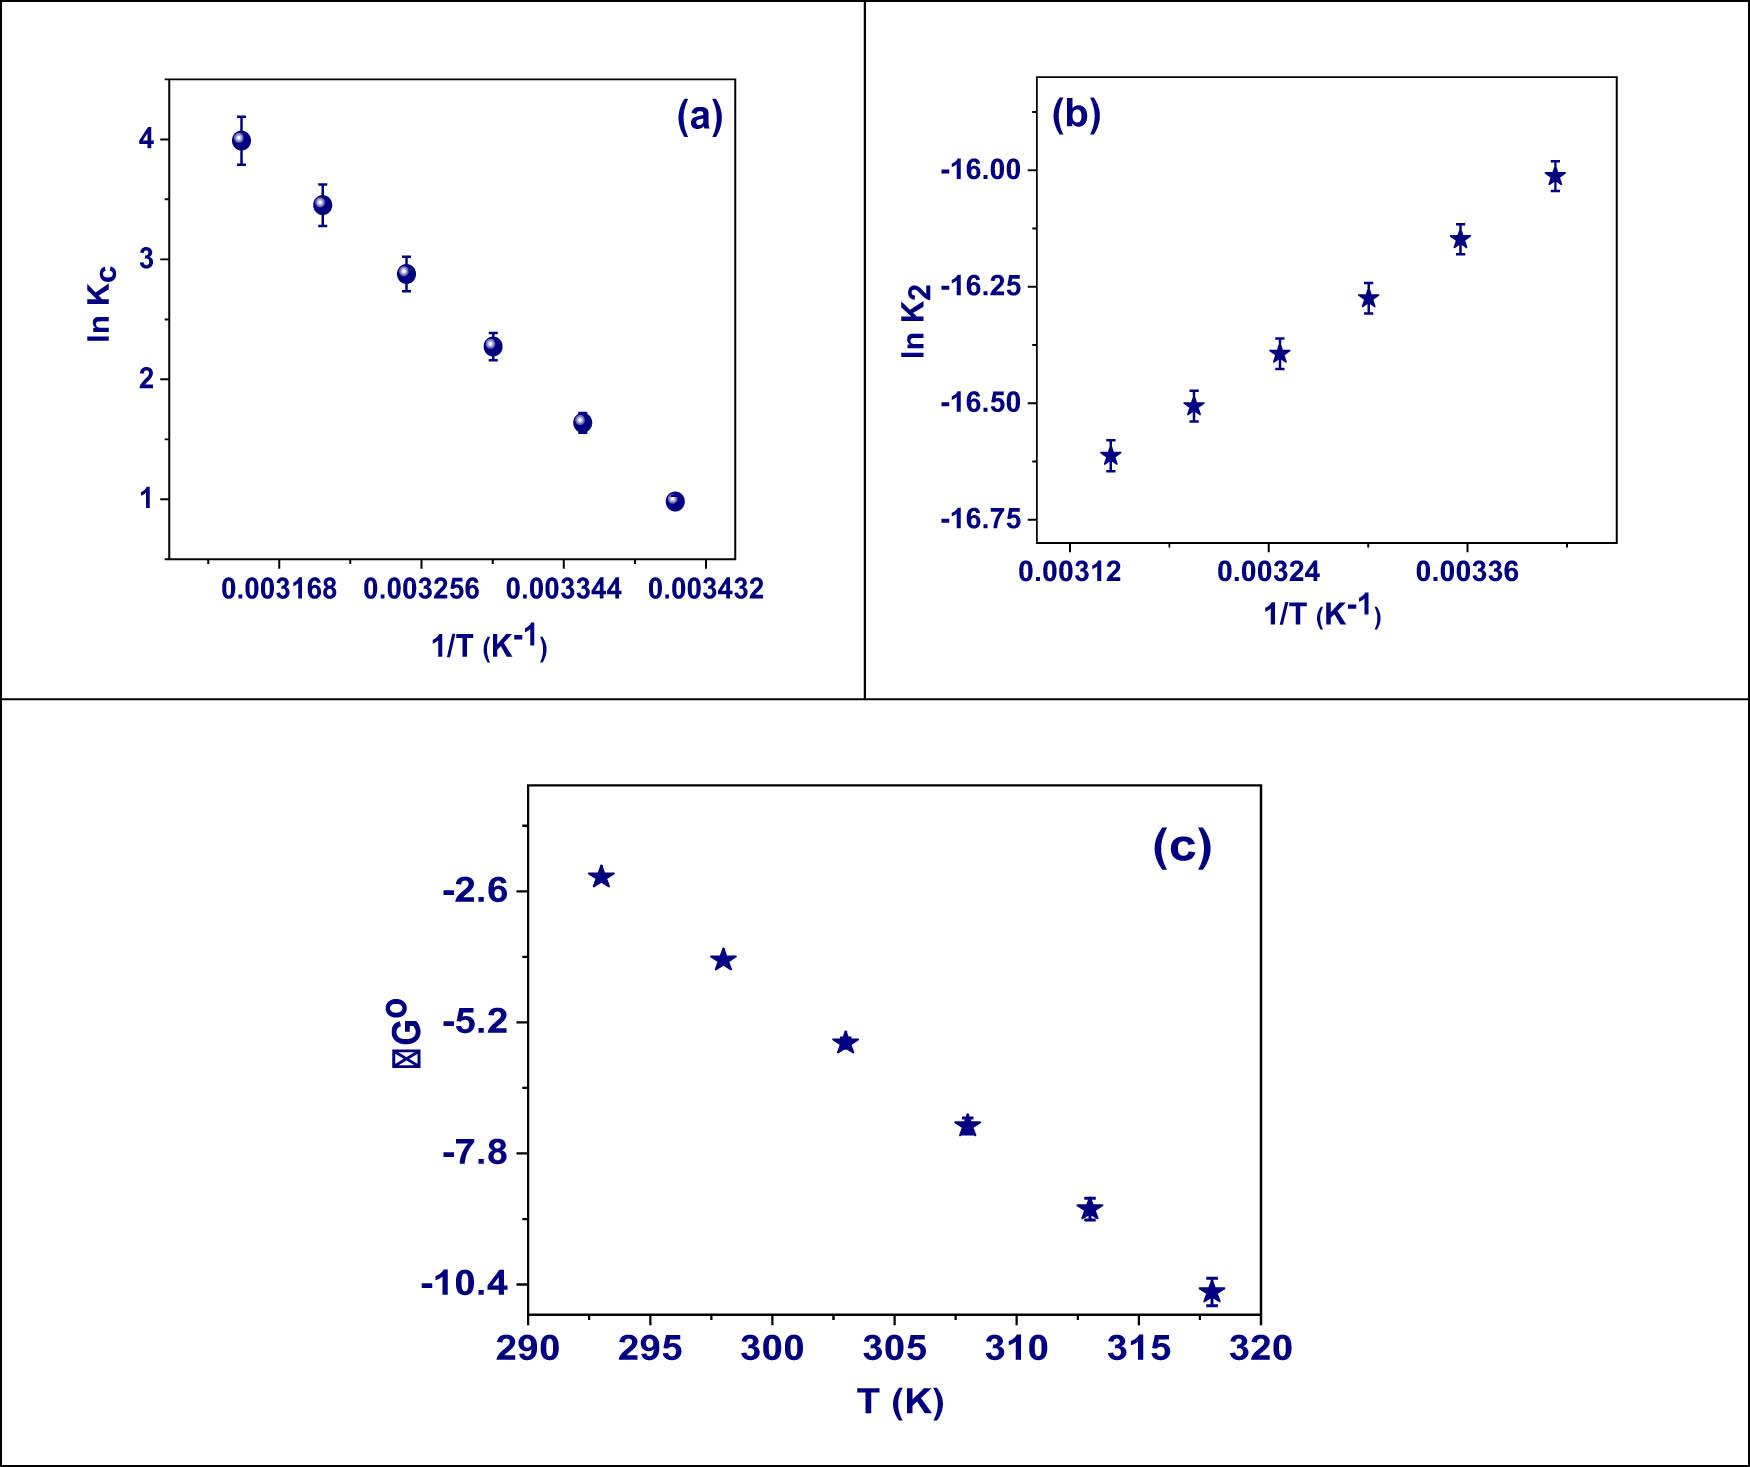
(a) The plot of van’t Hoff, (b) the models of Arrhenius, and (c) consequence of temperature on ΔG o.
Chemical or physical interacting processes are commonly used to characterize the adsorption interactions between the adsorbent and adsorbate. The basic adsorption mechanism that governs MV2B dye binding, hydrogen bonding, pore filling, electrostatic interaction, and π–π interaction, may result in MV2B dye adhering to sorbents, as shown in Figure 7. During the process of electrostatic interaction, cationic dyes interact with positively charged absorbents at pH levels above the pHzpc. Electrostatic forces, π–π interaction, hydrogen bonding, and amidation reactions are some of the processes that this study found regulate MV2B dye’s adsorption on MV-MOF/CMC-CS [49]. The primary method for removing is through π–π interaction in adsorption. When the dye and sorbent exchange ions, ion exchange is the most accurate description of the mechanism [50]. This is owing to the attendance of permanently charged species in the adsorbent [31]. The process of ionic exchange is frequently observed in MV-MOF/CMC-CS for the sorption of MV2B dye primarily owing to the characteristics of the interlayer sorbents [32]. Additionally, other supplementary adsorption devices like electrostatic interaction, hydrogen bonding, π–π interaction, and hydrogen bond may also play a character in the uptake of MV2B dye by MV-MOF/CMC-CS for its removal. The useful groups on the surface (such as amine and carbonyl) of MV2B dye have the ability to bind with the charged superficial of the sorbents either through a cationic device or by forming a bond with the hydrogen atom attached to the –OH group of water that is connected to the cations on the adsorbent superficial.
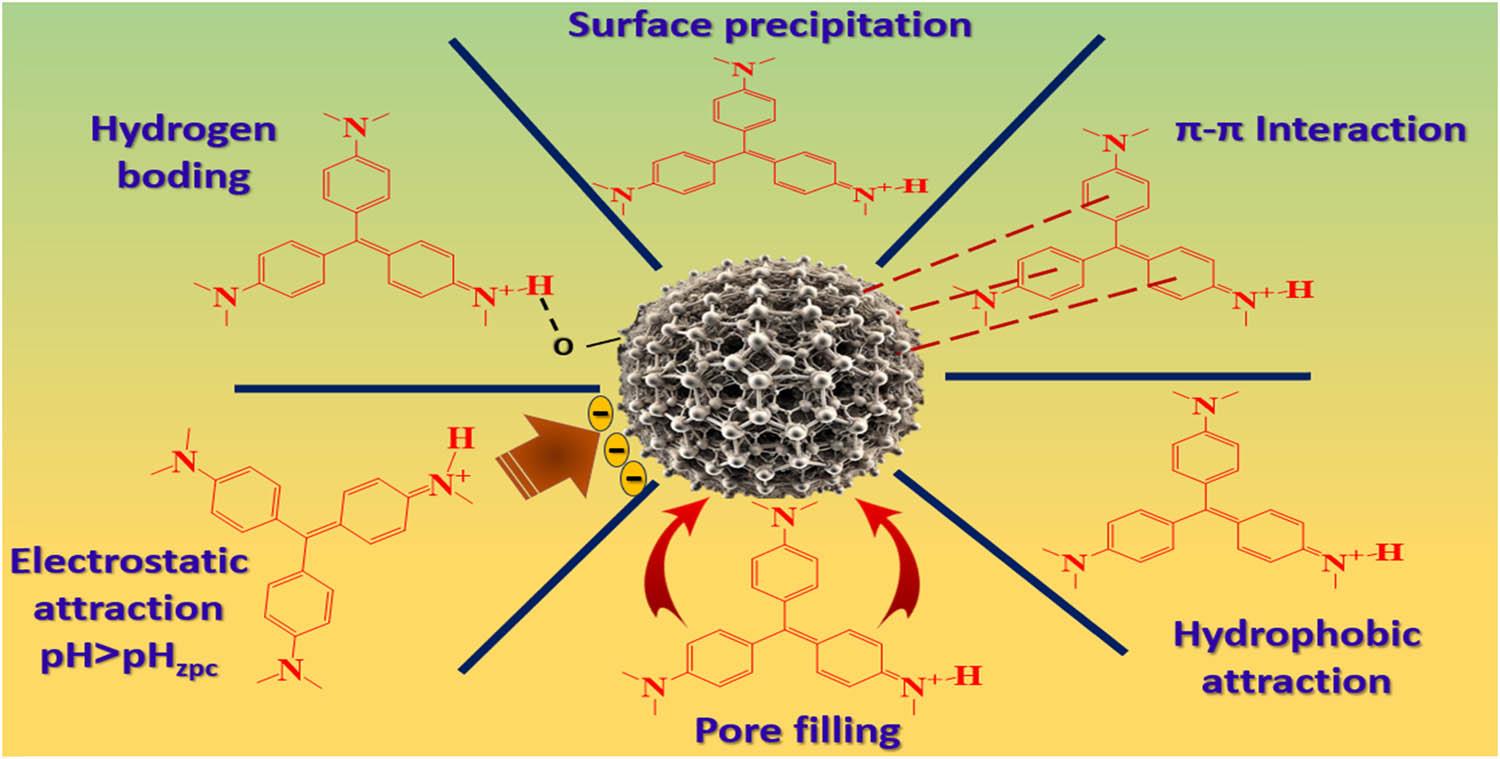
Mechanism of MV2B dye and MV-MOF/CMC-CS interaction.
In most adsorption studies, traditional methods involve using purified deionized water, which does not reflect real-world conditions. Surface water, groundwater, and wastewater samples from homes and businesses were thus gathered from the neighborhood and subjected to preset MV2B dye concentrations. These samples were then treated with MV-MOF/CMC-CS beads to remove the dye. The adsorption conditions were maintained at their most effective levels (specifically, solution pH: 8.0, MV-MOF/CMC-CS dosage: 0.8 g/L, stirring time: 100 min), while the original concentration of MV2B dye was adjusted from 10 to 100 mg/L. The results obtained were graphed and are displayed in Figure 8. The ratio of MV2B dye elimination in deionized water, industrial wastewater, domestic water, groundwater, and surface water was found to be 93.2 (±1.864), 71 (±1.42), 74 (±1.48), 78 (±1.56), and 77.4 (±1.548) %, individually, at an initial MV2B dye concentration of 50 mg/L. A decrease in the number of accessible locations for MV2B dye uptake can result from the presence of various mineral types and ions in the groundwater contributing to the adsorption mechanism of MV2B dye. Contaminants present in surface water, due to its constant exposure to the atmosphere, have the potential to hinder the successful elimination of contaminants from the water using suitable adsorbents, should they be present in significant quantities [39].
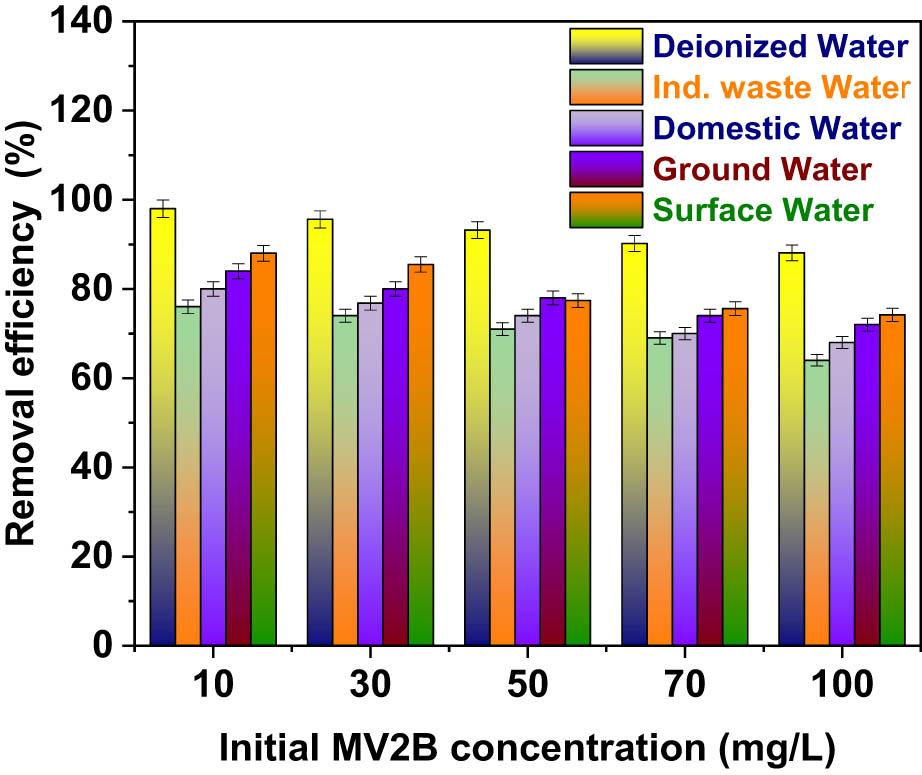
Removal of MV2B dye from authentic water samples.
The influence of salinity on the adsorption performance of MV2B dye onto MV-MOF/CMC-CS was examined by adding common anions Cl−, SO4 2−, NO3 −, and HCO3 − at a concentration of 50 mg/L, while keeping the MV2B dye concentration constant at 200 mg/L. The data presented in Figure 9 show that these ions affected the removal efficiency to different extents. When no salts were present, the adsorption efficiency achieved a high level of 92.4%. Chloride ions (Cl−) exhibited only a minor inhibitory effect, reducing efficiency slightly to 92.4%. In contrast, nitrate (NO3 −) and sulfate (SO4 2−) ions caused moderate disruptions, resulting in removal efficiencies of 84.2 and 82.4%, respectively [18]. The most significant reduction in adsorption efficiency occurred with bicarbonate ions (HCO3 −), where the efficiency fell dramatically to 68.8%. This notable decline is likely attributed to the ability of bicarbonate to raise pH levels, which may lead to the deprotonation of the MV-MOF/CMC-CS adsorbent surface. The anionic dye molecules and the negatively charged adsorbent surface may be more electrostatically repelled as a result of this alteration. Overall, these findings highlight that the attendance of competing anions in the solution can impede the adsorption of MV2B dye by either occupying the active binding sites or altering the surface charge properties, with bicarbonate having the most significant effect [22].
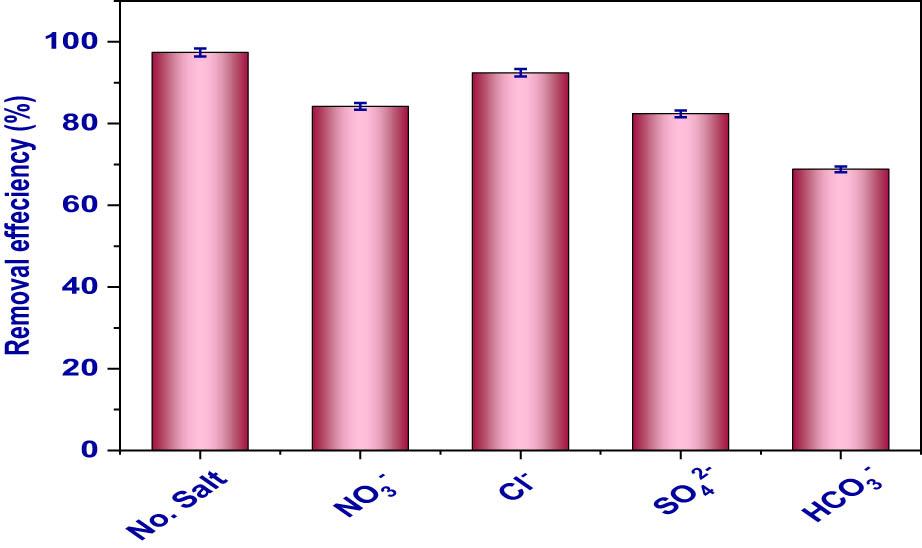
The influence of interfering ions on the adsorption of MV2B dye onto MV-MOF/CMC-CS.
The ability to reuse the adsorbent is crucial in the endeavor to develop a sustainable and eco-friendly adsorption technique for eliminating contaminants. Continuous adsorption and desorption tests were performed to assess the reusability of the MV-MOF/CMC-CS. The composite used for the subsequent adsorption test was made by mixing a 100 mg/L concentration of adsorbate with a 0.1 M NaOH solution. The removal efficiency after each regeneration cycle is shown in Figure 10, and the amount of MV2B dye removed after each adsorption cycle was calculated using the removal percentage. The efficiency of the MV-MOF/CMC-CS hydrogel bead adsorbents in eliminating contaminants steadily declined following each regeneration cycle. The efficiency of removing MV2B dye from MV-MOF/CMC-CS hydrogel beads declined from 97.4% to 81.2% after the eighth consecutive adsorption cycle. The loss of surface chemistry groups following each adsorption cycle may be the source of the decline in adsorption efficacy since it reduces electron transfer and π–π interactions that facilitate adsorption [51].
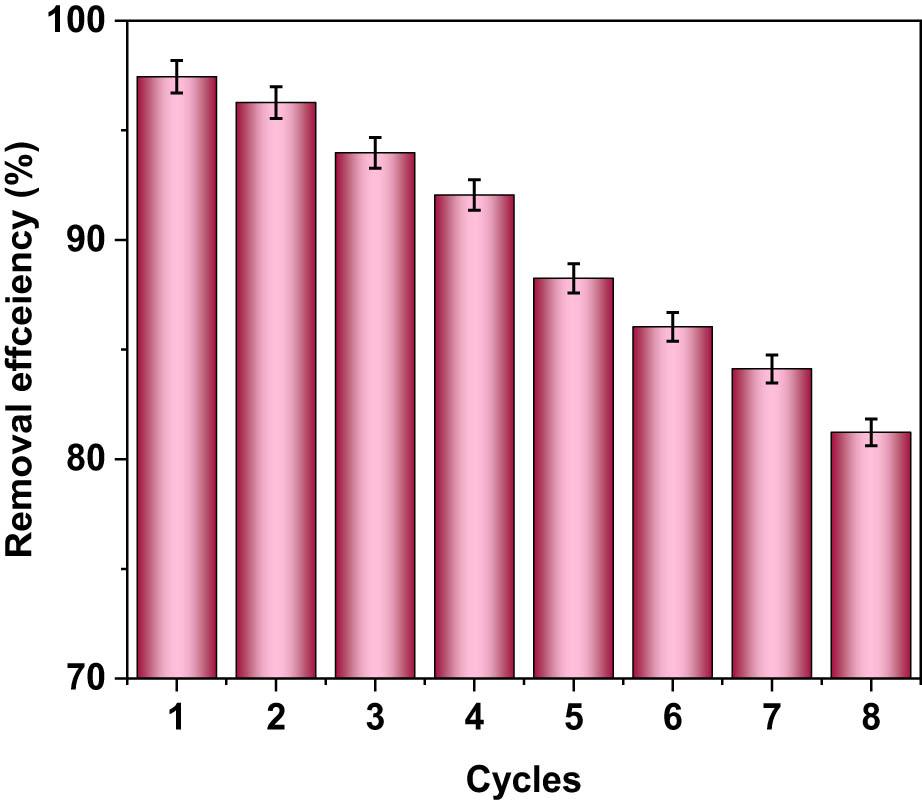
Efficiency of MV-CS-CMC/MOF regeneration.
The adsorbent’s capability to interact with various materials for MV2B dye removal, as outlined in the works, is detailed in Table S9. The variations in maximum adsorption capabilities amongst the listed resources are apparent. The generated adsorbent was deemed acceptable and average, as it reached a maximum adsorption capability (experimental capability; q max = 764.2 mg g−1) associated with the additional materials.
The ANOVA analysis conducted on the adsorption characteristics of MV2B onto MV-MOF/CMC-CS hydrogel beads reveals that the planned quadratic model holds numerical significance. This is evidenced by a notably high F-statistic of 57.42 and an accompanying p-value of fewer than 0.0001, suggesting that the terms within the model exert a considerable influence on the adsorption dynamics. Furthermore, the coefficient of determination (R 2) is calculated at 0.9866, indicating that 98.66% of the variance observed in adsorption capacity is accounted for by the model. In addition, the adjusted R 2 value of 0.9695, along with the predicted R 2 of 0.7862, reinforces the model’s validity and its ability to accurately predict outcomes related to the adsorption process [52]. The precision metric recorded at 23.68 significantly surpasses the established acceptable limit of 4, indicating a robust signal and affirming the model’s effectiveness in exploring the experimental domain. When evaluating the individual factors, contact time (B) emerged as the most dominant variable, evidenced by a remarkably high F-value of 319.40 (p < 0.0001). It was followed by adsorbent dose (C), which presented an F-value of 25.57 (p = 0.0015), and initial pH (A) with an F-value of 6.29 (p = 0.0405). These findings collectively underscore the substantial impact of these three variables on the adsorption performance. The analysis revealed that the interaction term BC (time × dose) demonstrated statistical significance (F = 11.19, p = 0.0123), indicating a synergistic effect. In contrast, the interaction terms AB and AC did not reach significance. Notably, the quadratic terms A 2 and B 2 displayed high significance (p = 0.0018 and < 0.0001, respectively), which substantiates the presence of curvature in the response surface concerning pH and time; however, C 2 was not significant (p = 0.4060). The insignificant lack of fit value relative to pure error further corroborates the model’s adequacy. In summary, this ANOVA assessment affirms the reliability and accuracy of the response surface model employed to optimize MV2B dye adsorption on MV-MOF/CMC-CS, emphasizing the critical roles of pH, time, and adsorbent dose as influential parameters Table 1.
Examination of the variance for the models being fitted.
| Source | Sum of squares | df | Mean square | F-value | p-value | Standard error | 95% CI low | 95% CI high | |
|---|---|---|---|---|---|---|---|---|---|
| Intercept | 558.46 | 18.77 | 514.07 | 602.86 | |||||
| Model | 9.108 × 10+05 | 9 | 1.012 × 10+05 | 57.42 | <0.0001 | Significant | |||
| A-pH | 11084.74 | 1 | 11084.74 | 6.29 | 0.0405 | 14.84 | 2.13 | 72.32 | |
| B-time | 5.629 × 10⁵ | 1 | 5.629 × 1005 | 319.40 | <0.0001 | 14.84 | 230.17 | 300.36 | |
| C-Dose | 45068.61 | 1 | 45068.61 | 25.57 | 0.0015 | 14.84 | −110.15 | −39.96 | |
| AB | 4127.46 | 1 | 4127.46 | 2.34 | 0.1698 | 20.99 | −17.51 | 81.76 | |
| AC | 2054.76 | 1 | 2054.76 | 1.17 | 0.3161 | 20.99 | −72.30 | 26.97 | |
| BC | 19729.55 | 1 | 19729.55 | 11.19 | 0.0123 | 20.99 | −119.87 | −20.60 | |
| A 2 | 41923.08 | 1 | 41923.08 | 23.79 | 0.0018 | 20.46 | −148.16 | −51.40 | |
| B 2 | 2.078 × 10+05 | 1 | 2.078 × 10⁵ | 117.92 | <0.0001 | 20.46 | −270.55 | −173.79 | |
| C 2 | 1377.33 | 1 | 1377.33 | 0.7815 | 0.4060 | 20.46 | −66.47 | 30.29 | |
| Residual | 12337.38 | 7 | 1762.48 | ||||||
| Lack of fit | 12337.38 | 3 | 4112.46 | ||||||
| Pure error | 0.0000 | 4 | 0.0000 | ||||||
| Cor total | 9.231 × 10⁵ | 16 | |||||||
| Std. Dev. | 41.98 | ||||||||
| Mean | 398.44 | ||||||||
| C.V. % | 10.54 | ||||||||
| R 2 | 0.9866 | ||||||||
| Adjusted R 2 | 0.9695 | ||||||||
| Predicted R 2 | 0.7862 | ||||||||
| Adeq precision | 23.6848 |
The BBD model’s statistical significance about MV2B dye using MV-MOF/CMC-CS hydrogel beads was assessed through the F-value test and p-value (Table 1). Variables showing independent or synergistic connections by the lowest p-value and highest F-value are deemed to have the most important and significant possessions.
Table 2 provides the outcomes of an experimental design employing a central composite design (CCD) to assess the effectiveness of MV2B dye adsorption onto MV-MOF/CMC-CS hydrogel beads. This evaluation focuses on three essential factors: solution pH, contact time, and the dose of the adsorbent [35]. The table shows a comparison of the residuals and both internally and externally studentized residuals, together with the experimental and anticipated adsorption capabilities (measured in mg/g). These metrics serve to assess the presentation of the model and the consistency of the data. Throughout the 17 experimental trials, the observed adsorption capacity showed significant variation, ranging from a minimum of 8.84 mg/g (run 12, with pH 5, a contact time of 5 min, and an adsorbent quantity of 0.135 g) to a maximum of 726.20 mg/g (run 14, with pH 7, a contact time of 100 min, and the same 0.135 g dose). This outcome signifies a strong dependence of dye removal on the manipulated variables. A majority of the experimental runs specifically runs 2, 3, 5, and 6, exhibited complete alignment between experimental and predicted values, with zero residuals, which reinforces the model’s robustness. Nonetheless, some discrepancies were noted, such as in run 1, which had a positive residual of 40.69 mg/g, and run 9, which recorded a negative residual of –23.66 mg/g; however, these remained within acceptable limits. The externally studentized residuals across all trials were below the critical threshold of 3.0, with the highest values found in runs 1 and 12 (2.637 and 2.946, respectively), indicating the absence of significant outliers and affirming the statistical reliability of the model. In summary, the results substantiate the model’s capacity to accurately predict adsorption behavior under varied conditions, demonstrating that optimal dye removal was accomplished at neutral pH, prolonged contact time, and a moderate adsorbent dose, achieving a maximum adsorption capability of 726.20 mg/g [36].
Efficiency of MV2B dye adsorption via the reaction surface’s CCD.
| Run | Actual variables | Yield (mg/g) | ||||||
|---|---|---|---|---|---|---|---|---|
| pH | Time (min) | Dose (g) | Experimental | Predicted | Residue | Internally studentized residuals | Externally studentized residuals | |
| 1 | 7 | 100 | 0.25 | 478.88 | 438.18 | 40.69 | 1.939 | 2.637 |
| 2 | 7 | 52.5 | 0.135 | 558.46 | 558.46 | 0.0000 | 0.000 | 0.000 |
| 3 | 7 | 52.5 | 0.135 | 558.46 | 558.46 | 0.0000 | 0.000 | 0.000 |
| 4 | 7 | 5 | 0.25 | 10.67 | 48.11 | −37.44 | −1.784 | −2.236 |
| 5 | 7 | 52.5 | 0.135 | 558.46 | 558.46 | 0.0000 | 0.000 | 0.000 |
| 6 | 2 | 52.5 | 0.25 | 345.71 | 350.98 | −5.26 | −0.251 | −0.233 |
| 7 | 12 | 52.5 | 0.02 | 580.80 | 575.54 | 5.26 | 0.251 | 0.233 |
| 8 | 12 | 52.5 | 0.25 | 382.11 | 380.09 | 2.01 | 0.096 | 0.089 |
| 9 | 12 | 5 | 0.135 | 11.77 | −23.66 | 35.43 | 1.688 | 2.029 |
| 10 | 12 | 100 | 0.135 | 528.41 | 571.12 | −42.70 | −2.034 | −2.946 |
| 11 | 2 | 100 | 0.135 | 397.00 | 432.43 | −35.43 | −1.688 | −2.029 |
| 12 | 2 | 5 | 0.135 | 8.84 | −33.86 | 42.70 | 2.034 | 2.946 |
| 13 | 7 | 52.5 | 0.135 | 558.46 | 558.46 | 0.0000 | 0.000 | 0.000 |
| 14 | 7 | 100 | 0.02 | 766.20 | 728.76 | 37.44 | 1.784 | 2.236 |
| 15 | 2 | 52.5 | 0.02 | 453.75 | 455.76 | −2.01 | −0.096 | −0.089 |
| 16 | 7 | 5 | 0.02 | 17.07 | 57.76 | −40.69 | −1.939 | −2.637 |
| 17 | 7 | 52.5 | 0.135 | 558.46 | 558.46 | 0.0000 | 0.000 | 0.000 |
Table 3 provides a statistical comparison of various regression models Linear, 2FI (two-factor communication), Quadratic, and Cubic aimed at modeling the adsorption characteristics of MV2B dye on MV-MOF/CMC-CS hydrogel beads. Among the models assessed, the quadratic model emerged as the most effective, as evidenced by its highly significant sequential p-value (<0.0001), the lowest standard deviation of 41.98, and the minimal PRESS value of 1.974 × 10⁵, all of which substantiate its precision and predictive reliability. The quadratic model also attained the highest adjusted R 2 of 0.9695 and a robust predicted R 2 of 0.7862, indicating a strong association between the investigational and predicted results while effectively preventing overfitting. In comparison, the linear model exhibited moderate capability, with an adjusted R 2 of 0.5946 and a predicted R 2 of 0.4443. The 2FI model, however, fared poorly, displaying a very low predicted R 2 of 0.0081 despite having a higher standard deviation of 166.77 [53]. The cubic model was categorized as aliased, indicating it could not be thoroughly assessed due to insufficient experimental data points needed for such a complex analysis. Hence, taking into account all critical statistical metrics – significance level, model fit, and predictive ability – the quadratic model is definitively the most suitable option for accurately characterizing and optimizing the adsorption procedure of MV2B dye onto the MV-MOF/CMC-CS system.
Statistical examination of numerous adsorption models for MV2B dye on the MV-MOF/CMC-CS.
| Source | Sum of square | Std. Dev. | Sequential p-value | Press | Adj R 2 | Pred R 2 | Remark |
|---|---|---|---|---|---|---|---|
| Linear | 3.040 × 10⁵ | 152.93 | 0.0019 | 5.130 × 10⁵ | 0.5946 | 0.4443 | |
| 2F1 | 2.781 × 10⁵ | 166.77 | 0.8174 | 9.157 × 10⁵ | 0.5179 | 0.0081 | |
| Quadratic | 12337.38 | 41.98 | <0.0001 | 1.974 × 10⁵ | 0.9695 | 0.7862 | Suggested |
| Cubic | 0.0000 | 0.0000 | 1.0000 | Aliased |
Table 4 presents a sequential analysis of variance (ANOVA), which assesses the incremental contributions of various regression models – mean, linear, two-factor interaction (2FI), quadratic, and cubic to the overall variability in the adsorption of MV2B dye onto MV-MOF/CMC-CS hydrogel beads. The analysis starts with the mean model, compared to the total, which accounts for the highest sum of squares at 2.699 × 10⁶, signifying that the model explains the majority of the observed variation. When the linear model is introduced, it yields a sum of squares of 6.191 × 10⁵ along with a significant F-value of 8.82 and a p-value of 0.0019, indicating a substantial enhancement over the mean-only model. However, incorporating 2FI terms, which represent interactions between factors, results in a minor contribution (sum of squares = 25911.77), an F-value of 0.3106, and a high p-value of 0.8174, suggesting that this addition does not significantly improve model performance. The quadratic model demonstrates the most significant advancement, contributing a sum of squares of 2.658 × 10⁵, paired with a very high F-value of 50.27 and an extremely significant p-value of < 0.0001, confirming its status as the optimal fit for representing the adsorption process. In contrast, the subsequent cubic model shows negligible improvement (sum of squares = 12337.38) and is classified as aliased due to insufficient degrees of freedom, rendering it unreliable for interpretation or use. The residual sum of squares is reported as zero, indicating that the model captures almost all the variability in the dataset. In conclusion, this sequential modeling analysis establishes that the quadratic model presents the most statistically reliable and thorough explanation of dye adsorption behavior, while further complexity introduced by cubic terms is deemed unnecessary and unsupported by the data [41].
Modeling the sum of squares in a sequential fashion.
| Source | Sum of squares | df | Mean squares | F-value | P-value remark | |
|---|---|---|---|---|---|---|
| Mean value vs Total | 2.699 × 10⁶ | 1 | 2.699 × 10⁶ | |||
| Linear vs Mean value | 6.191 × 10⁵ | 3 | 2.064 × 10⁵ | 8.82 | 0.0019 | |
| 2FI vs Linear | 25911.77 | 3 | 8637.26 | 0.3106 | 0.8174 | |
| Quadratic vs 2FI | 2.658 × 10⁵ | 3 | 88594.70 | 50.27 | <0.0001 | Suggested |
| Cubic vs Quadratic | 12337.38 | 3 | 4112.46 | Aliased | ||
| Residual | 0.0000 | 4 | 0.0000 | |||
| Total | 3.622 × 10⁶ | 17 | 2.13 × 10⁵ |
The formula expressed in coded variables can be utilized to predict the consequence for specific levels of every variable. In this situation, the elevated levels of the variables are designated as +1, while the little levels are designated as −1 [54]. By looking at the coefficient factor as described in equation (5), the encoded formula helps as a useful tool for assessing the relative effect of the components.
The formula based on the real variables can be employed to predict the outcome for exact levels of each variable [46]. When defining the levels, each variable’s original units must be stated. Since the coefficients are changed to correspond with the units of each variable and the intercept is not at the center of the design space, it is not advised to use this method to evaluate the relative impact of each parameter (equation (6)).
Diagnostic charts, namely, the normal probability plot of studentized residuals and the plot comparing expected and actual values, can be used to verify the model’s applicability. The residuals will have a normal distribution since the data points in the normal probability residuals plot (Figure 11(a)) match a theoretical distribution. This attests to the validity of the experimental findings. The graphical representation of actual vs anticipated data can be seen in Figure 11(b), representative of a strong correspondence among the observed data and the model’s forecasts. These results serve to reinforce the dependability of the model [55].
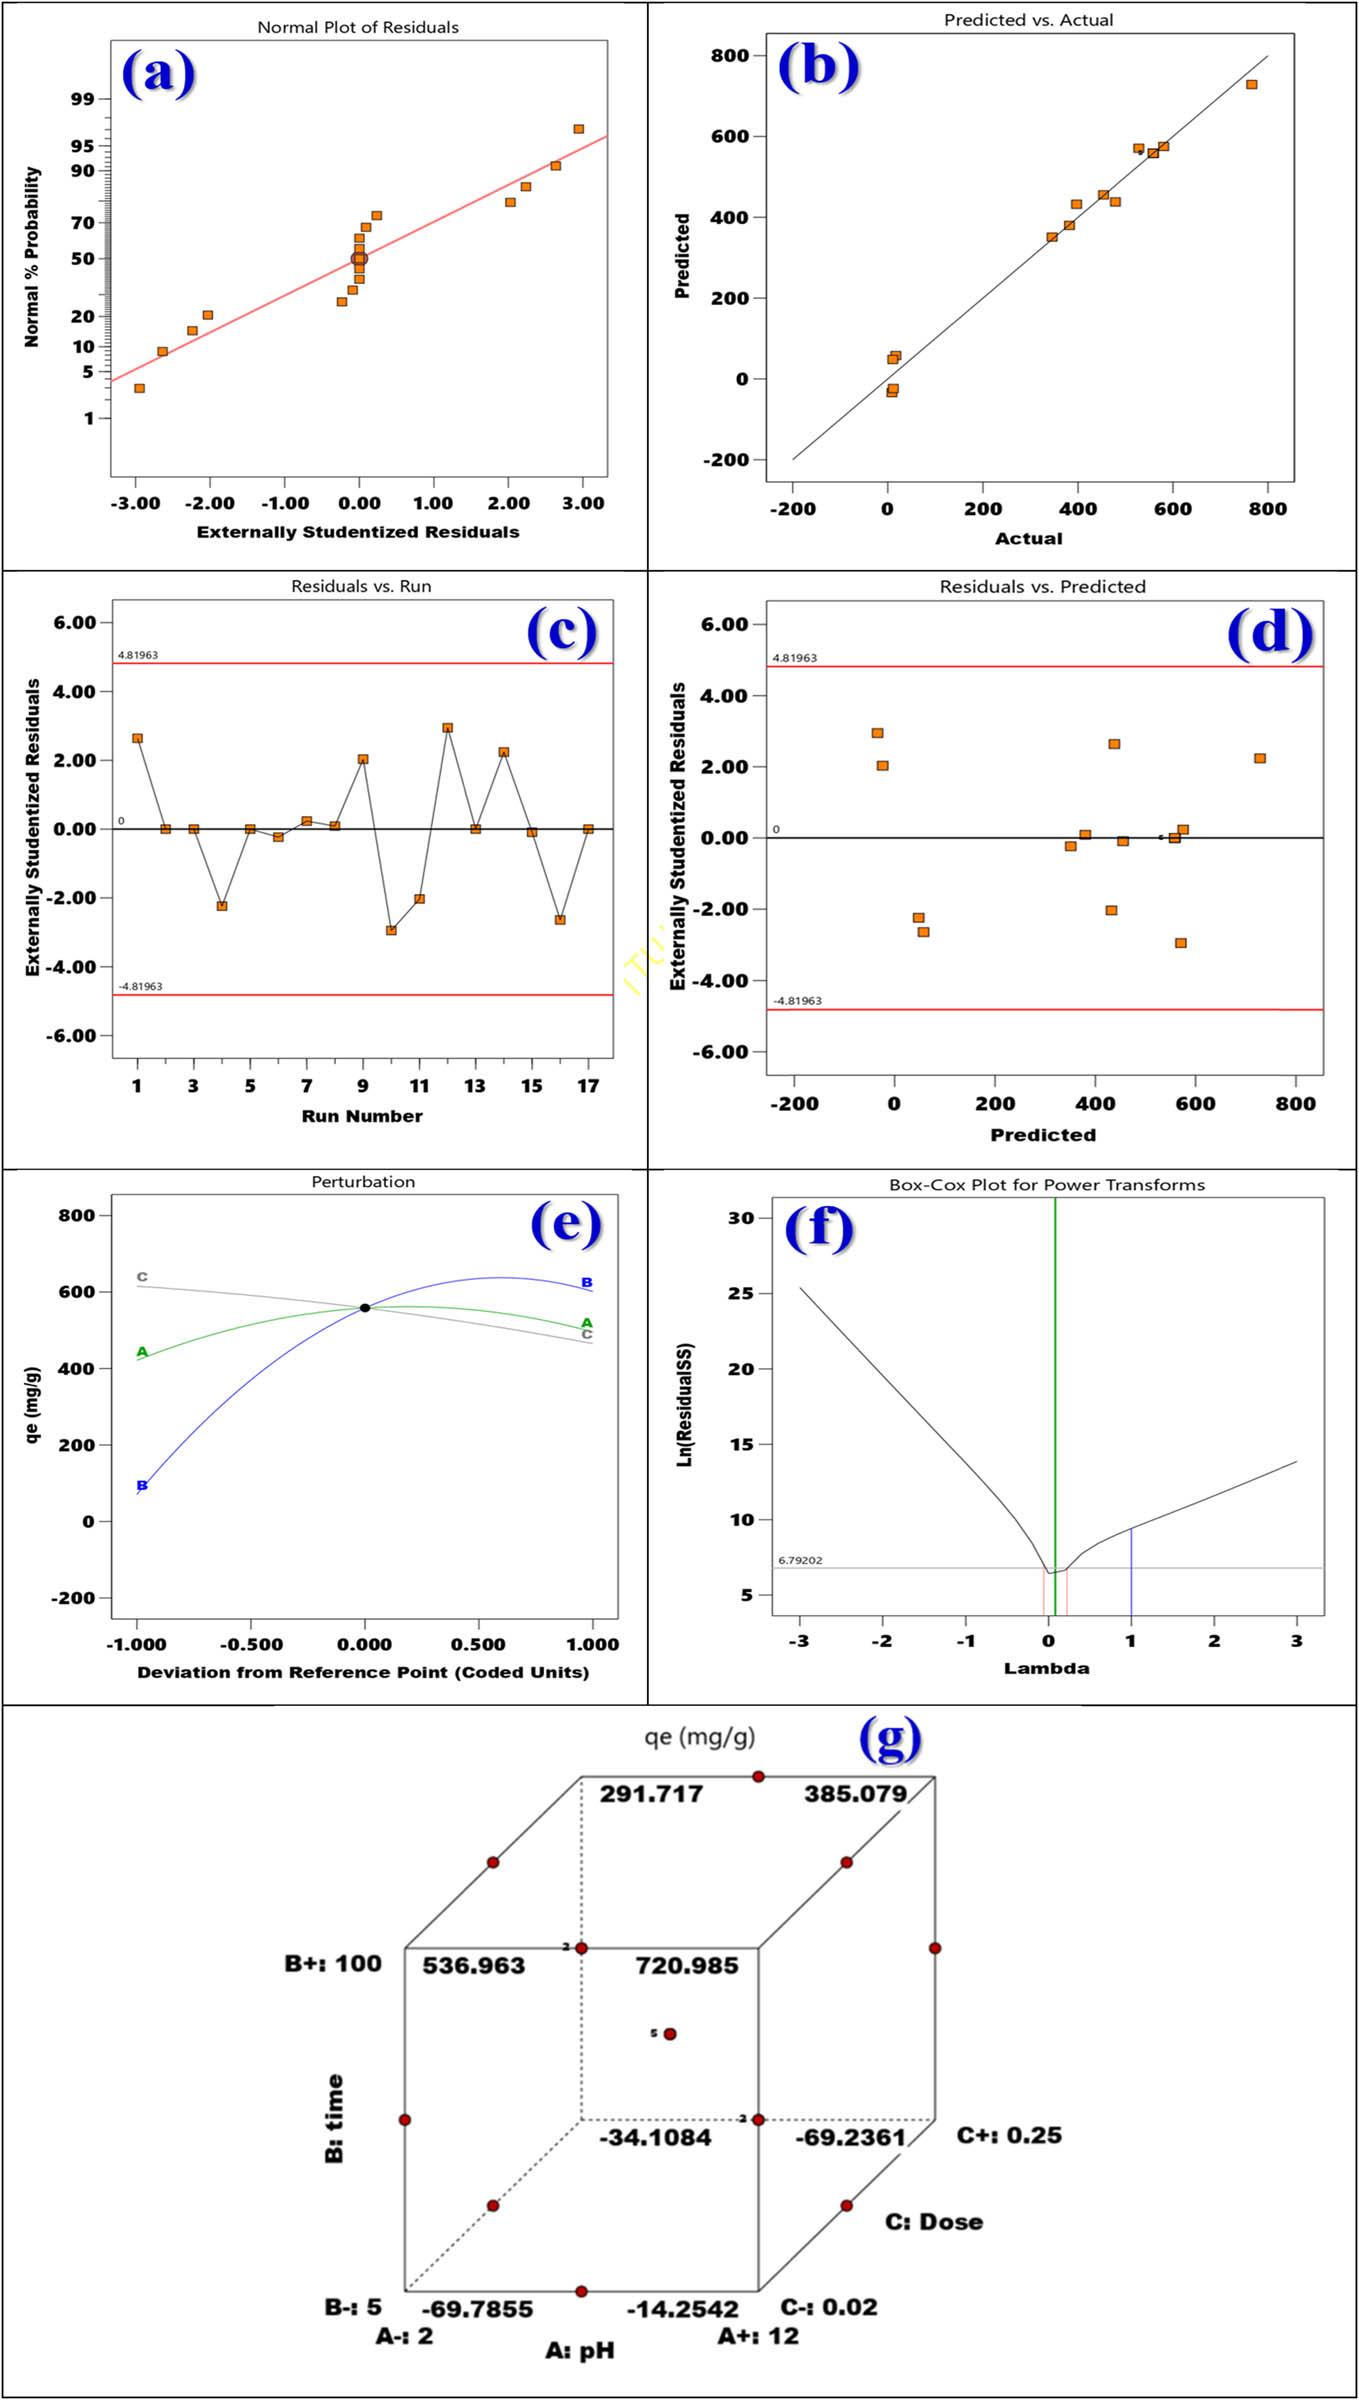
(a) Probability of the normal residual, (b) real values vs anticipated values, (c) residuals in contrast to run counts, (d) residuals vs predicted, (e) perturbation of adsorption MV2B dye onto MV-MOF/CMC-CS (for A: pH, B: Dose, and C: time), (f) BOX-Cox plot for power transforms, and (g) adsorption ability of MV2B dye on MV-MOF/CMC-CS is graphically optimized.
The residual plot provided displays externally studentized residuals plotted against the run number, which is a standard method used in regression analysis to assess the normal distribution of residuals and pinpoint any outliers. The Y-axis represents the range of residuals from −6.0 to 6.0, while the X-axis shows the run number, corresponding to the experimental or model iterations. The thresholds for identifying significant deviations are denoted by red horizontal lines at around 4.82 and −4.82, where data points beyond these lines may suggest potential outliers. The progression of residuals across runs is illustrated by the connection of orange squares to represent data points. In the framework of the RSM model for the adsorption of MV2B dye onto MV-MOF/CMC-CS, the deviations from the expected values are concentrated near zero, demonstrating a strong alignment between the model and the data. Additionally, there are no data points that surpass the predefined red threshold lines, pointing to the lack of any notable outliers according to the criteria shown in Figure 11(c).
The second residual plot depicts externally studentized residuals plotted against predicted values, a frequently used method for assessing model accuracy in regression analysis (Figure 11(d)). When applied to the RSM model for the adsorption of MV2B dye onto MV-MOF/CMC-CS, the residuals tend to cluster near zero, indicating a reasonably strong fit. Some isolated pieces of data suggest small discrepancies in a few projections, yet these discrepancies fall within the designated limits, showing that there are no extremely significant anomalies and indicating that the model’s underlying assumptions remain reasonably accurate with only slight deviations [13].
The disturbance graph depicts the influence of three influences (labeled as (A) pH, (B) time, and (C) dose) on the adsorption ability, denoted as q e in mg/g, in a RSM model for the adsorption of MV2B dye onto MV-MOF/CMC-CS. The central black dot serves as the point of reference, denoting the baseline state for all variables. This chart effectively illustrates that both variables A and B have a more important effect on the adsorption capacity than variable C, which exhibits minimal influence within the range examined (Figure 10(e)).
The Box-Cox plot supplied is utilized to regulate the most appropriate power transformation for a response variable in regression analysis, enhancing model assumptions such as normality and consistent variance. The horizontal axis indicates the power parameter values, denoted as Lambda, which span from −3 to 3, while the vertical axis displays (ln (Residual SS)), the natural logarithm of the residual sum of squares [20]. The graph shows how the residual sum of squares changes with different Lambda values. At Lambda = 0, indicated by the green vertical line, it is recommended or almost recommended to use a logarithmic transformation (as Lambda = 0 implies a natural log transformation) to improve normality or homoscedasticity in the model. The vertical lines in red and blue on the graph indicate the 95% confidence interval for Lambda, showing the probable range of the optimal transformation. A horizontal line at 6.79202 on the Y-axis marks the minimum (ln (Residual SS)) achieved through the transformation. The curve’s descent to a minimum point around Lambda = 0, combined with the narrow confidence interval, strongly indicates that a log transformation offers the best appropriate for the model by minimizing residual variation (Figure 11(f)).
The graphical image showing the combined belongings of the three variables pH (A), time (B), and dose (C) on the adsorption capacity (q e) (in mg/g) within a three-dimensional framework is known as a 3D interaction plot, or cubic plot. The axes of the plot correspond to pH (ranging from 2 to 12), time (ranging from 5 to 100), and dose (ranging from 0.02 to 0.25) [56]. The crimson markings at the edges of the cube pinpoint various permutations of these factors at their upper and lower thresholds, displaying designated (q e) measurements indicating the adsorption capacity. At elevated pH and dosage levels, the adsorption capability is 385.079 mg/g, whereas at prolonged duration and decreased dosage, it is 291.717 mg/g. The central point denoted as “s” signifies the midpoint of the design, indicating the average response at moderate levels of all three variables. The considerable range of (q e) values, which span from a high of 720.985 mg/g to a low of −69.7855 mg/g, suggests substantial interactions among the variables, underscoring the impact of various combinations on adsorption capacity. This plot offers a comprehensive understanding of the combined and individual impacts of pH, time, and dose on the adsorption onto the MV-MOF/CMC-CS, providing insight into their interactive influence as shown in Figure 11(g).
This visual representation displays the relationship between pH (A) and dose (B) with regards to the adsorption ability (q e) measured in mg/g. The horizontal axis represents pH levels reaching from 2 to 12, while the vertical axis depicts dose values spanning from 0.02 to 0.25. The q e values are indicated on the vertical axis, with a color gradient from blue (∼60 mg/g) to red (∼766.2 mg/g) representing low and high values, respectively [36]. The curved surface demonstrates a relationship that is not linear, indicating that the highest adsorption capacity is attained with moderate levels of both pH and dose, with q e reaching its peak near the center. Contour lines on the base plane display a 2D depiction of these changes, illustrating that extreme pH or dose values do not offer significant improvement. This underscores the significance of balanced conditions for achieving optimal performance, as revealed in Figure 12(a).
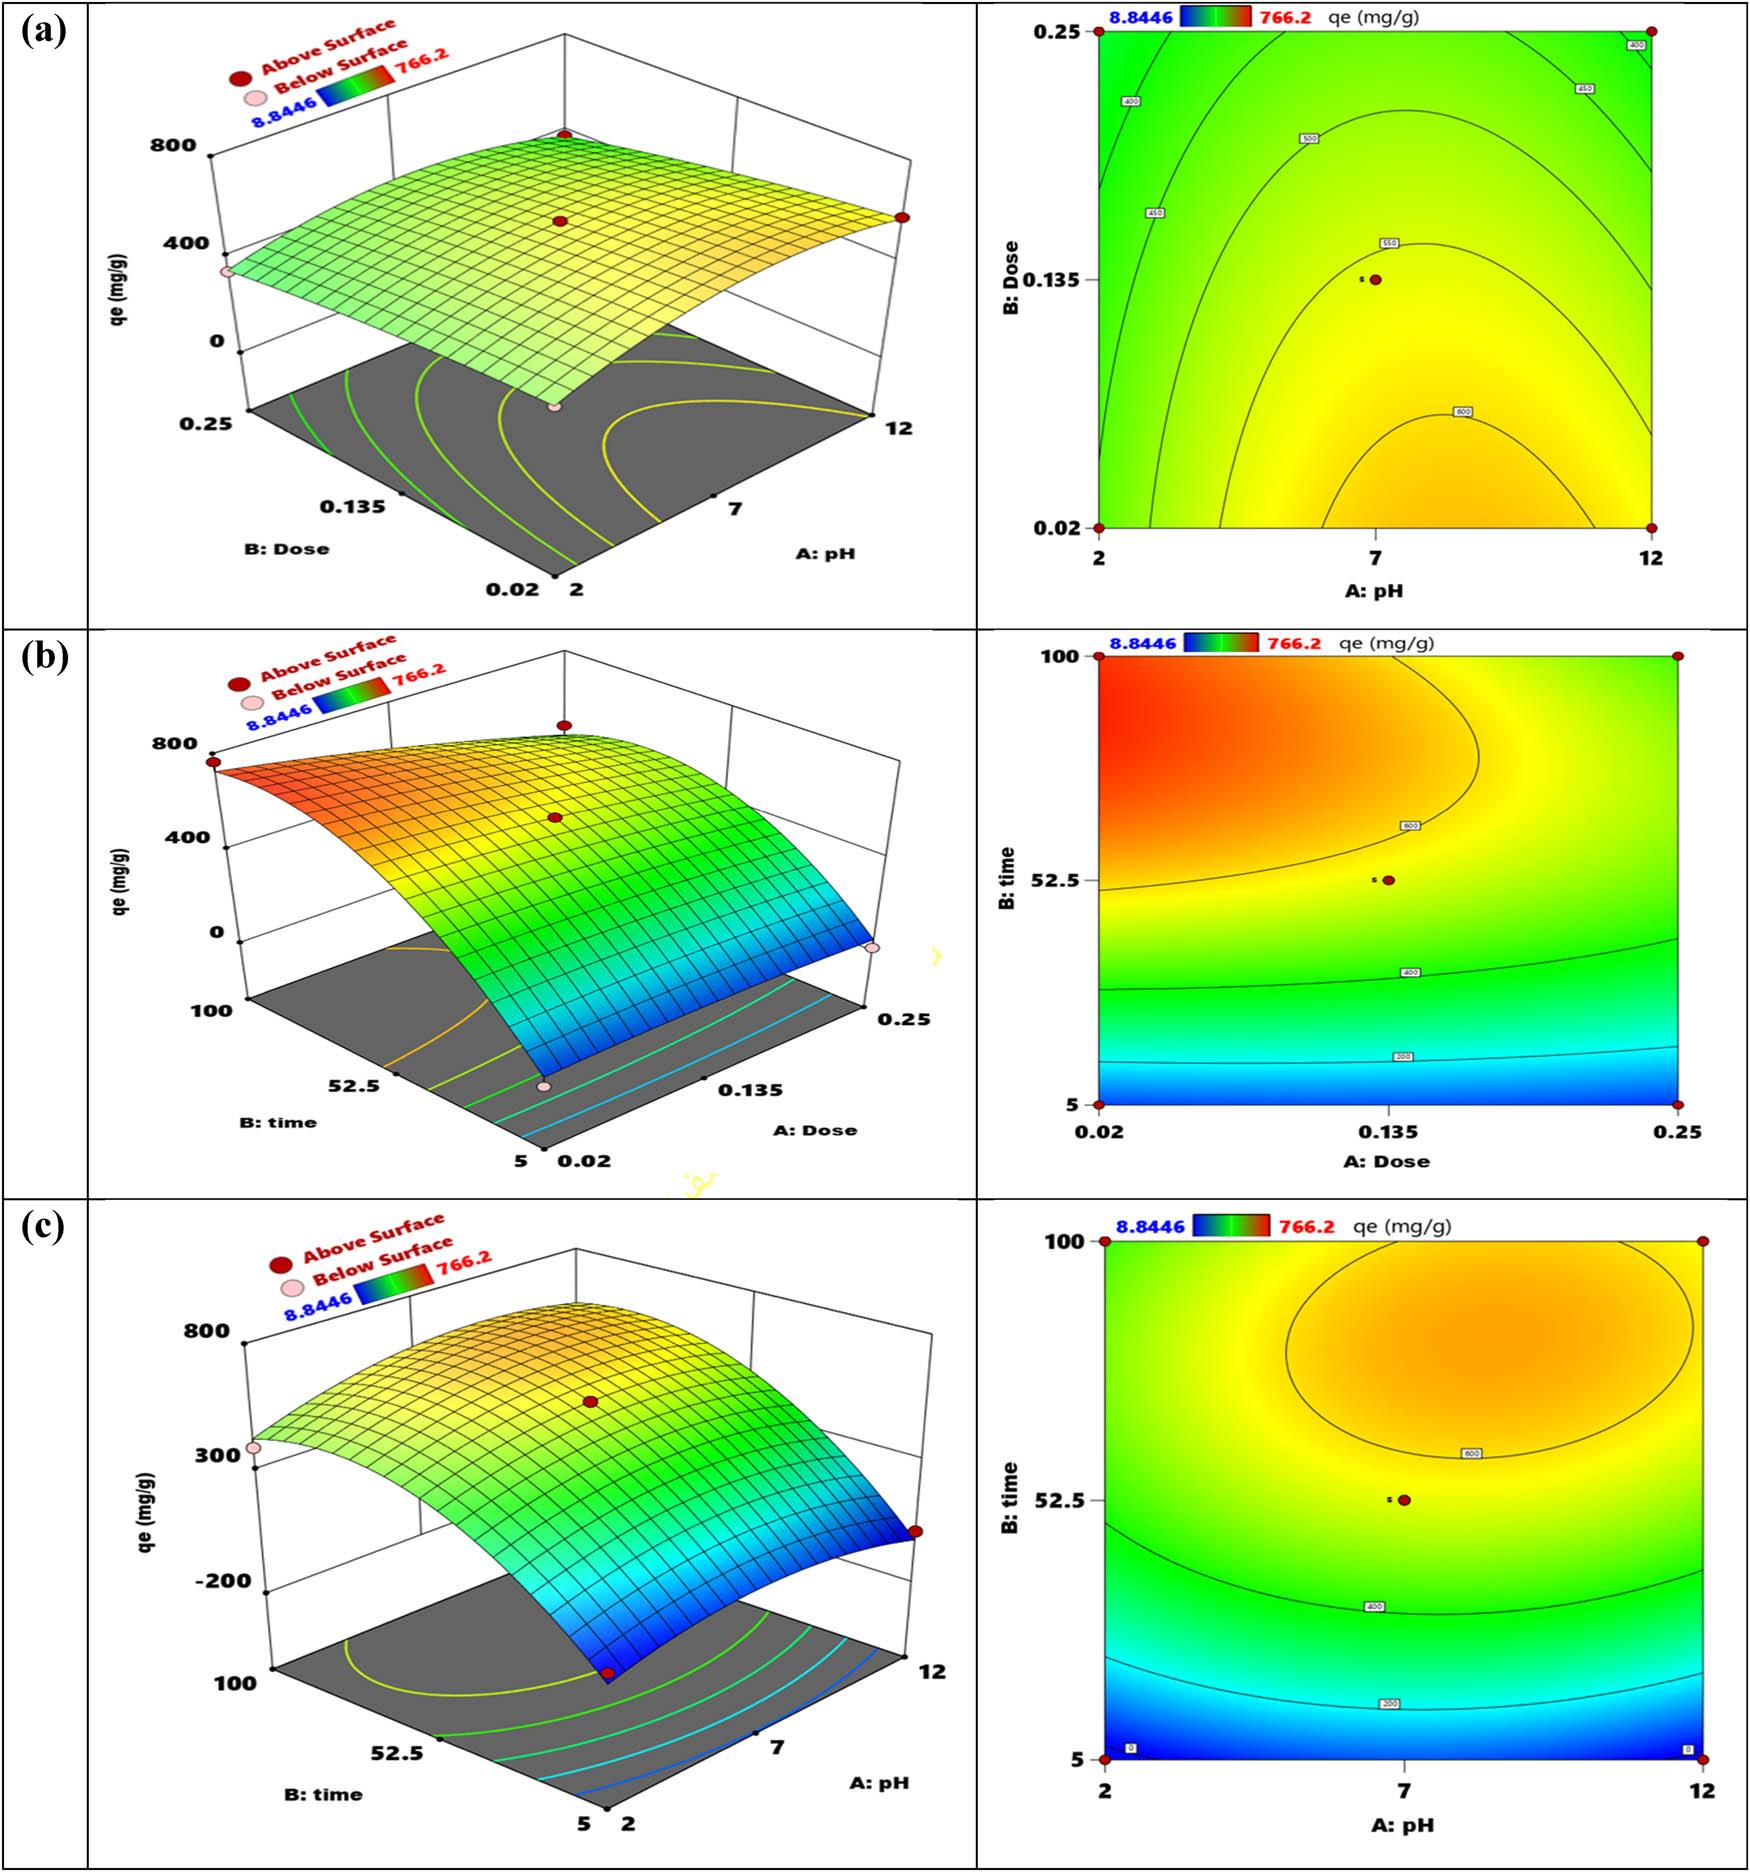
3D contour plots and surfaces that illustrate the impacts of (a) the adsorbent dose and initial pH, (b) the adsorbent dose and contact time, and (c) the contact time and initial pH.
This three-dimensional surface graph demonstrates the joint effect of time (B) and dose (A) on the adsorption capability (q e) measured in milligrams per gram. The horizontal axis displays dose values spanning from 0.02 to 0.25, the vertical axis represents time from 5 to 100, and the depth axis gauges q e, with values color-coded from blue (low, approximately 60 mg/g) to red (high, around 766.2 mg/g) [32]. The curved surface illustrates a relationship that is not linear, with the maximum adsorption (q e) being attained at a moderate dose and a longer duration (Figure 12(a)). As the duration increases, the adsorption capacity initially increases but eventually levels off, while solely increasing the dose has a lesser effect. The contour lines on the base plane offer a two-dimensional depiction, emphasizing that the most effective adsorption takes place at longer durations with balanced doses, while extreme values of either variable result in limited improvement (Figure 12(b)).
The 3D surface graph illustrates how the adsorption capability (q e) in mg/g is influenced by the combined impact of pH (A) and time (B). The pH values from 2 to 12 are shown on the x-axis, while the y-axis depicts the time ranging from 5 to 100 [32]. The z-axis displays q e, with color-coded values from blue (approximately 60 mg/g) to red (approximately 766.2 mg/g). The storyline uncovers an intricate connection in which the adsorption capacity is initially enhanced by increasing time, but eventually reaches a stable effect. Similarly, pH has a moderate impact, with the most effective adsorption happening at balanced levels of both variables. The contour lines on the base offer a two-dimensional perspective of the interaction, indicating that extreme values of pH or time do not result in significant improvement in q e (Figure 12(c)).
In Figure 13(a and b), a pH ranging from 2 to 12, a communication time between 5 and 100 min, and an amount reaching from 0.02 to 0.25 g of MV-MOF/CMC-CS were used. It was found that the ideal situations for the adsorption of MV2B on MV-MOF/CMC-CS were a pH of 8, an amount of 0.02 g of adsorbent, and a communication time of 100 min, as represented in Figure 13(c and d). The outcomes from the experimentation are in close arrangement with the expected outcomes, representative of the adequacy and appropriateness of the model used [19].
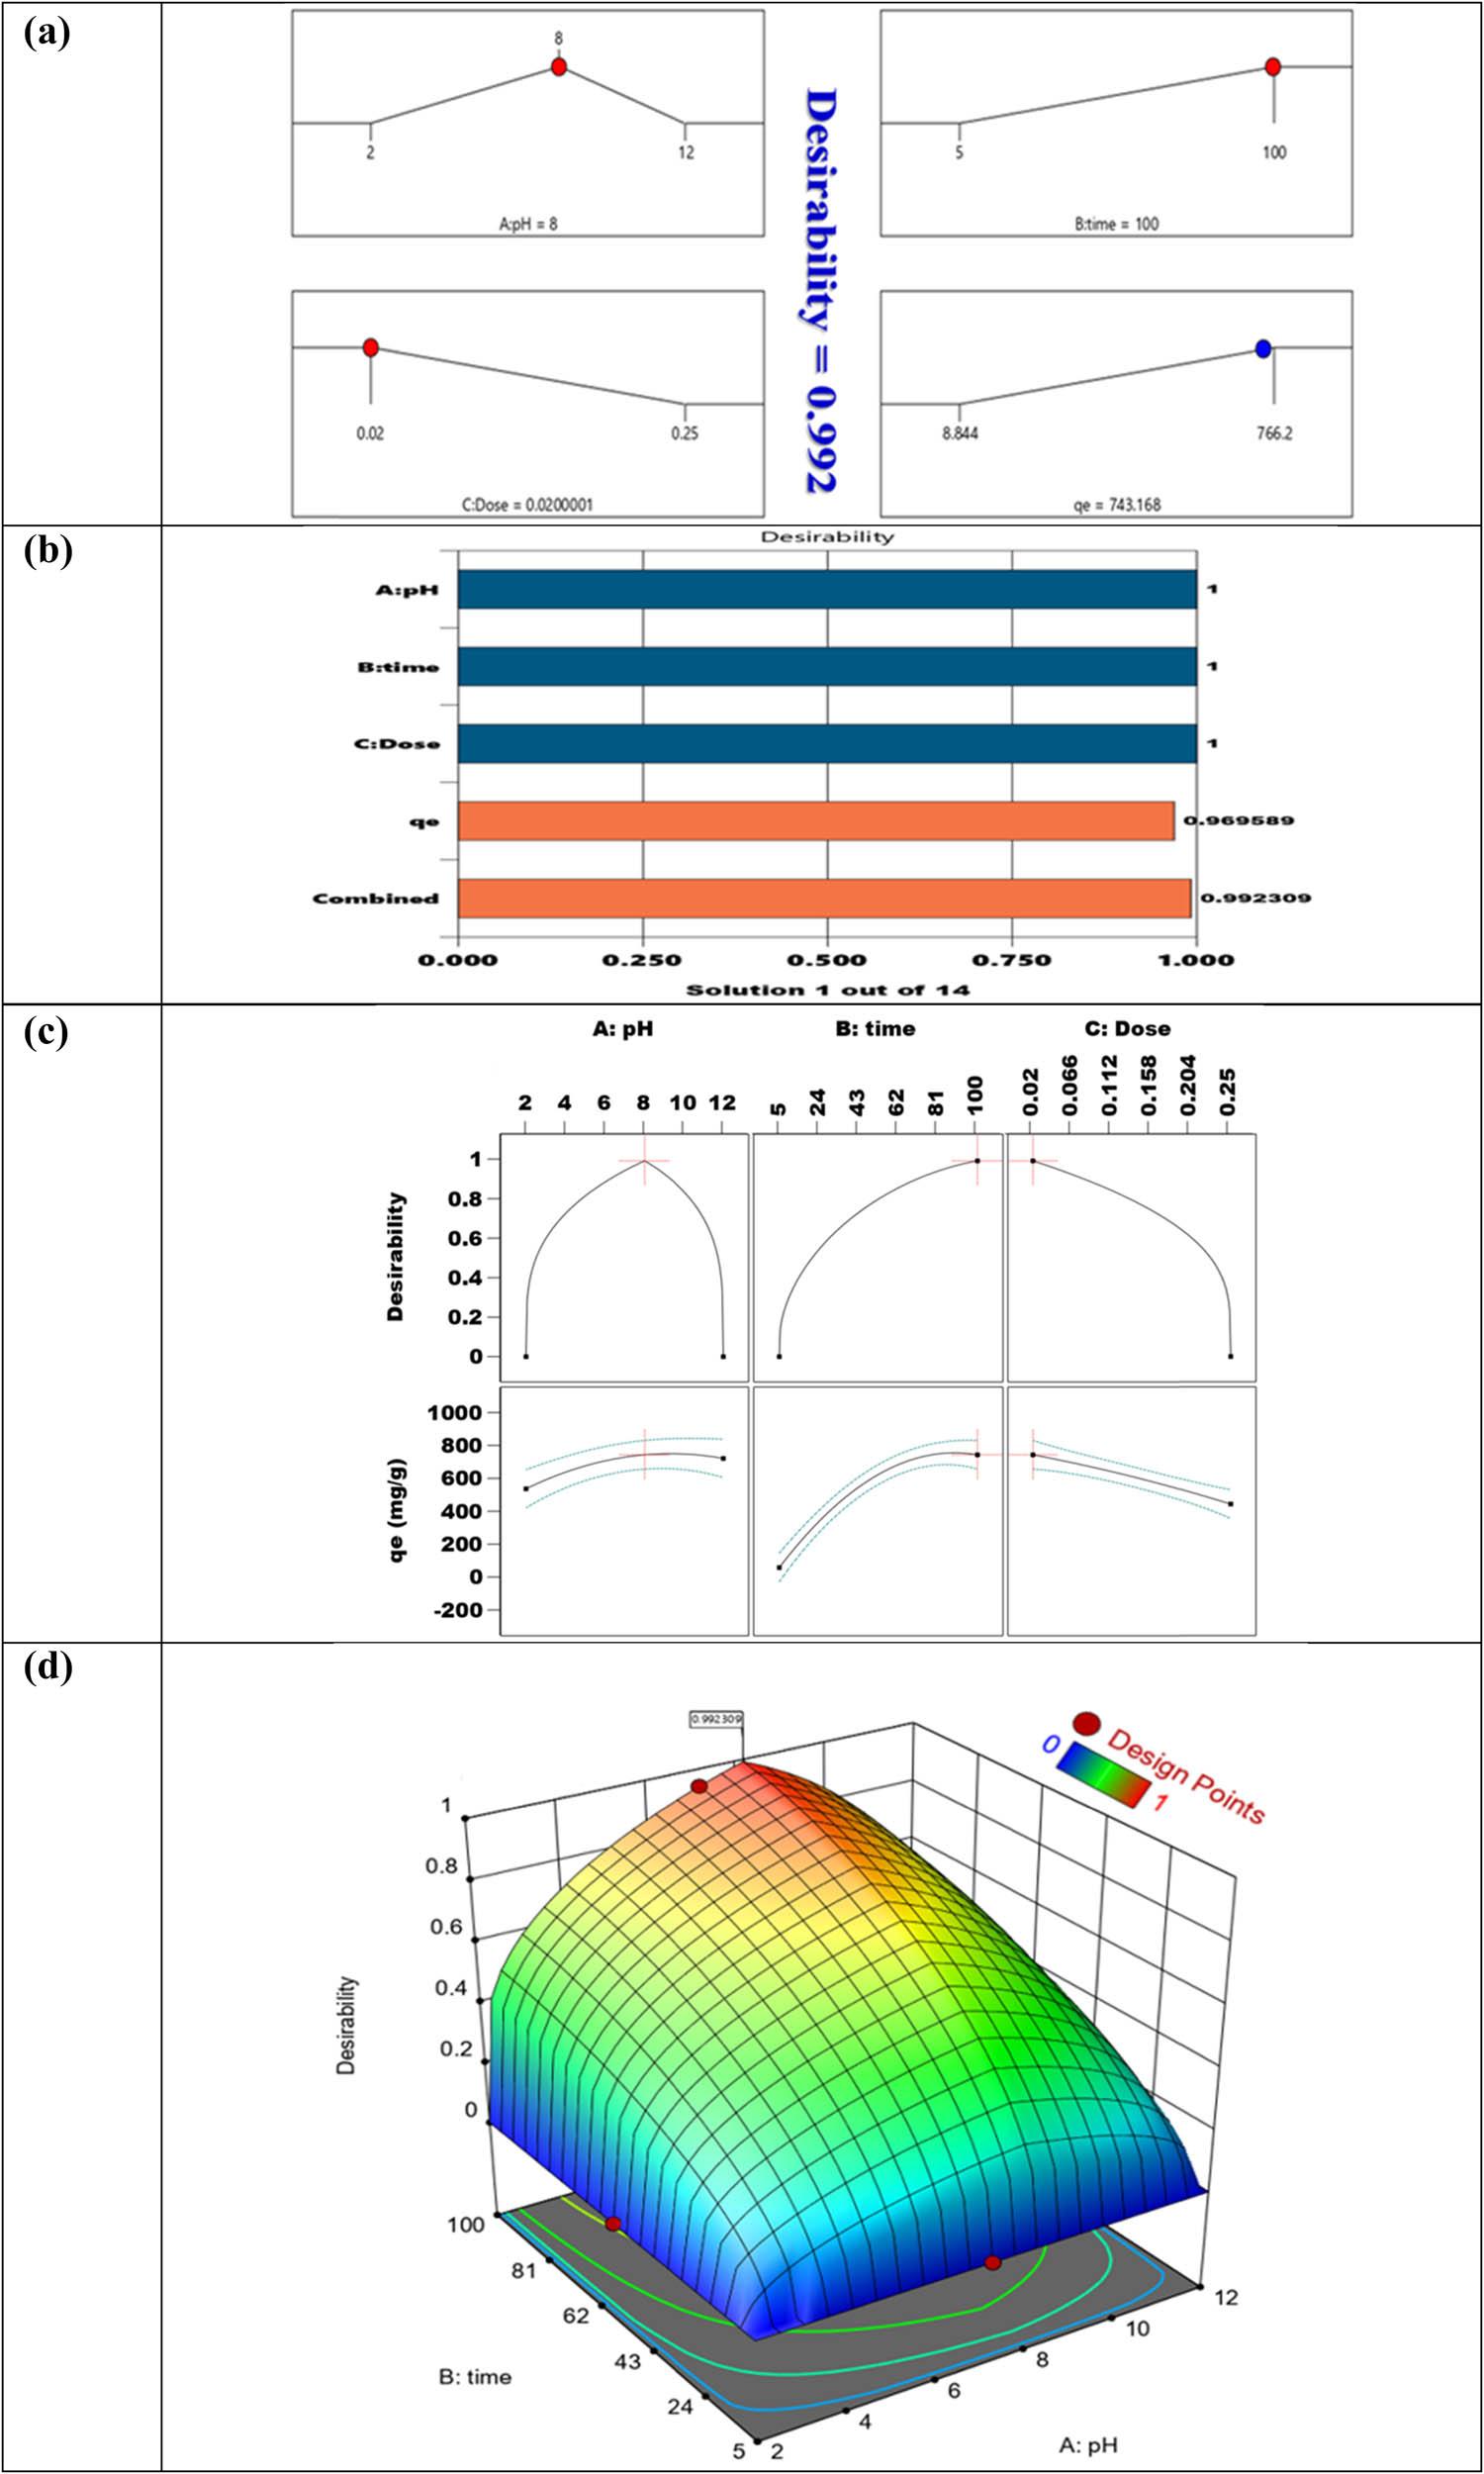
(a) The statistically optimal solutions are becoming more and more popular, (b) desirability of every answer, (c) the use of a bar graph to illustrate individual desirability, and (d) 3D of desirability of all responses.
The investigation examined MV2B dye adsorption in aqueous solutions by means of a MV-MOF encapsulated within a food-grade algae matrix coated with CMC and CS. Various analytical techniques, including XRD, XPS, SEM, nitrogen adsorption/desorption analysis, and FT-IR, were utilized for the characterization of MV-MOF/CMC-CS. This adsorbent boasts advantages due to a high surface area of 886.24 m2/g and a pore volume of 4.39 cm3/g. Post-adsorption measurements showed reductions to 642.86 m2/g in surface area and 2.86 cm3/g in pore volume, indicating effective dye adsorption into the MV-MOF/CMC-CS structure. An analysis of the kinetics indicates that the pseudo-second-order model provides the closest alignment with the observed information. The adsorption process also involves the creation of chemical linkages between the adsorbent and the adsorbate, according to the material’s underlying chemisorption device. The findings suggest that the MV-MOF/CMC-CS exhibits significant potential as an adsorbent for the elimination of MV2B dye from aqueous environments. The adsorption analysis shows a strong correlation with the Langmuir model, indicating an identical surface involvement. Thermodynamic evaluation reveals that the procedure is endothermic and spontaneous. The pH effects research indicates a significant relationship with the maximum adsorption capacity of 764.2 mg/g achieved at approximately pH 8. The efficiency and crystalline assembly of MV-MOF/CMC-CS were confirmed through PXRD evaluations after eight reuse cycles. A BBD was applied to optimize adsorption capabilities. Overall, because of their remarkable capacity, stability, and advantageous isotherm and thermodynamic characteristics, MV-MOF/CMC-CS were efficient at eliminating MV2B dye from wastewater.
The author extends his appreciation to Taif University, Saudi Arabia, for supporting this work through project number TU-DSPP-2024-100.
This research was funded by Taif University, Saudi Arabia (Project no. TU-DSPP-2024-100).
Conceptualization, data curation, formal analysis, investigation, methodology, visualization, writing – original draft, writing-review and editing: Sattam Al-Otaibi.
Authors state no conflict of interest.