Figure 1
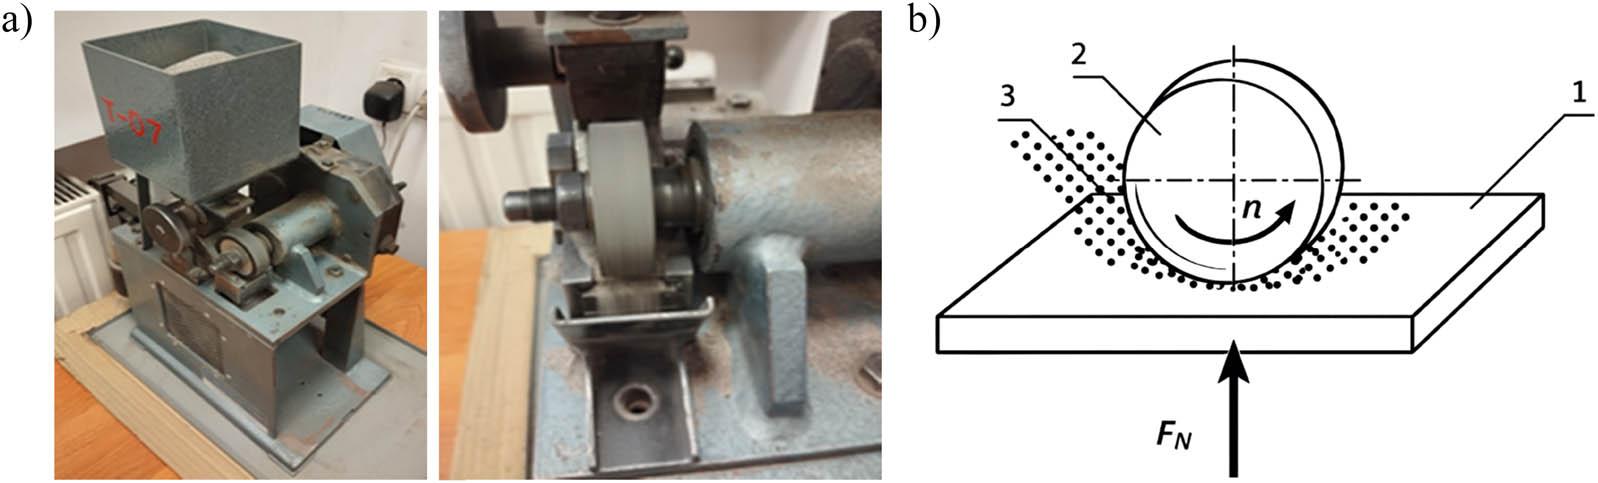
Figure 2
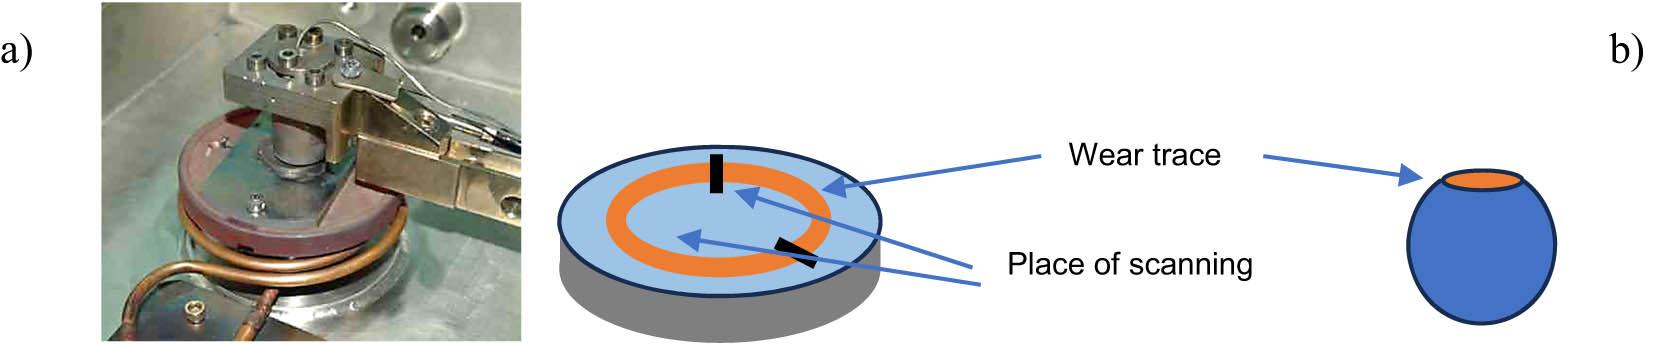
Figure 3
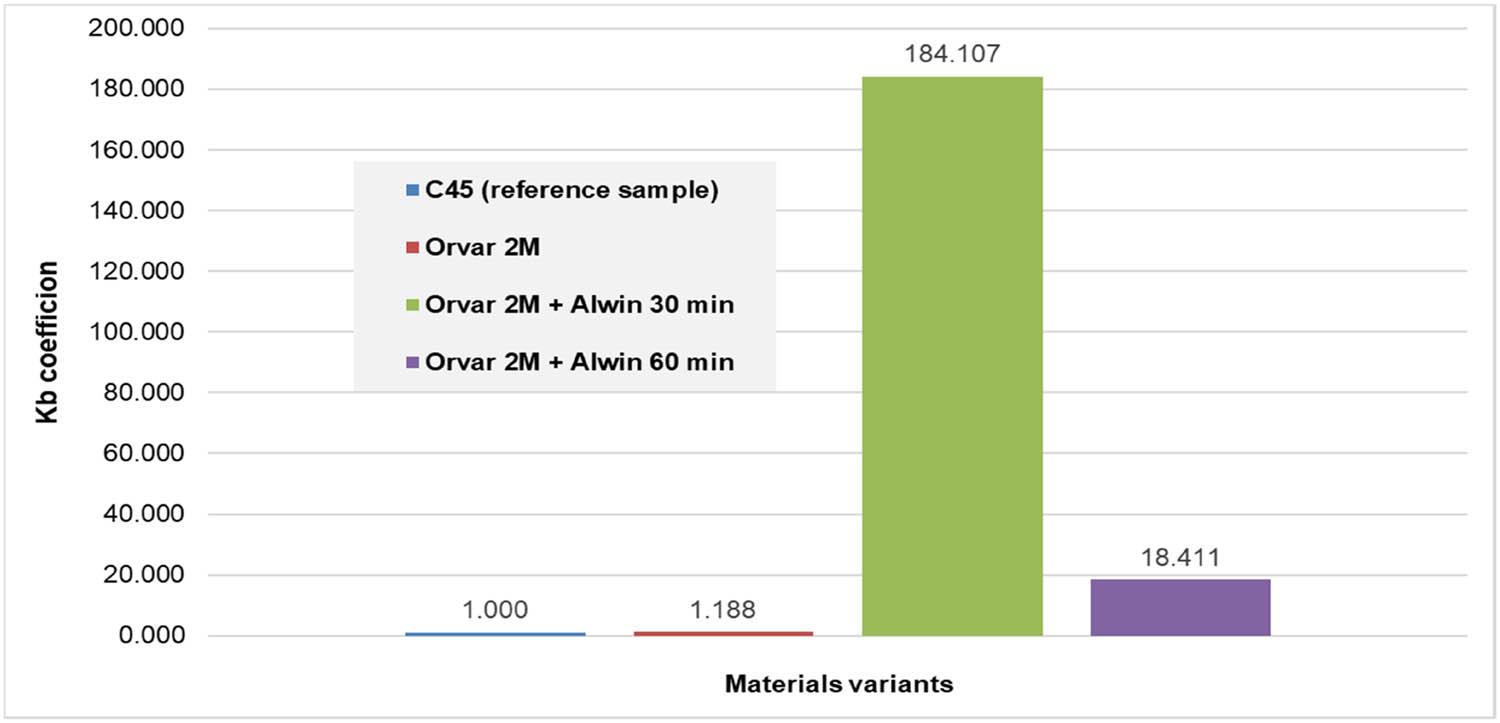
Figure 4
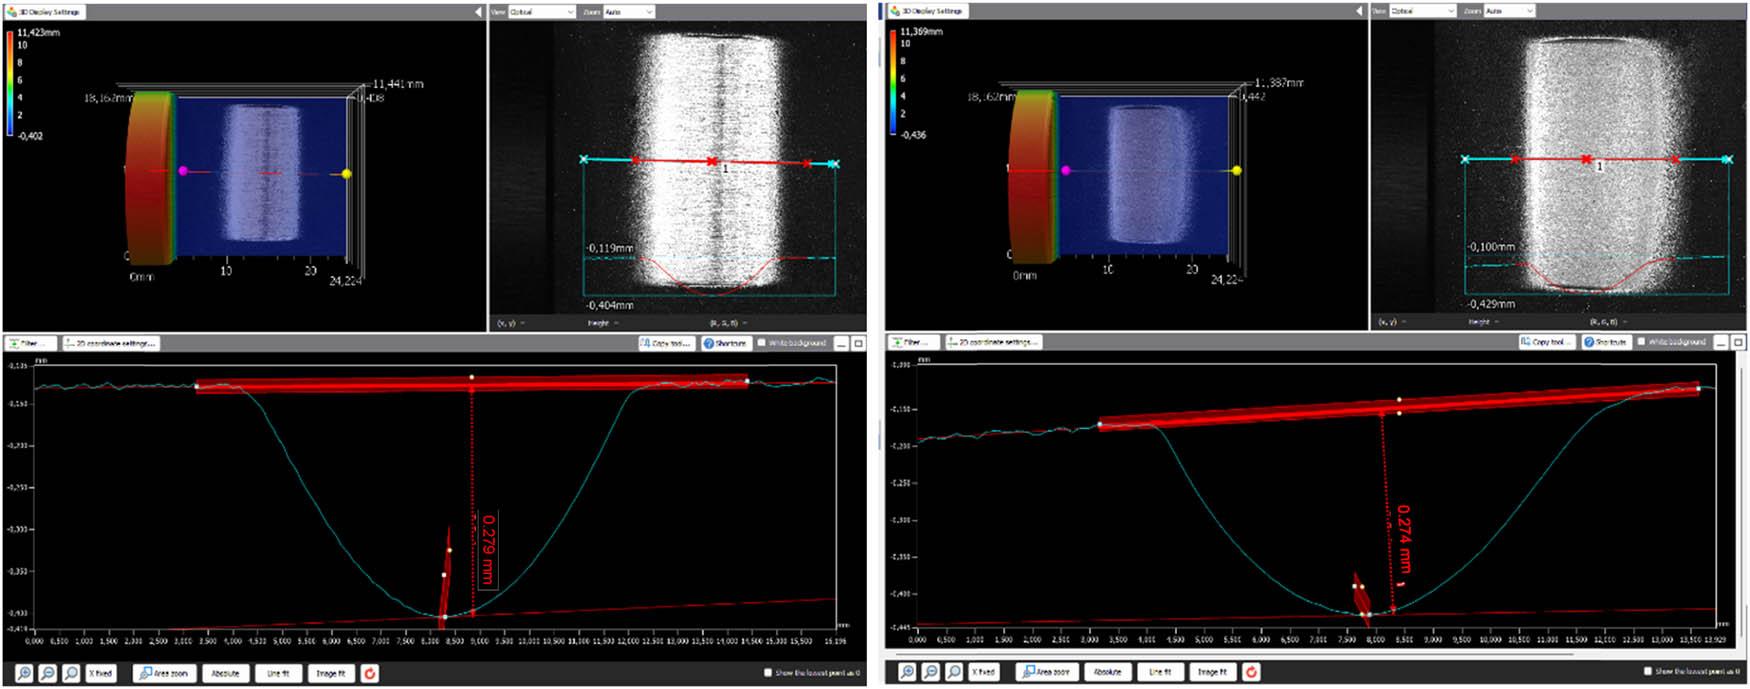
Figure 5
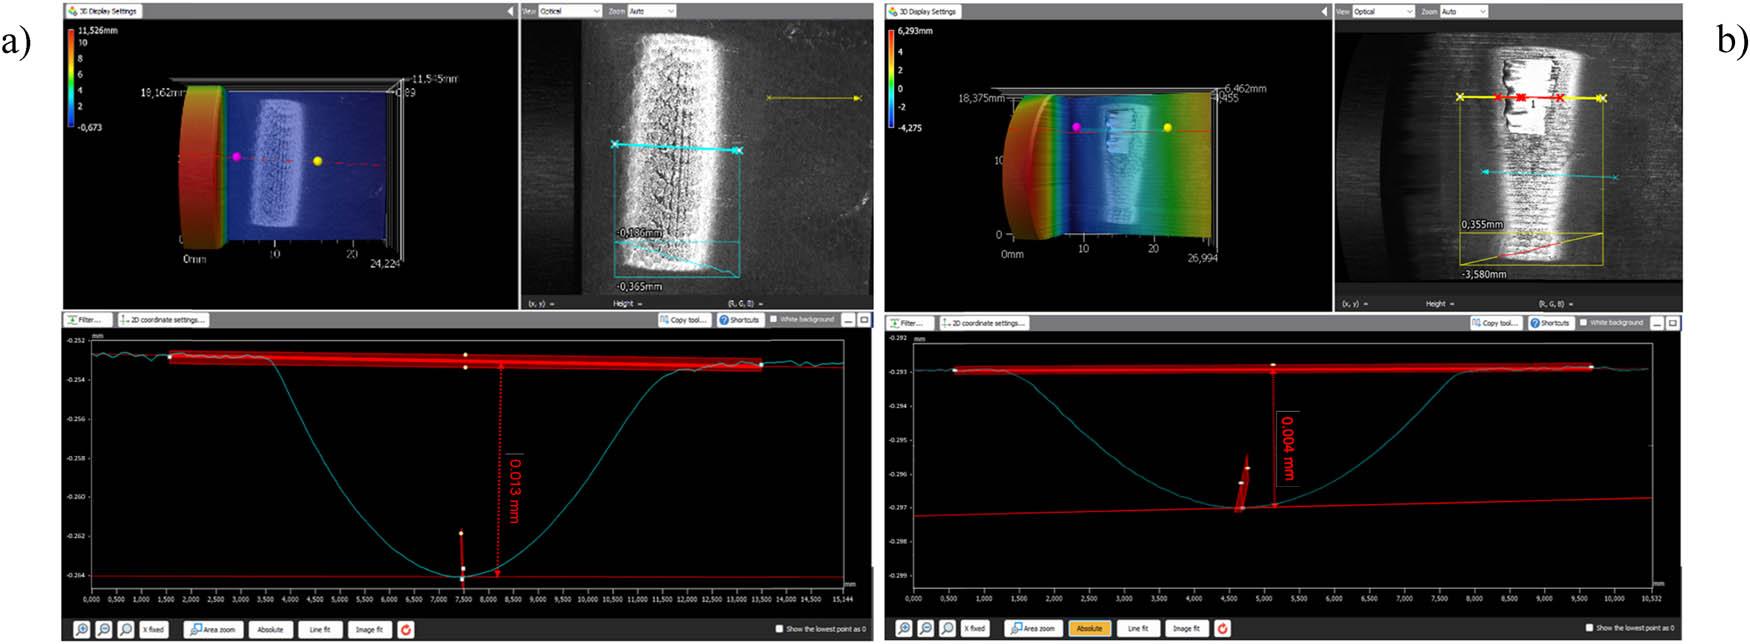
Figure 6
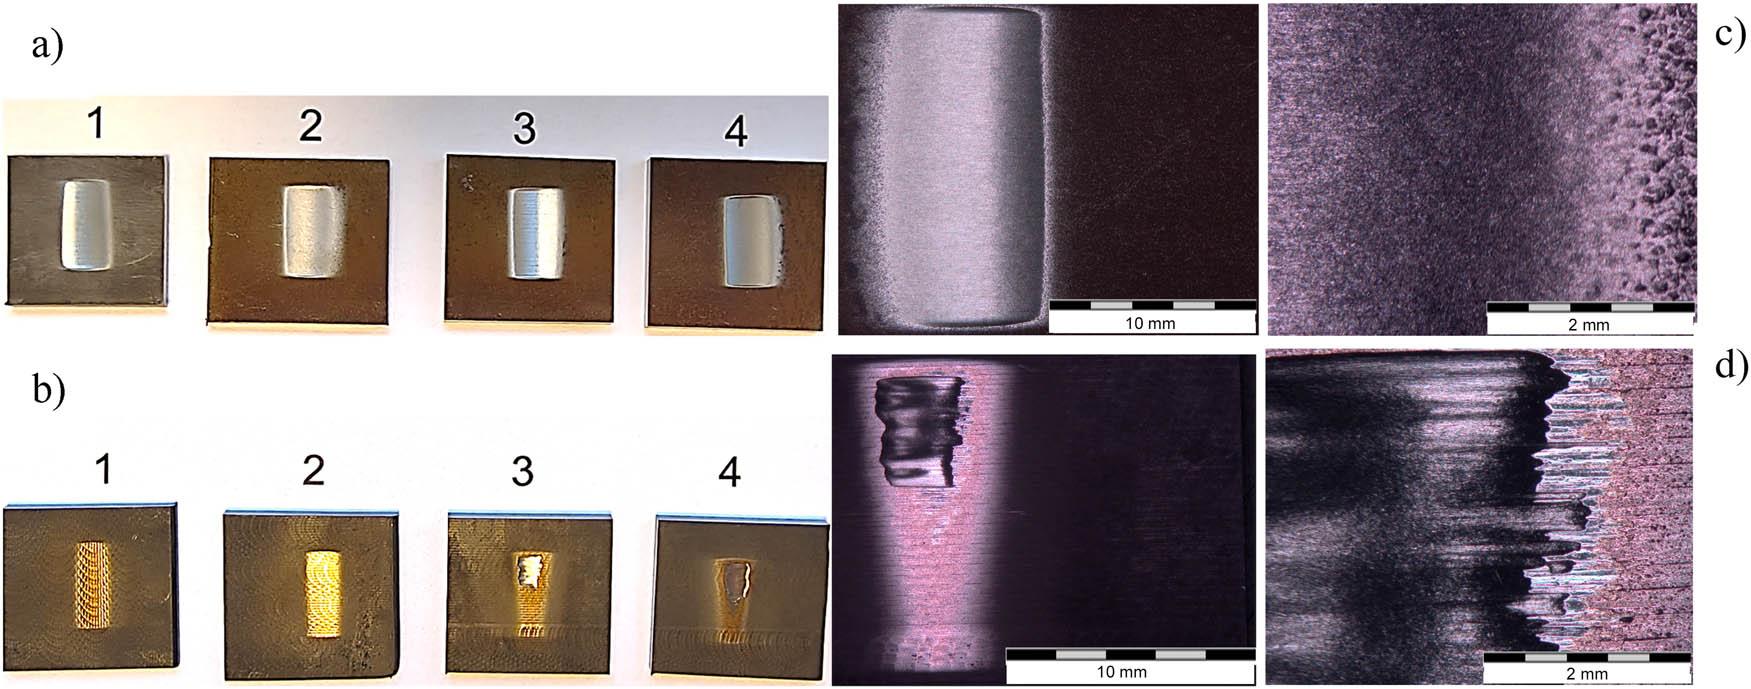
Figure 7
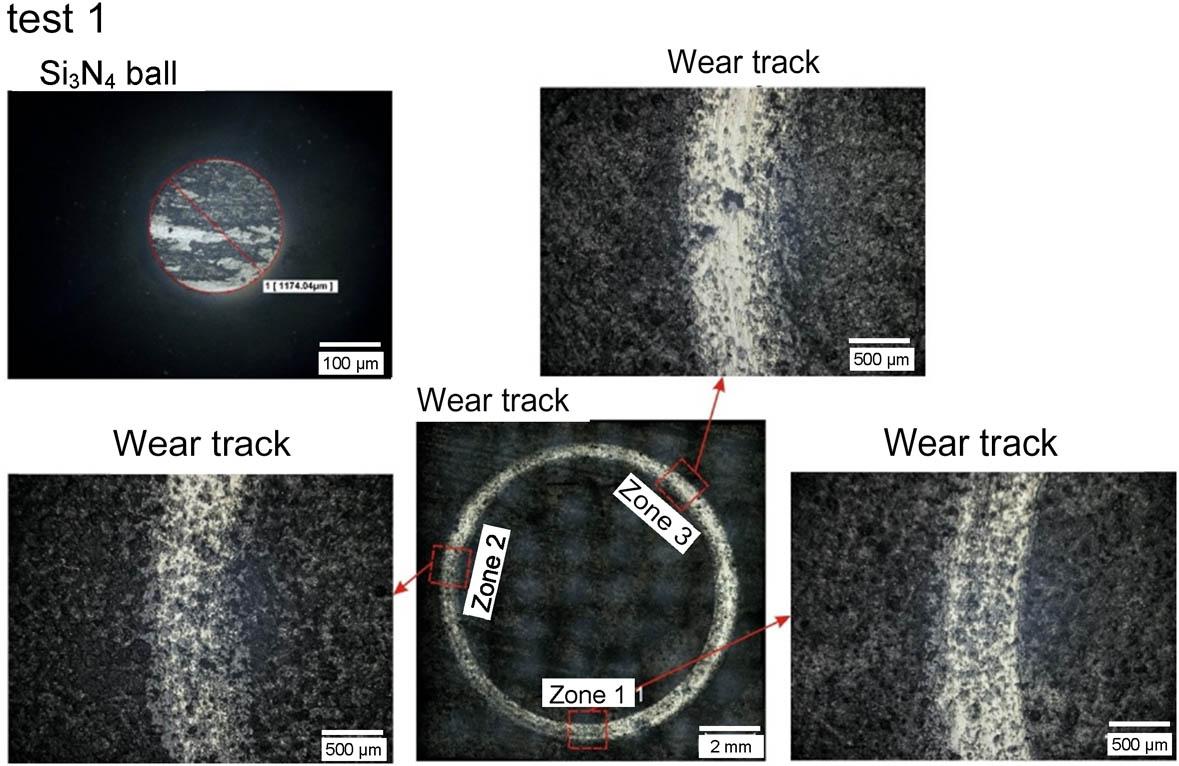
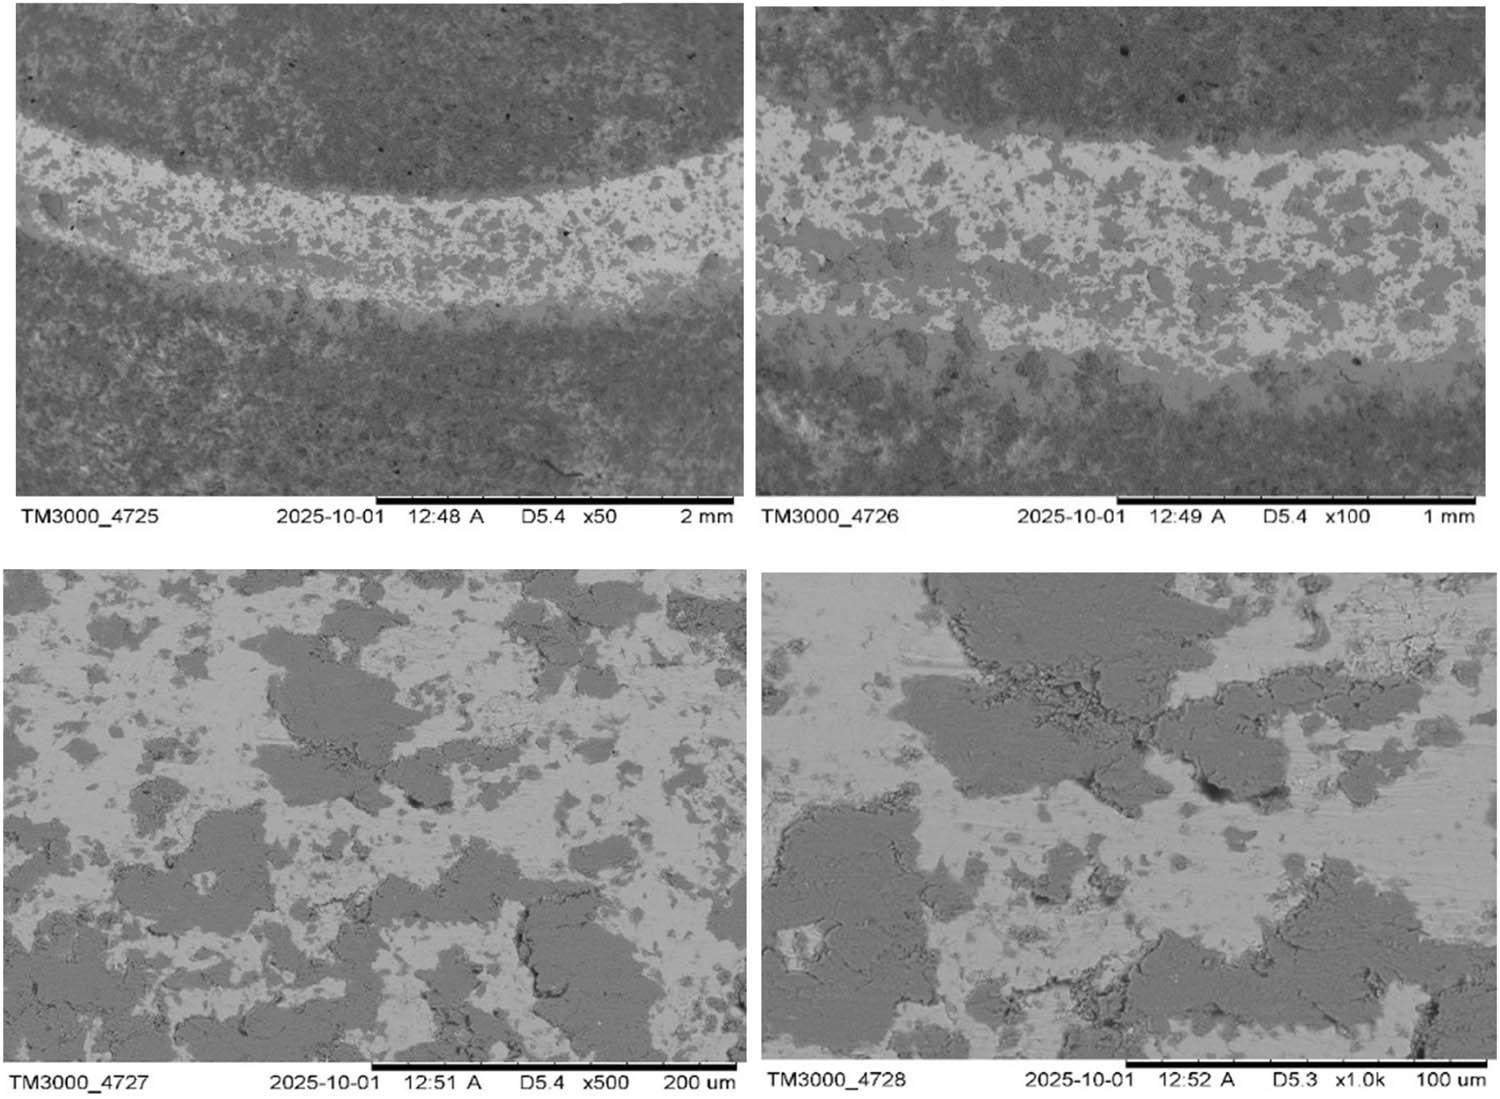
Figure 8
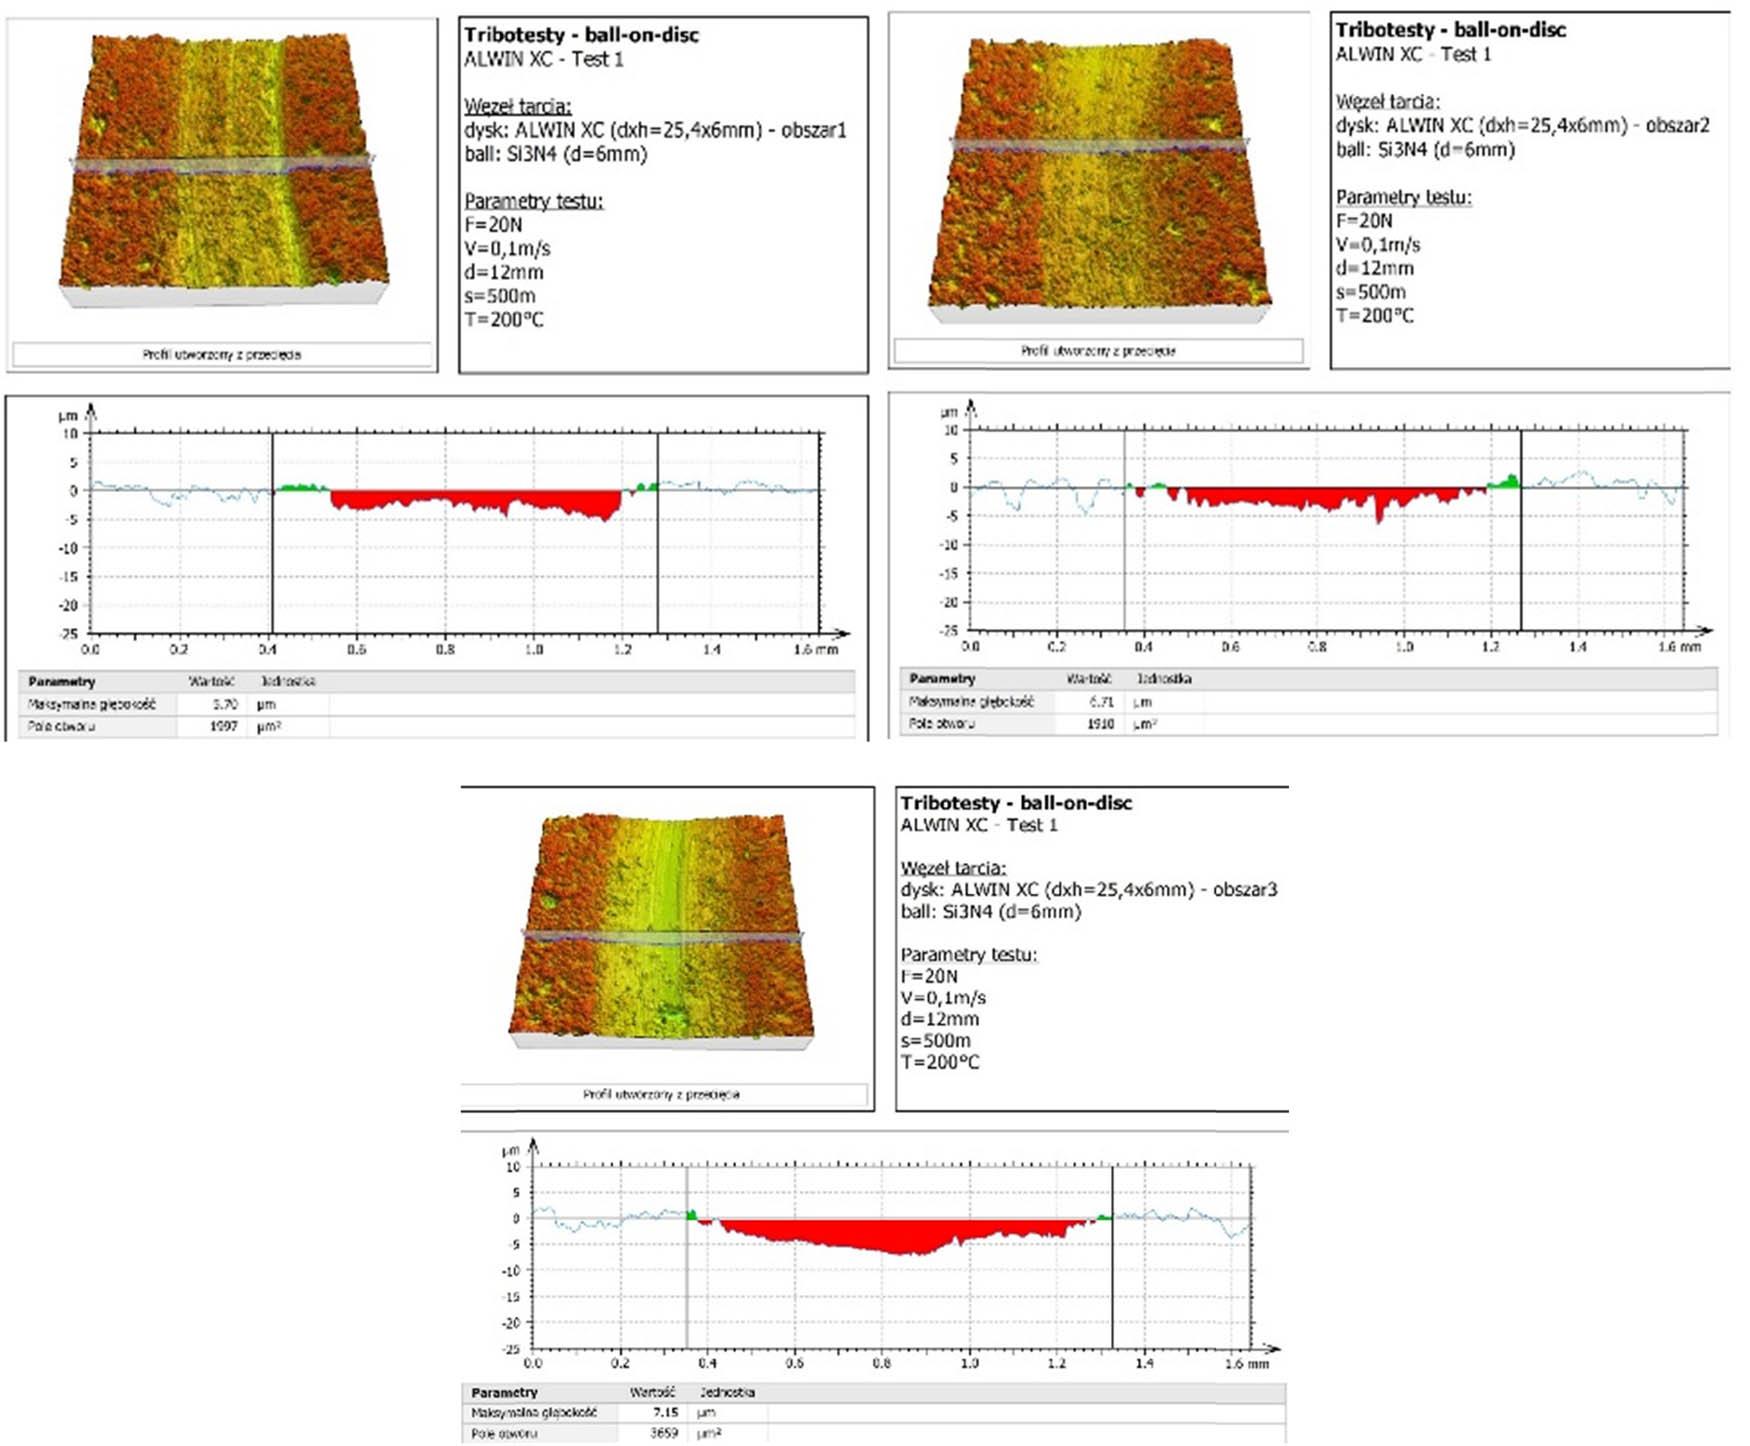
Figure 9
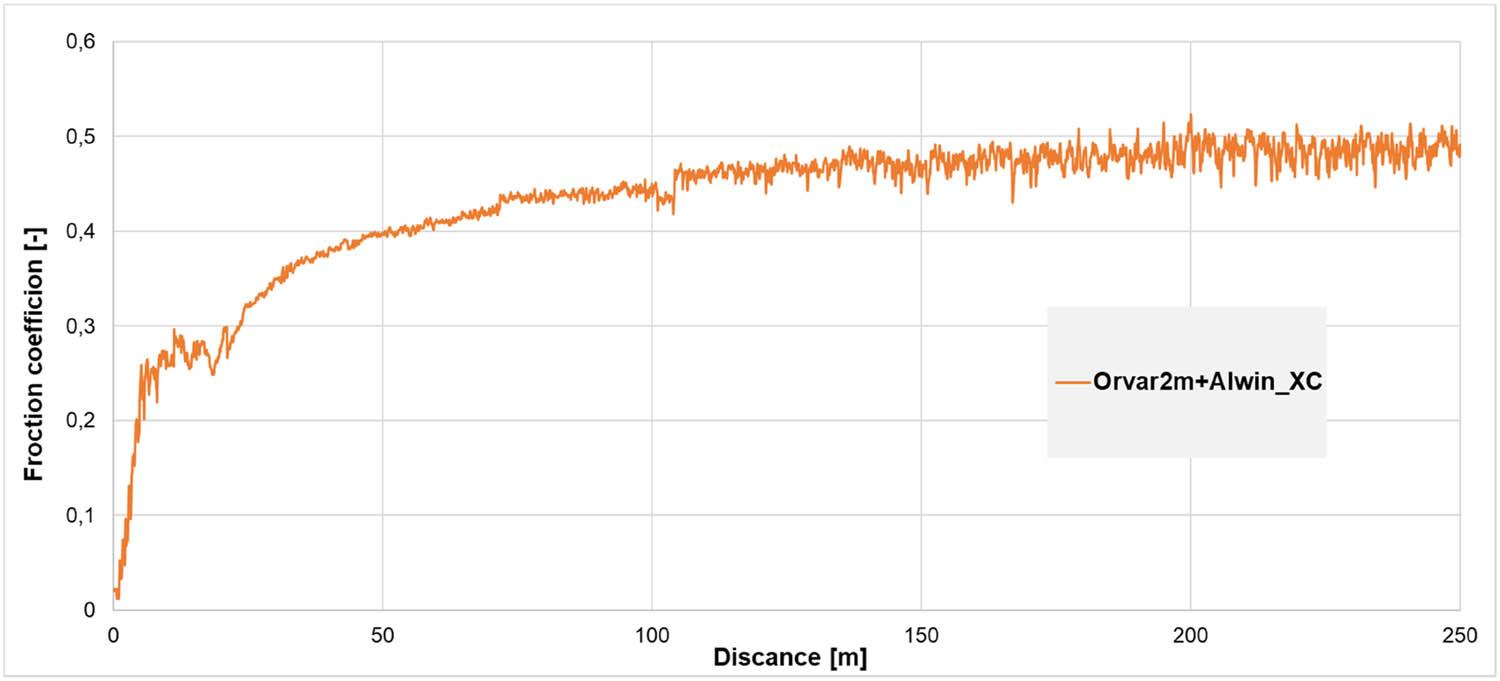
Figure 10
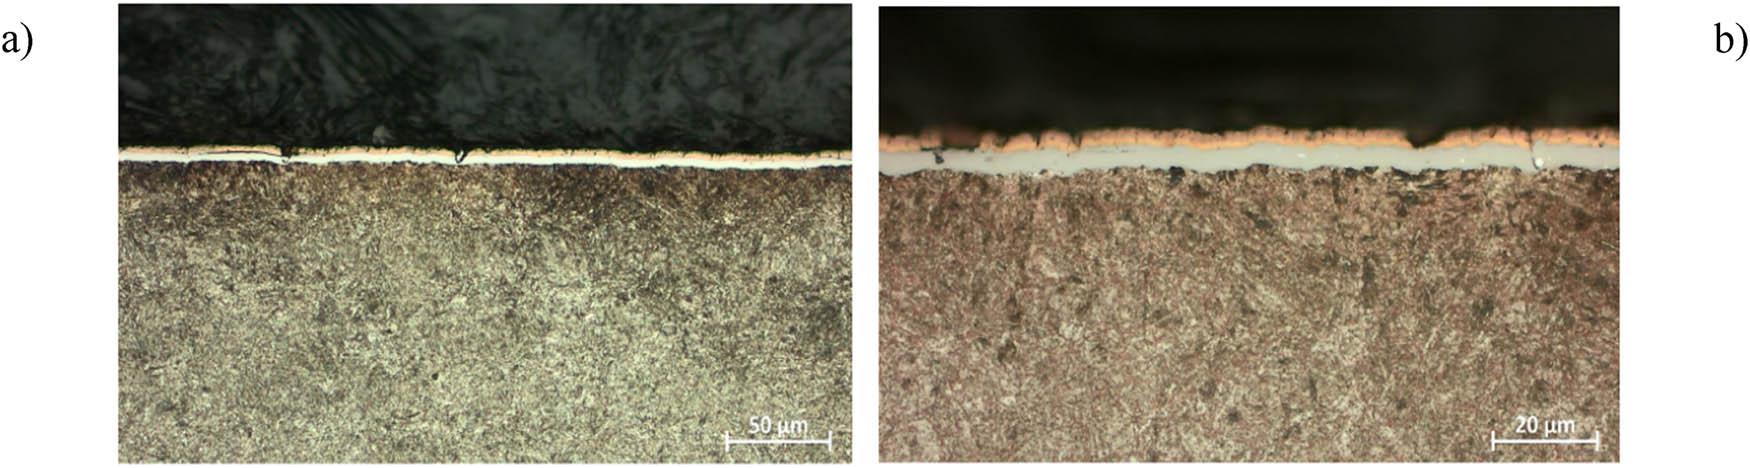
Figure 11
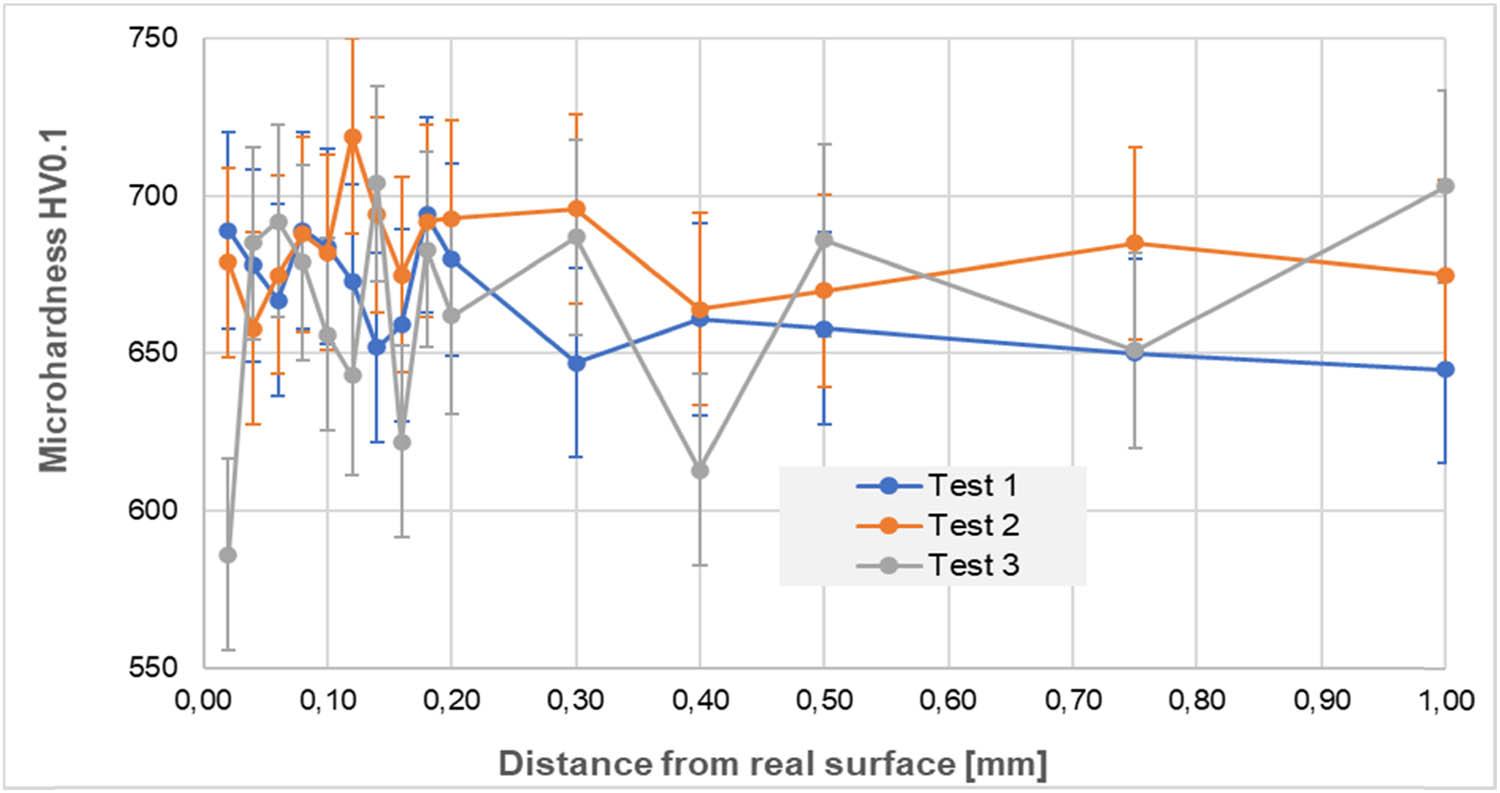
Figure 12
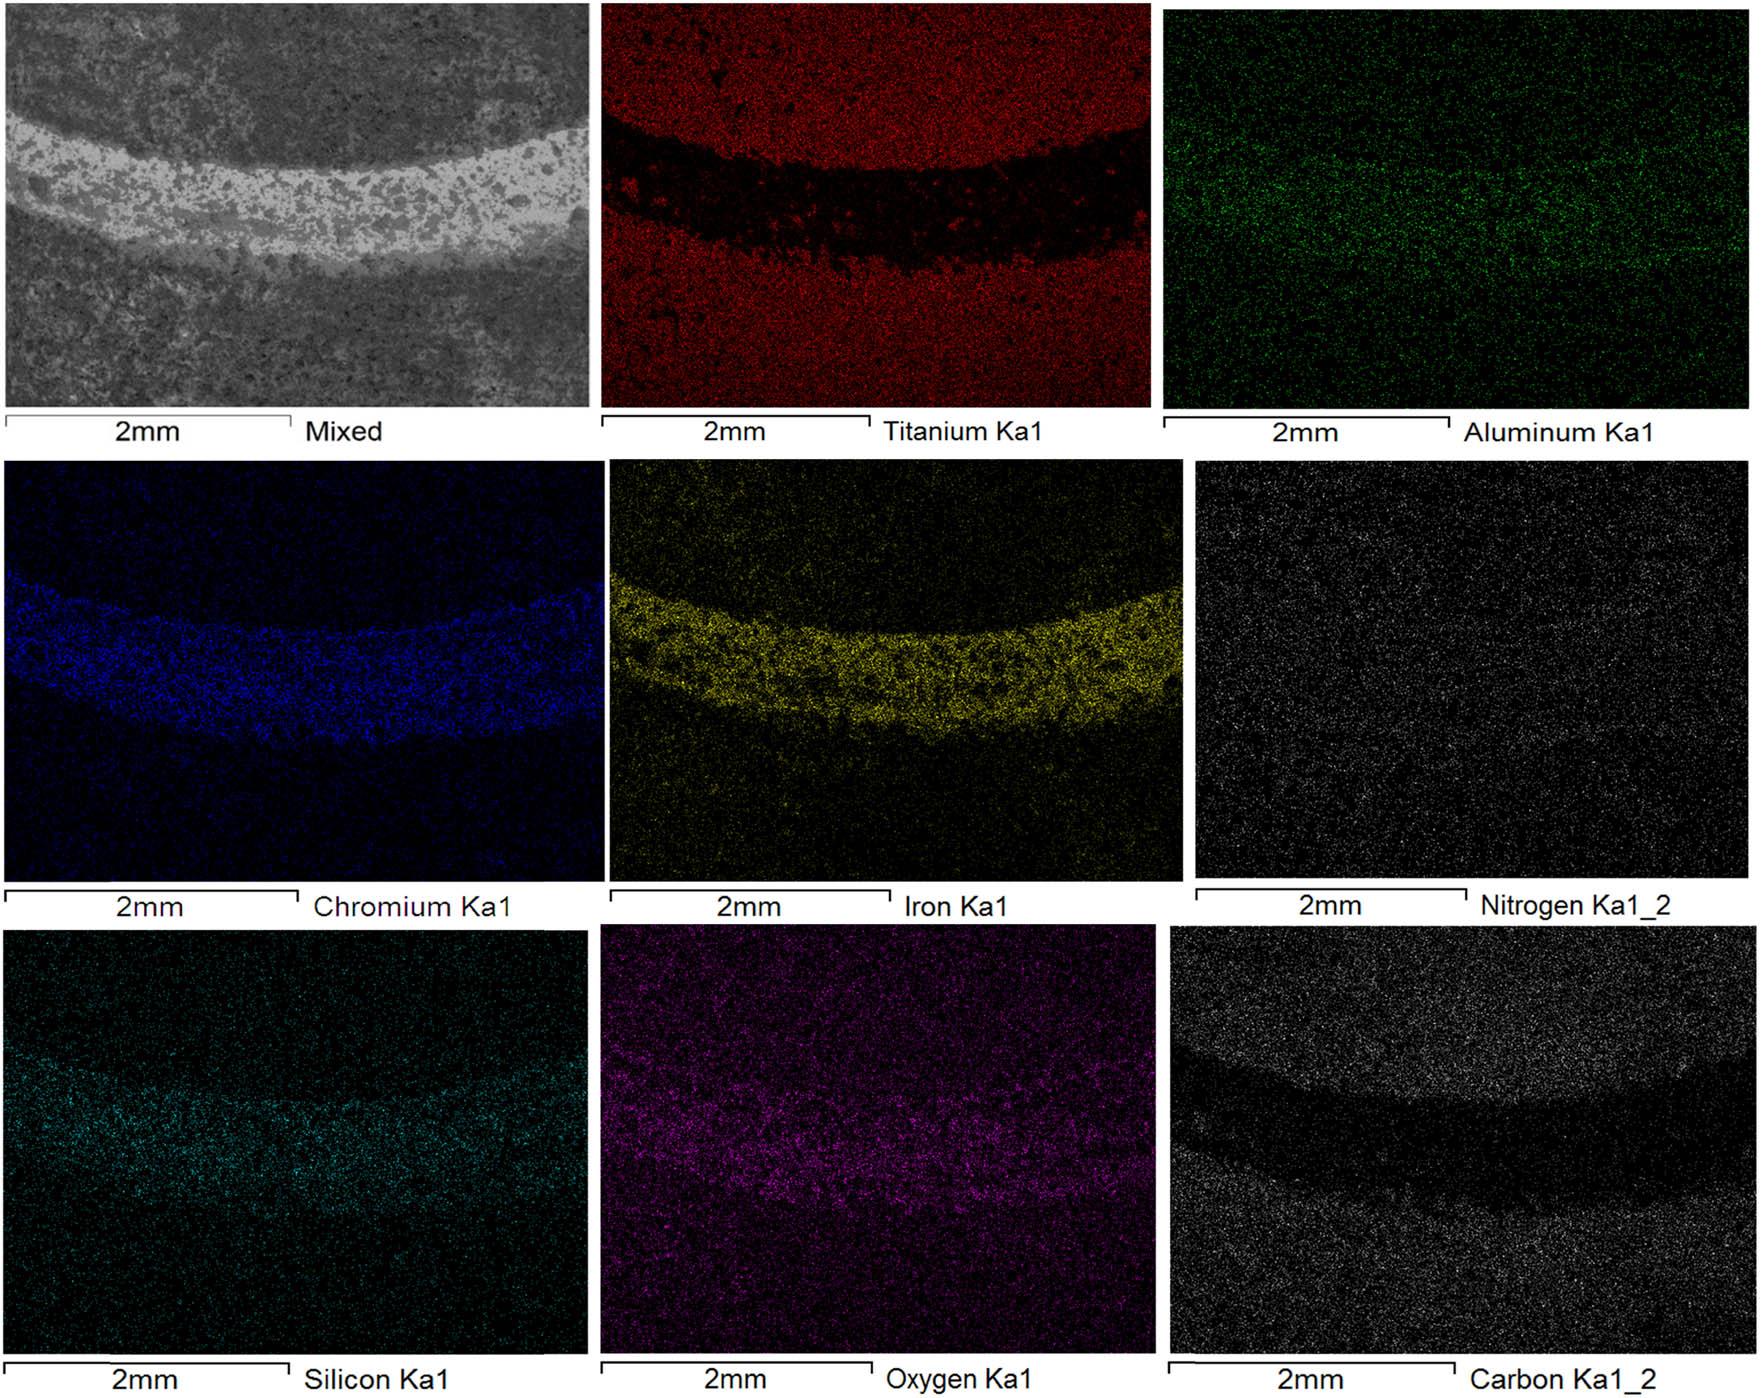
Figure 13
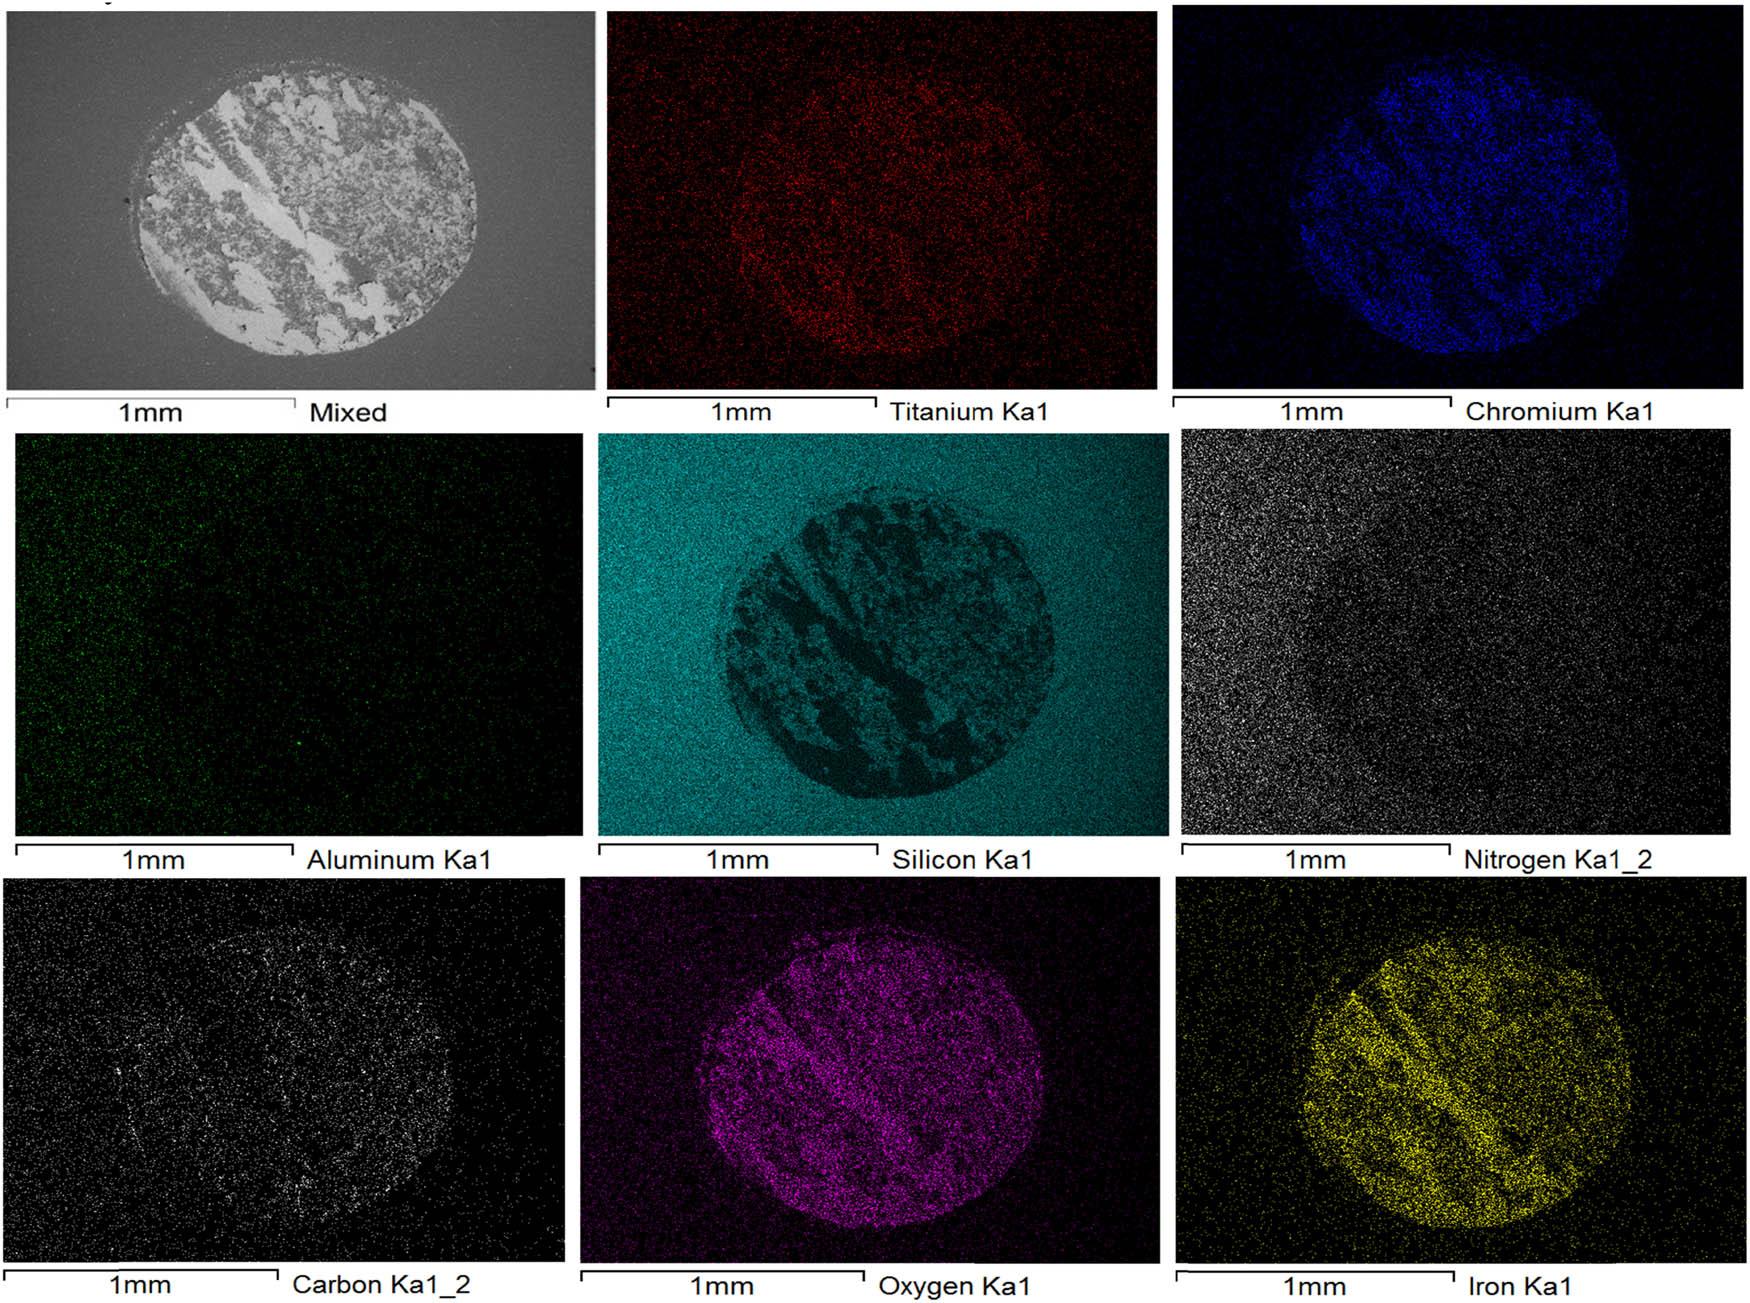
Figure 14
Dry abrasive test results for the tested materials_
| Material | Wear – average value (g) | Density (g/cm3) | Rotations | Coefficient K b |
|---|---|---|---|---|
| C45 (reference sample) | 0.062 | 7.86 | 600 | 1.000 |
| Orvar 2M | 0.155 | 7.78 | 1,800 | 1.188 |
| Orvar 2M + AlWIN 30 min | 0.001 | 7.78 | 1,800 | 184.107 |
| Orvar 2M + AlWIN 60 min | 0.02 | 7.78 | 3,600 | 18.411 |
Summary of abrasive wear results from the tribological tests_
| Test no. | Temperature T (°C) | Sliding distance S (m) | Volumetric wear Z obj (m3) | Wear index W z (m3/N*m) |
|---|---|---|---|---|
| Test 1 | 200 | 500 | 9.51 × 10⁻¹¹ | 9.51 × 10⁻¹⁵ |
| Test 2 | 400 | 150 | 1.06 × 10⁻¹⁰ | 3.53 × 10⁻¹⁴ |
| Test 3 | 600 | 150 | 1.67 × 10⁻¹⁰ | 5.57 × 10⁻¹⁴ |
Tribological test parameters_
| Conditions/test no. | Disc temperature T (°C) | Test duration t (s) | Sliding distance s (m) | Load F (N) | Rotational speed v (m/s) | Wear track radius r (m) |
|---|---|---|---|---|---|---|
| Test 1 | 200 | 5,000 | 500 | 10 | 0.1 | 0.006 |