Figure 1
Figure 2
Figure 3
Figure 4
Figure 5
Figure 6
Figure 7
Figure 8
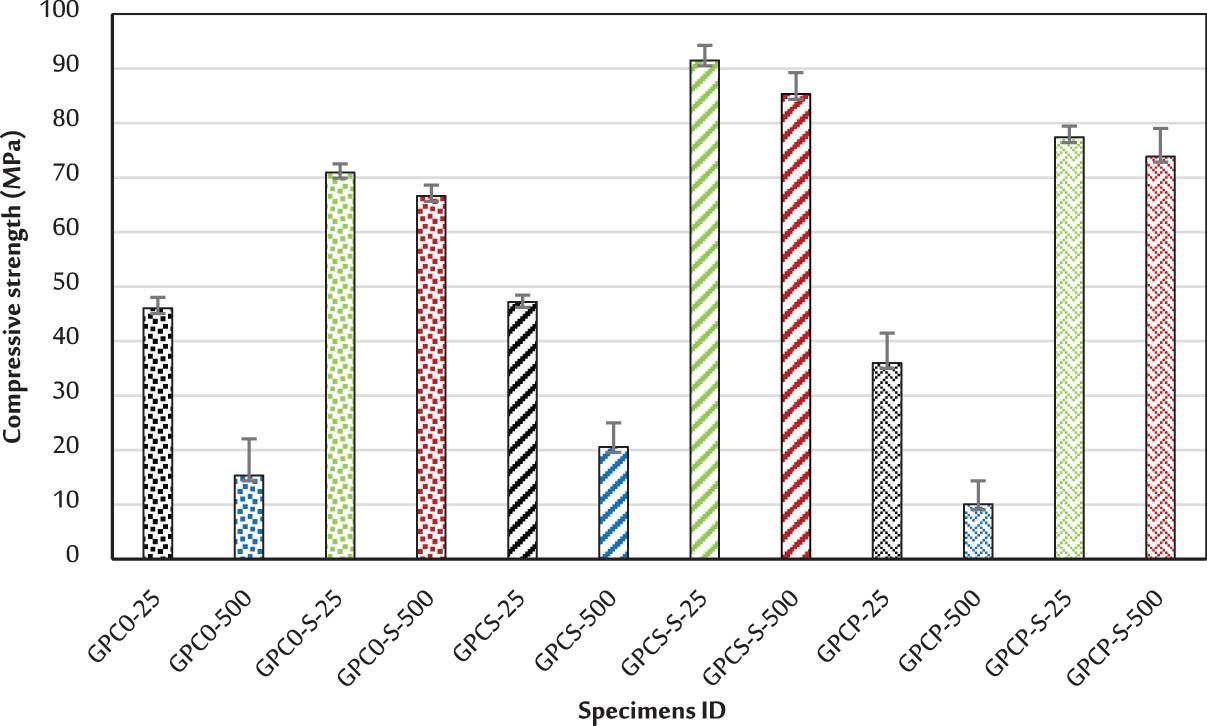
Figure 9
Figure 10
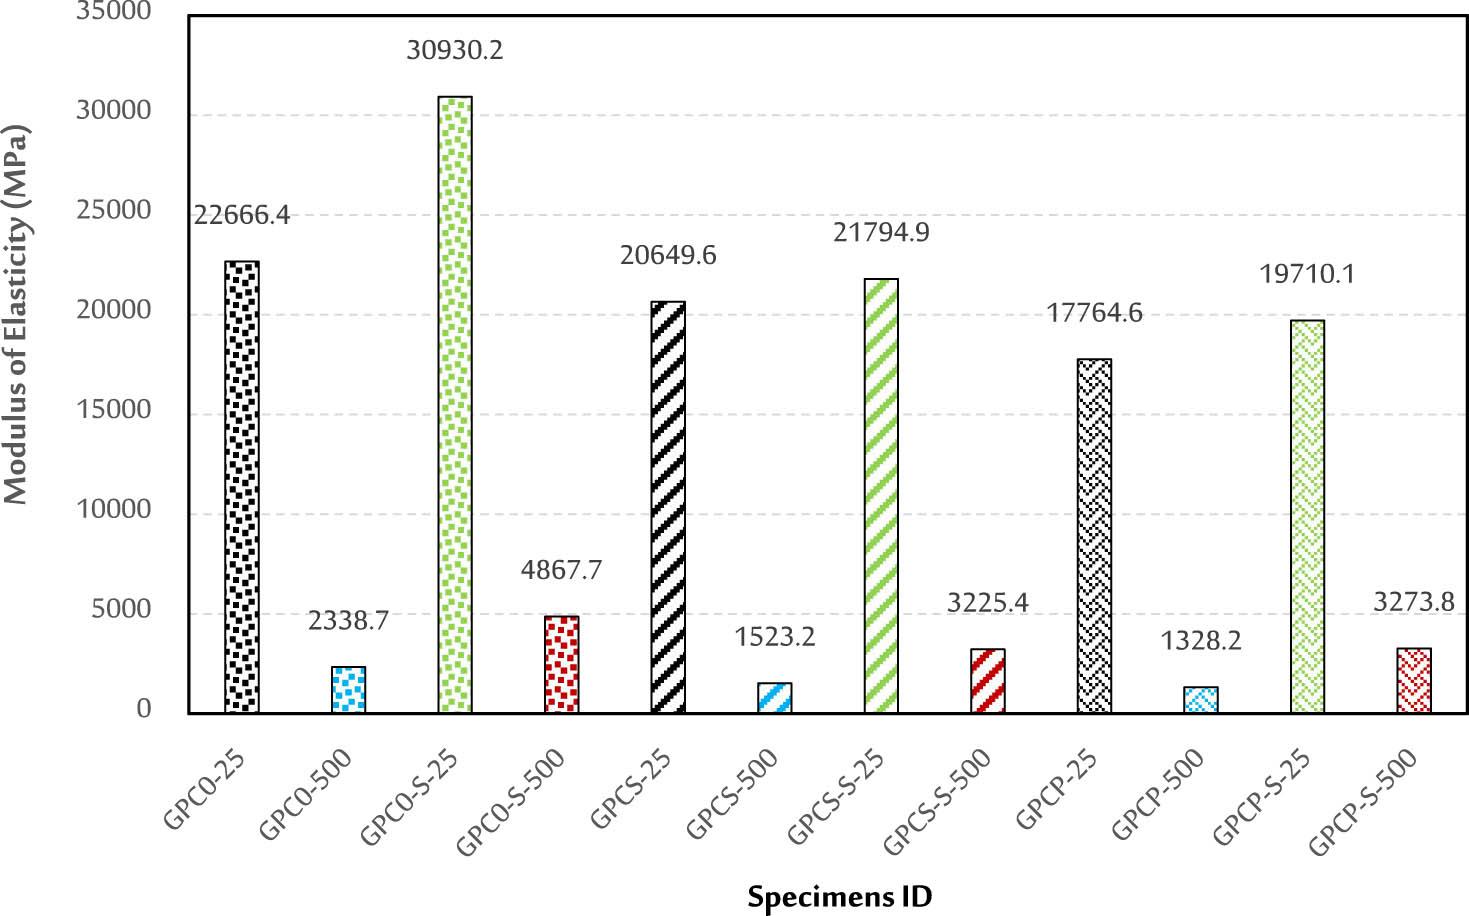
Summary of test results_
| Specimens | Compressive strength (MPa) | Relative difference* | Modulus of elasticity (MPa) | Relative difference* |
|---|---|---|---|---|
| GPC0-25 | 46.0 | — | 22666.4 | — |
| GPC0-500 | 15.4 | −66.7% | 2338.7 | −89.7% |
| GPC0-S-25 | 70.9 | +54.0% | 30930.2 | +36.5% |
| GPC0-S-500 | 66.6 | +44.7% | 4867.7 | −78.5% |
| GPCS-25 | 47.2 | — | 20649.6 | — |
| GPCS-500 | 20.6 | −56.4% | 1523.2 | −92.6% |
| GPCS-S-25 | 91.5 | +93.9% | 21794.9 | +5.5% |
| GPCS-S-500 | 85.3 | +80.9% | 3225.4 | −84.4% |
| GPCP-25 | 36.0 | — | 17764.6 | — |
| GPCP-500 | 10.1 | −72.0% | 1328.2 | −92.5% |
| GPCP-S-25 | 77.4 | +115.1% | 19710.1 | +11.0% |
| GPCP-S-500 | 73.9 | +105.2% | 3273.8 | −81.6% |
FRGPC mix proportions in kg/m3_
| Material | FRGPC0 mix | FRGPC1 mix | FRGPC2 mix | |
|---|---|---|---|---|
| MK | 285 | 285 | 285 | |
| FA | 65 | 65 | 65 | |
| White sand (max size: 2 mm) | 419 | 419 | 419 | |
| SF | — | 78.5 | — | |
| PVA | — | — | 13 | |
| Alkaline solutions | Na2SiO3 | 197 | 197 | 197 |
| NaOH | 110 | 110 | 110 | |
| Coarse aggregate | (Maximum size of 10 mm) | 1,272 | 1,272 | 1,272 |
| (Maximum size of 4.75 mm) | 180 | 180 | 180 | |
CFRP sheet and epoxy adhesive characteristics_
| Material | Property | Value | Notes |
|---|---|---|---|
| Epoxy adhesive | Tensile strength | 71.5 MPa | Given by the manufacturer |
| Tensile elastic modulus | 1.86 GPa | ||
| Tensile strain at break | 5.25% | ||
| CFRP sheet | Thickness | 0.6 mm | Experimental values |
| Ultimate tensile strength | 1,122 MPa | ||
| Tensile elastic modulus | 68.9 GPa |
Test specimens_
| Concrete mix | Specimen ID | Fiber type | Exposure to temperature (°C) | Strengthening | No. of specimens |
|---|---|---|---|---|---|
| FRGPC0 | GPC0-25 | — | 25 | — | 3 |
| GPC0-500 | 500 | 3 | |||
| GPC0-S-25 | 25 | CFRP | 3 | ||
| GPC0-S-500 | 500 | 3 | |||
| FRGPC1 | GPCS-25 | SF | 25 | — | 3 |
| GPCS-500 | 500 | 3 | |||
| GPCS-S-25 | 25 | CFRP | 3 | ||
| GPCS-S-500 | 500 | 3 | |||
| FRGPC2 | GPCP-25 | PVA | 25 | — | 3 |
| GPCP-500 | 500 | 3 | |||
| GPCP-S-25 | 25 | CFRP | 3 | ||
| GPCP-S-500 | 500 | 3 | |||
| Total no. of specimens | 36 | ||||
MK’s chemical analysis [42]_
| Composition | SiO2 | Al2O3 | Fe2O3 | TiO2 | CaO | SO3 | K2O | Na2O | MgO | P2O5 | Others |
|---|---|---|---|---|---|---|---|---|---|---|---|
| Value (%) | 50.995 | 42.631 | 2.114 | 1.713 | 1.287 | 0.439 | 0.337 | 0.284 | 0.127 | 0.051 | 0.022 |