
Table 1
Typical chemical composition of INCONEL 718 (mass fraction, %).
| C | Si | Mn | Mo | S | Ni | Cr | Nb |
|---|---|---|---|---|---|---|---|
| ≤0.08 | ≤0.35 | ≤0.35 | 2.8–3.3 | ≤0.01 | 50–55 | 17–21 | 4.75–5.5 |
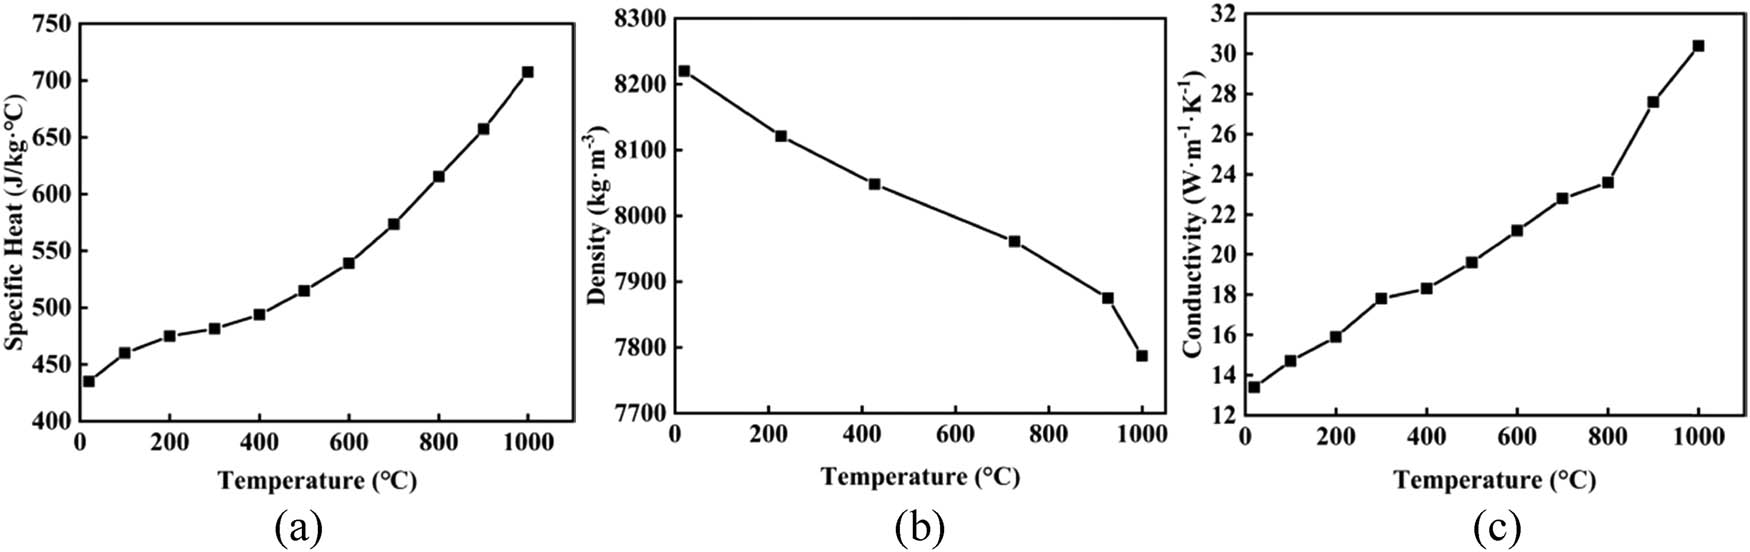
Figure 1
Thermophysical parameters of Inconel 718: (a) specific heat, (b) density, and (c) conductivity.
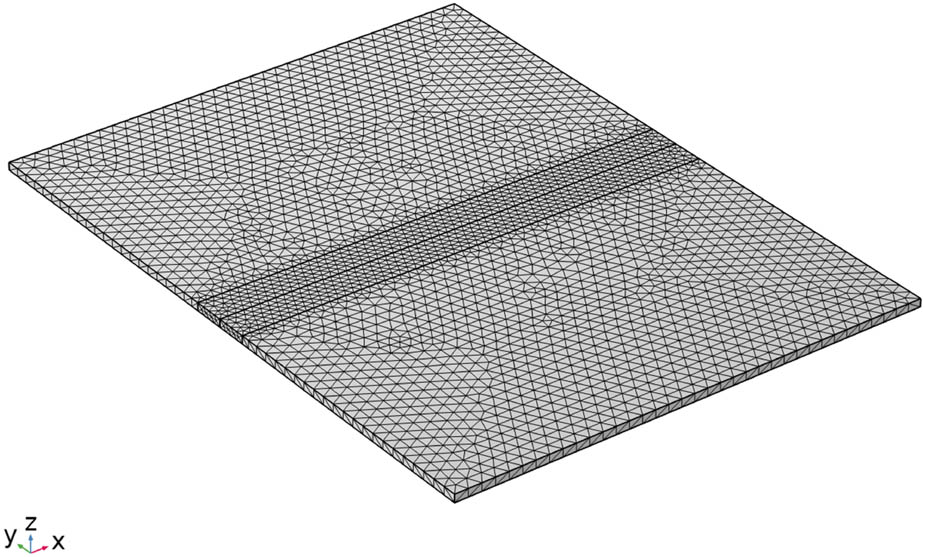
Figure 2
Grid division of the finite element model.
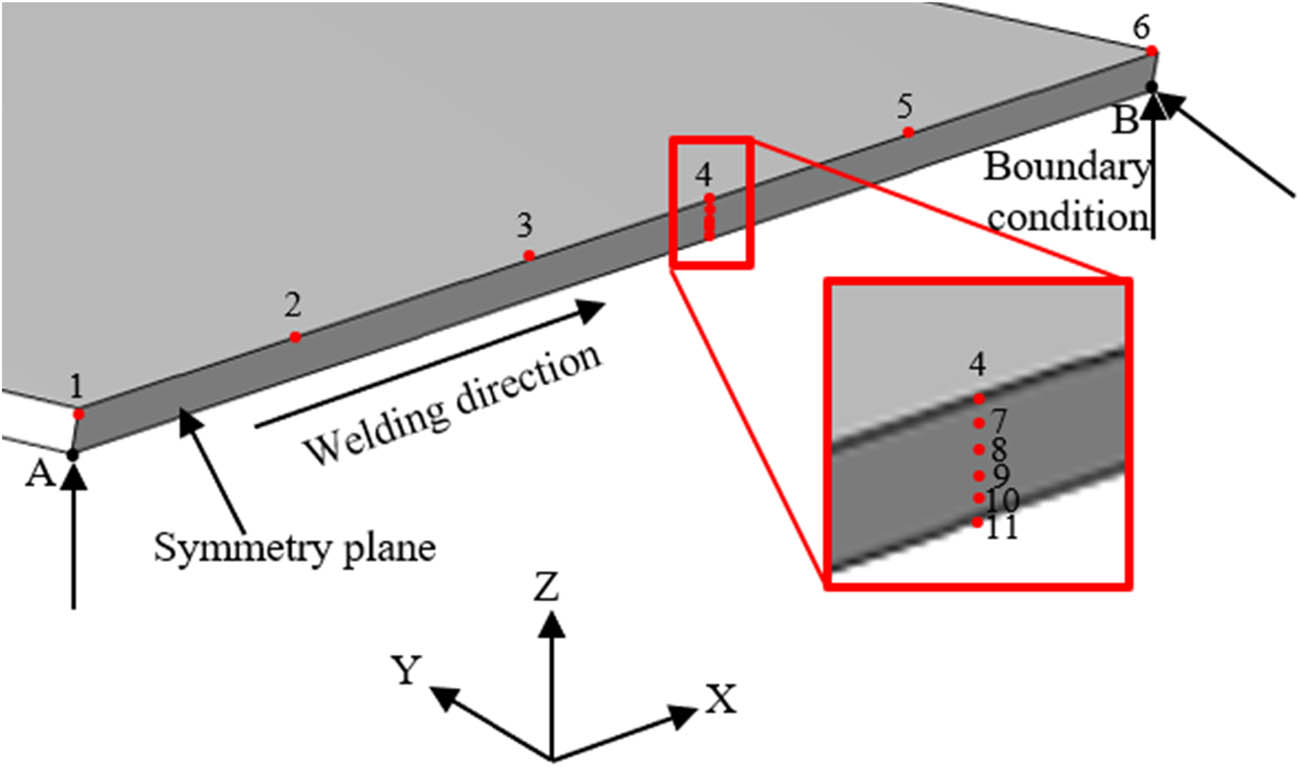
Figure 3
Finite element model and boundary condition.
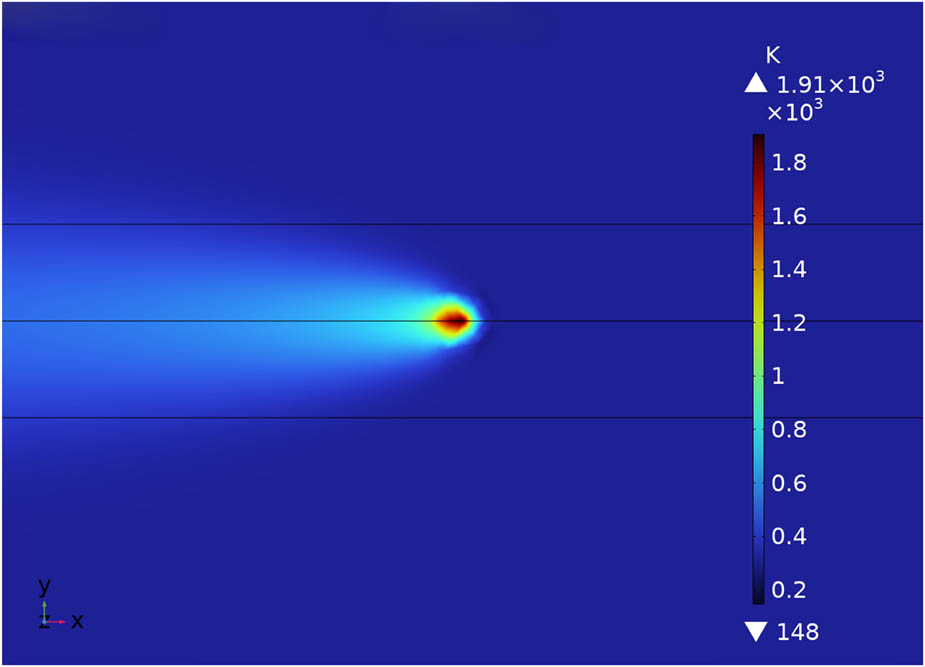
Figure 4
Laser welding macro temperature field.
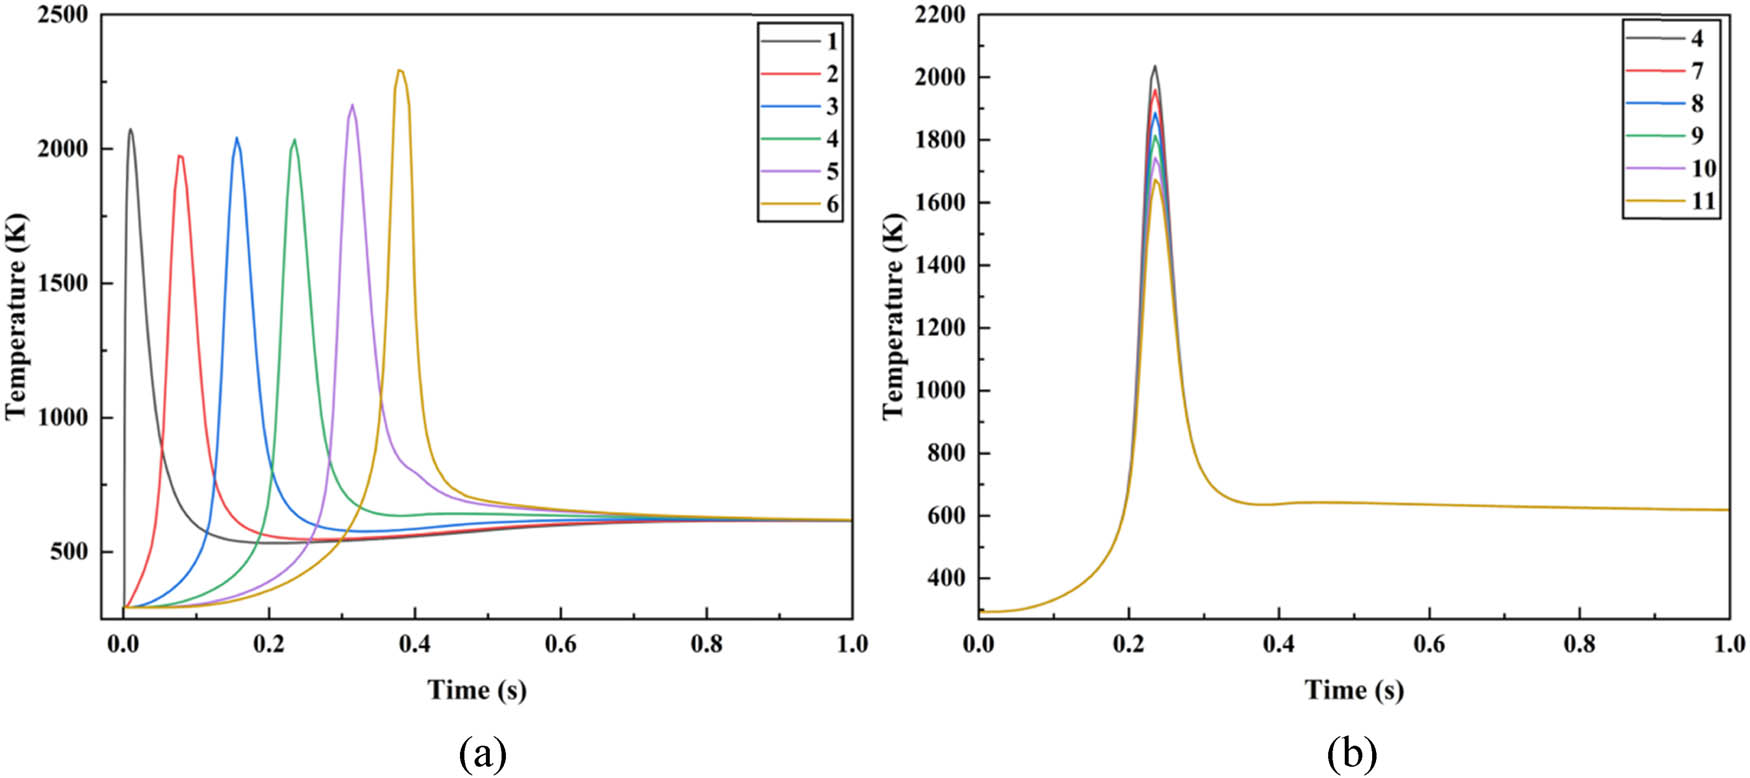
Figure 5
(a) Transverse thermal cycle curve and (b) longitudinal thermal cycle curve.
Table 2
Test factors and level of distribution.
| Level | A. Laser power (W) | B. Welding speed (mm/s) | C. Duty cycle (%) |
|---|---|---|---|
| 1 | 270 | 50 | 50 |
| 2 | 300 | 55 | 55 |
| 3 | 330 | 60 | 60 |
Table 3
Orthogonal test analysis.
| No. | A. laser power (W) | B. Welding speed (mm/s) | C. Duty cycle (%) | Tensile strength (MPa) |
|---|---|---|---|---|
| 1 | 270 | 50 | 50 | 780 |
| 2 | 270 | 55 | 55 | 809 |
| 3 | 270 | 60 | 60 | 817 |
| 4 | 300 | 50 | 55 | 830 |
| 5 | 300 | 55 | 60 | 840 |
| 6 | 300 | 60 | 50 | 810 |
| 7 | 330 | 50 | 60 | 815 |
| 8 | 330 | 55 | 50 | 803 |
| 9 | 330 | 60 | 55 | 846 |
| K 1 | 802 | 808 | 798 | |
| K 2 | 827 | 817 | 828 | |
| K 3 | 821 | 824 | 824 | |
| R | 25 | 16 | 31 | |
| Priority factors | C > A > B | |||
| Optimal solution | 300 | 60 | 55 | 856 |
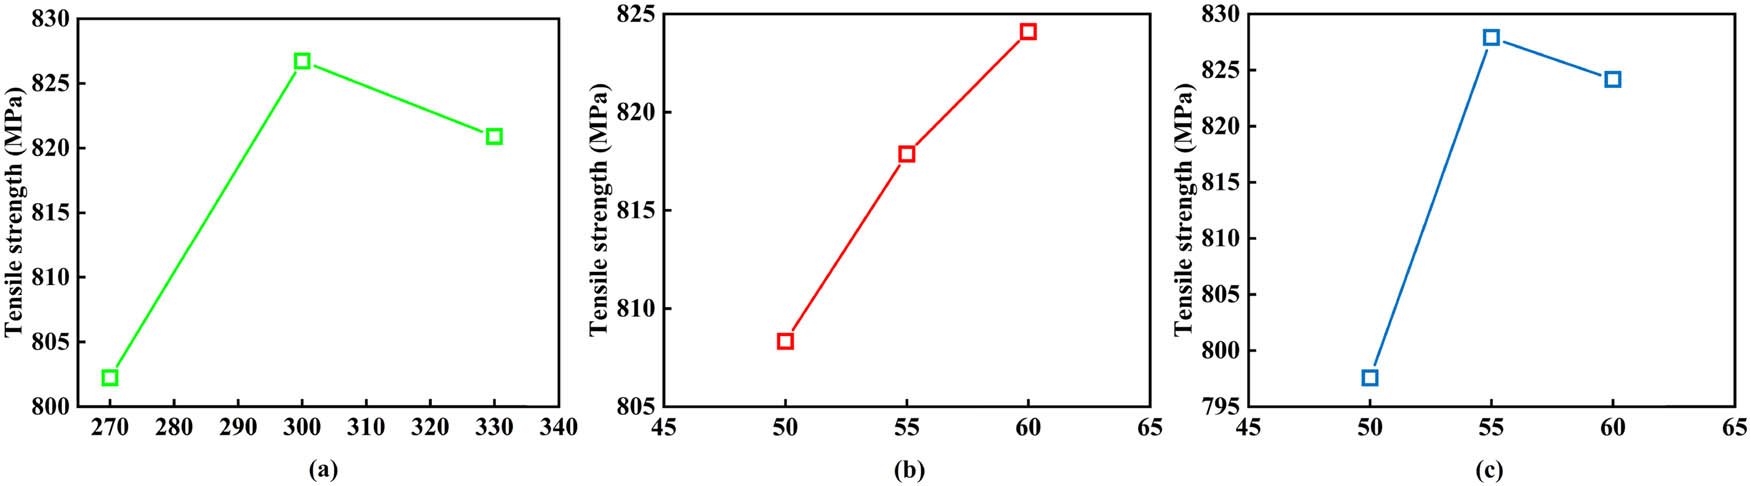
Figure 6
Effect of welding parameters on tensile strength. (a) Laser power (W). (b) Welding speed (mm/s). (c) Duty cycle.
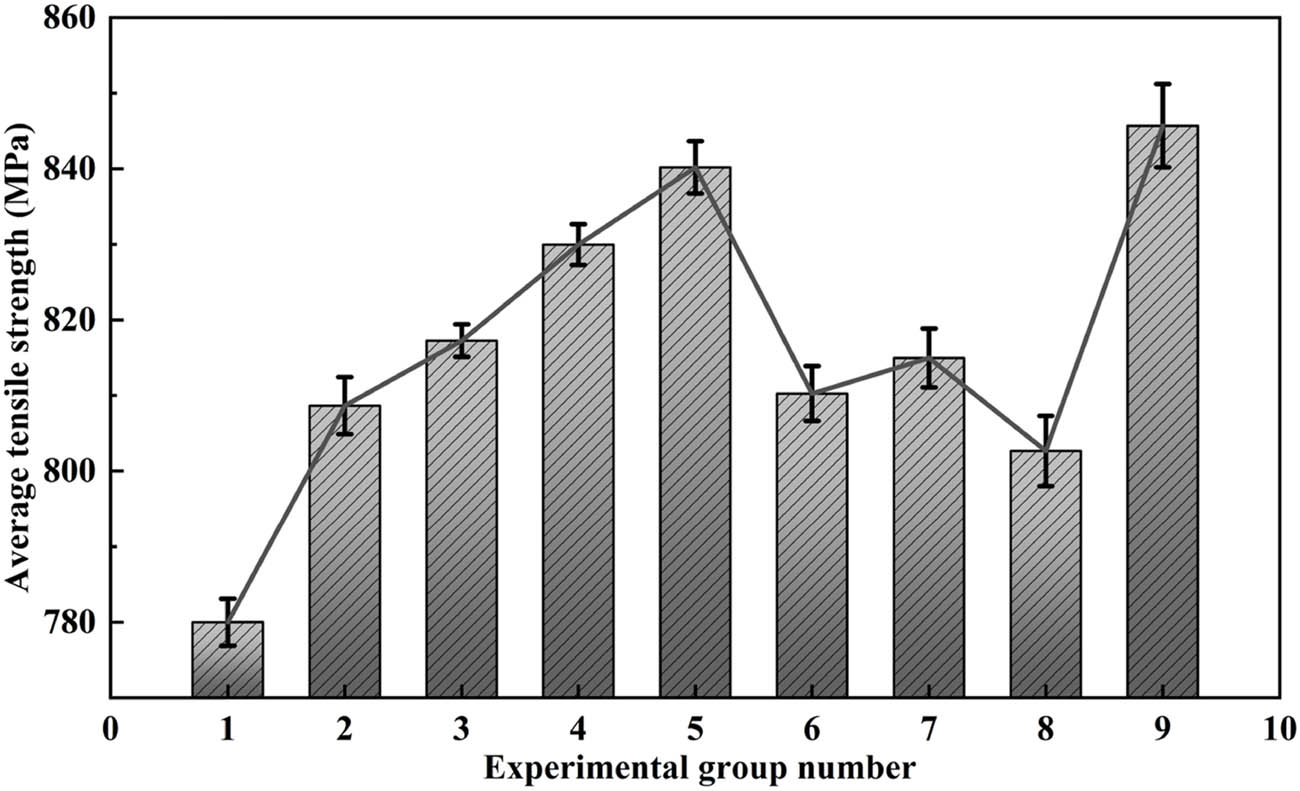
Figure 7
Average tensile strength and ±2SE error bars of nine experimental groups.
Table 4
Macroscopic morphology of weld seam under different duty cycles.
| No. | Duty cycle (%) | Front side | Reverse side |
|---|---|---|---|
| a | 50 |

|

|
| b | 55 |

|

|
| c | 60 |

|

|
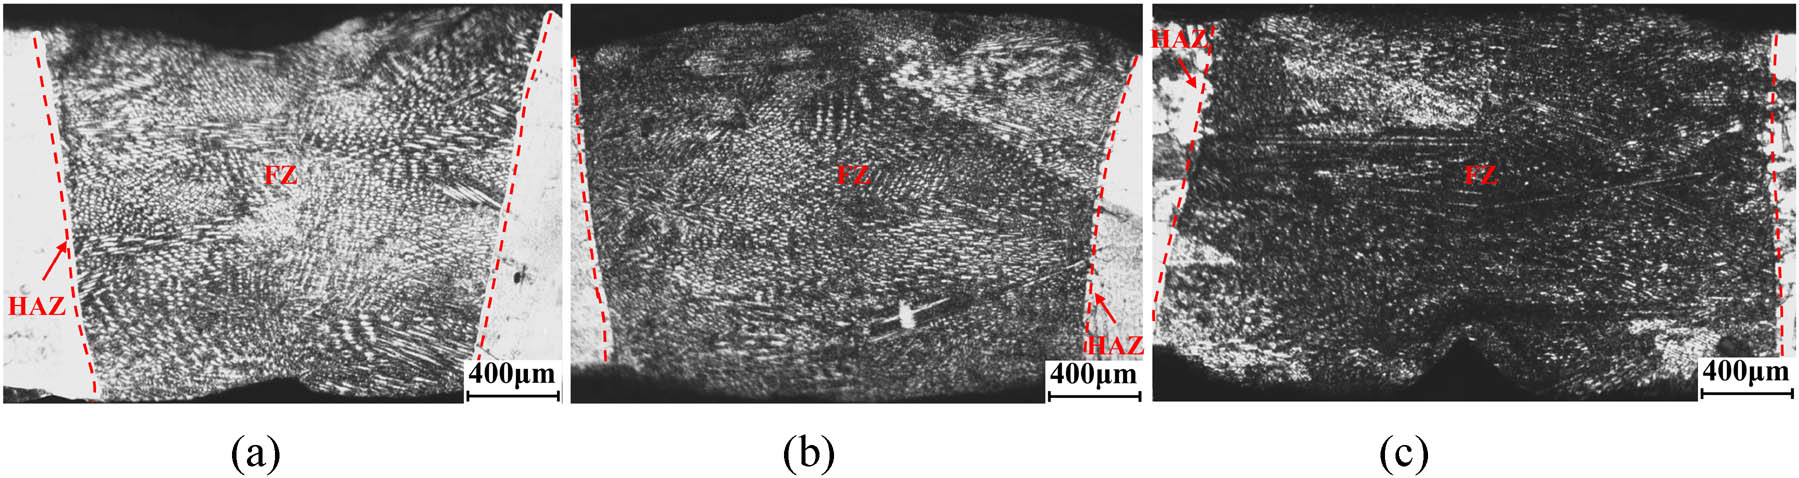
Figure 8
Metallographic section of weld. (a) Duty cycle 50%. (b) Duty cycle 55%. (c) Duty cycle 60%.
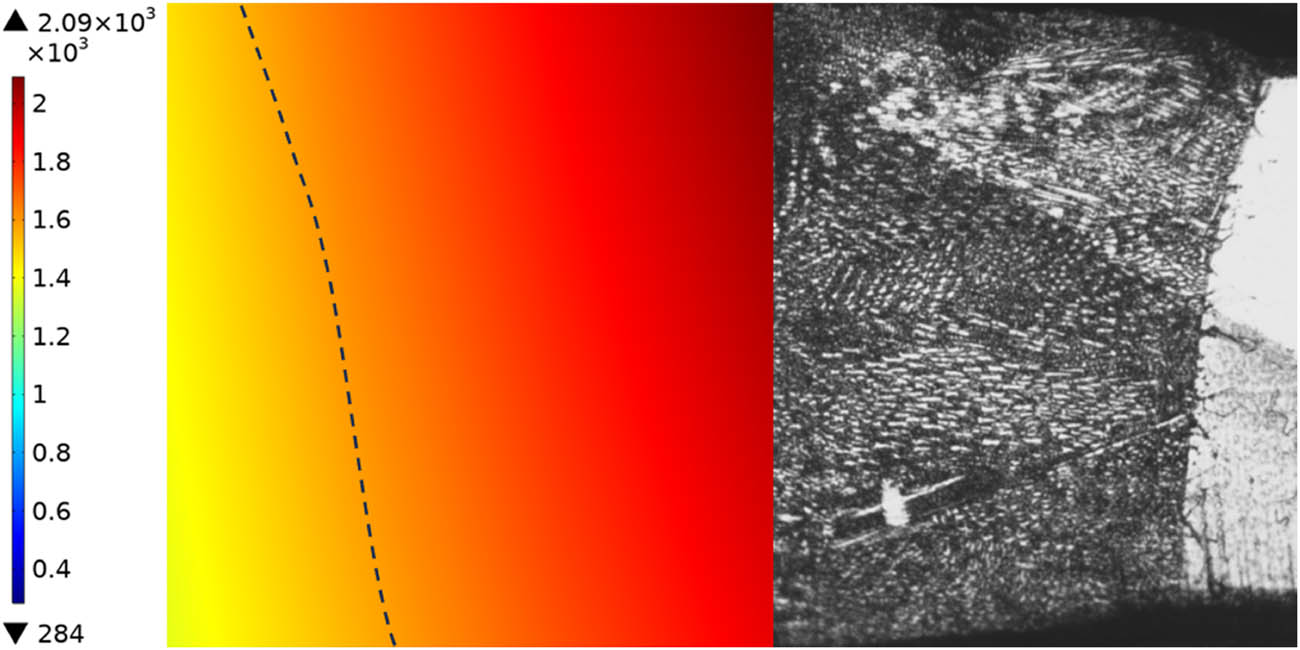
Figure 9
Comparison of metallographic sections with simulation results.
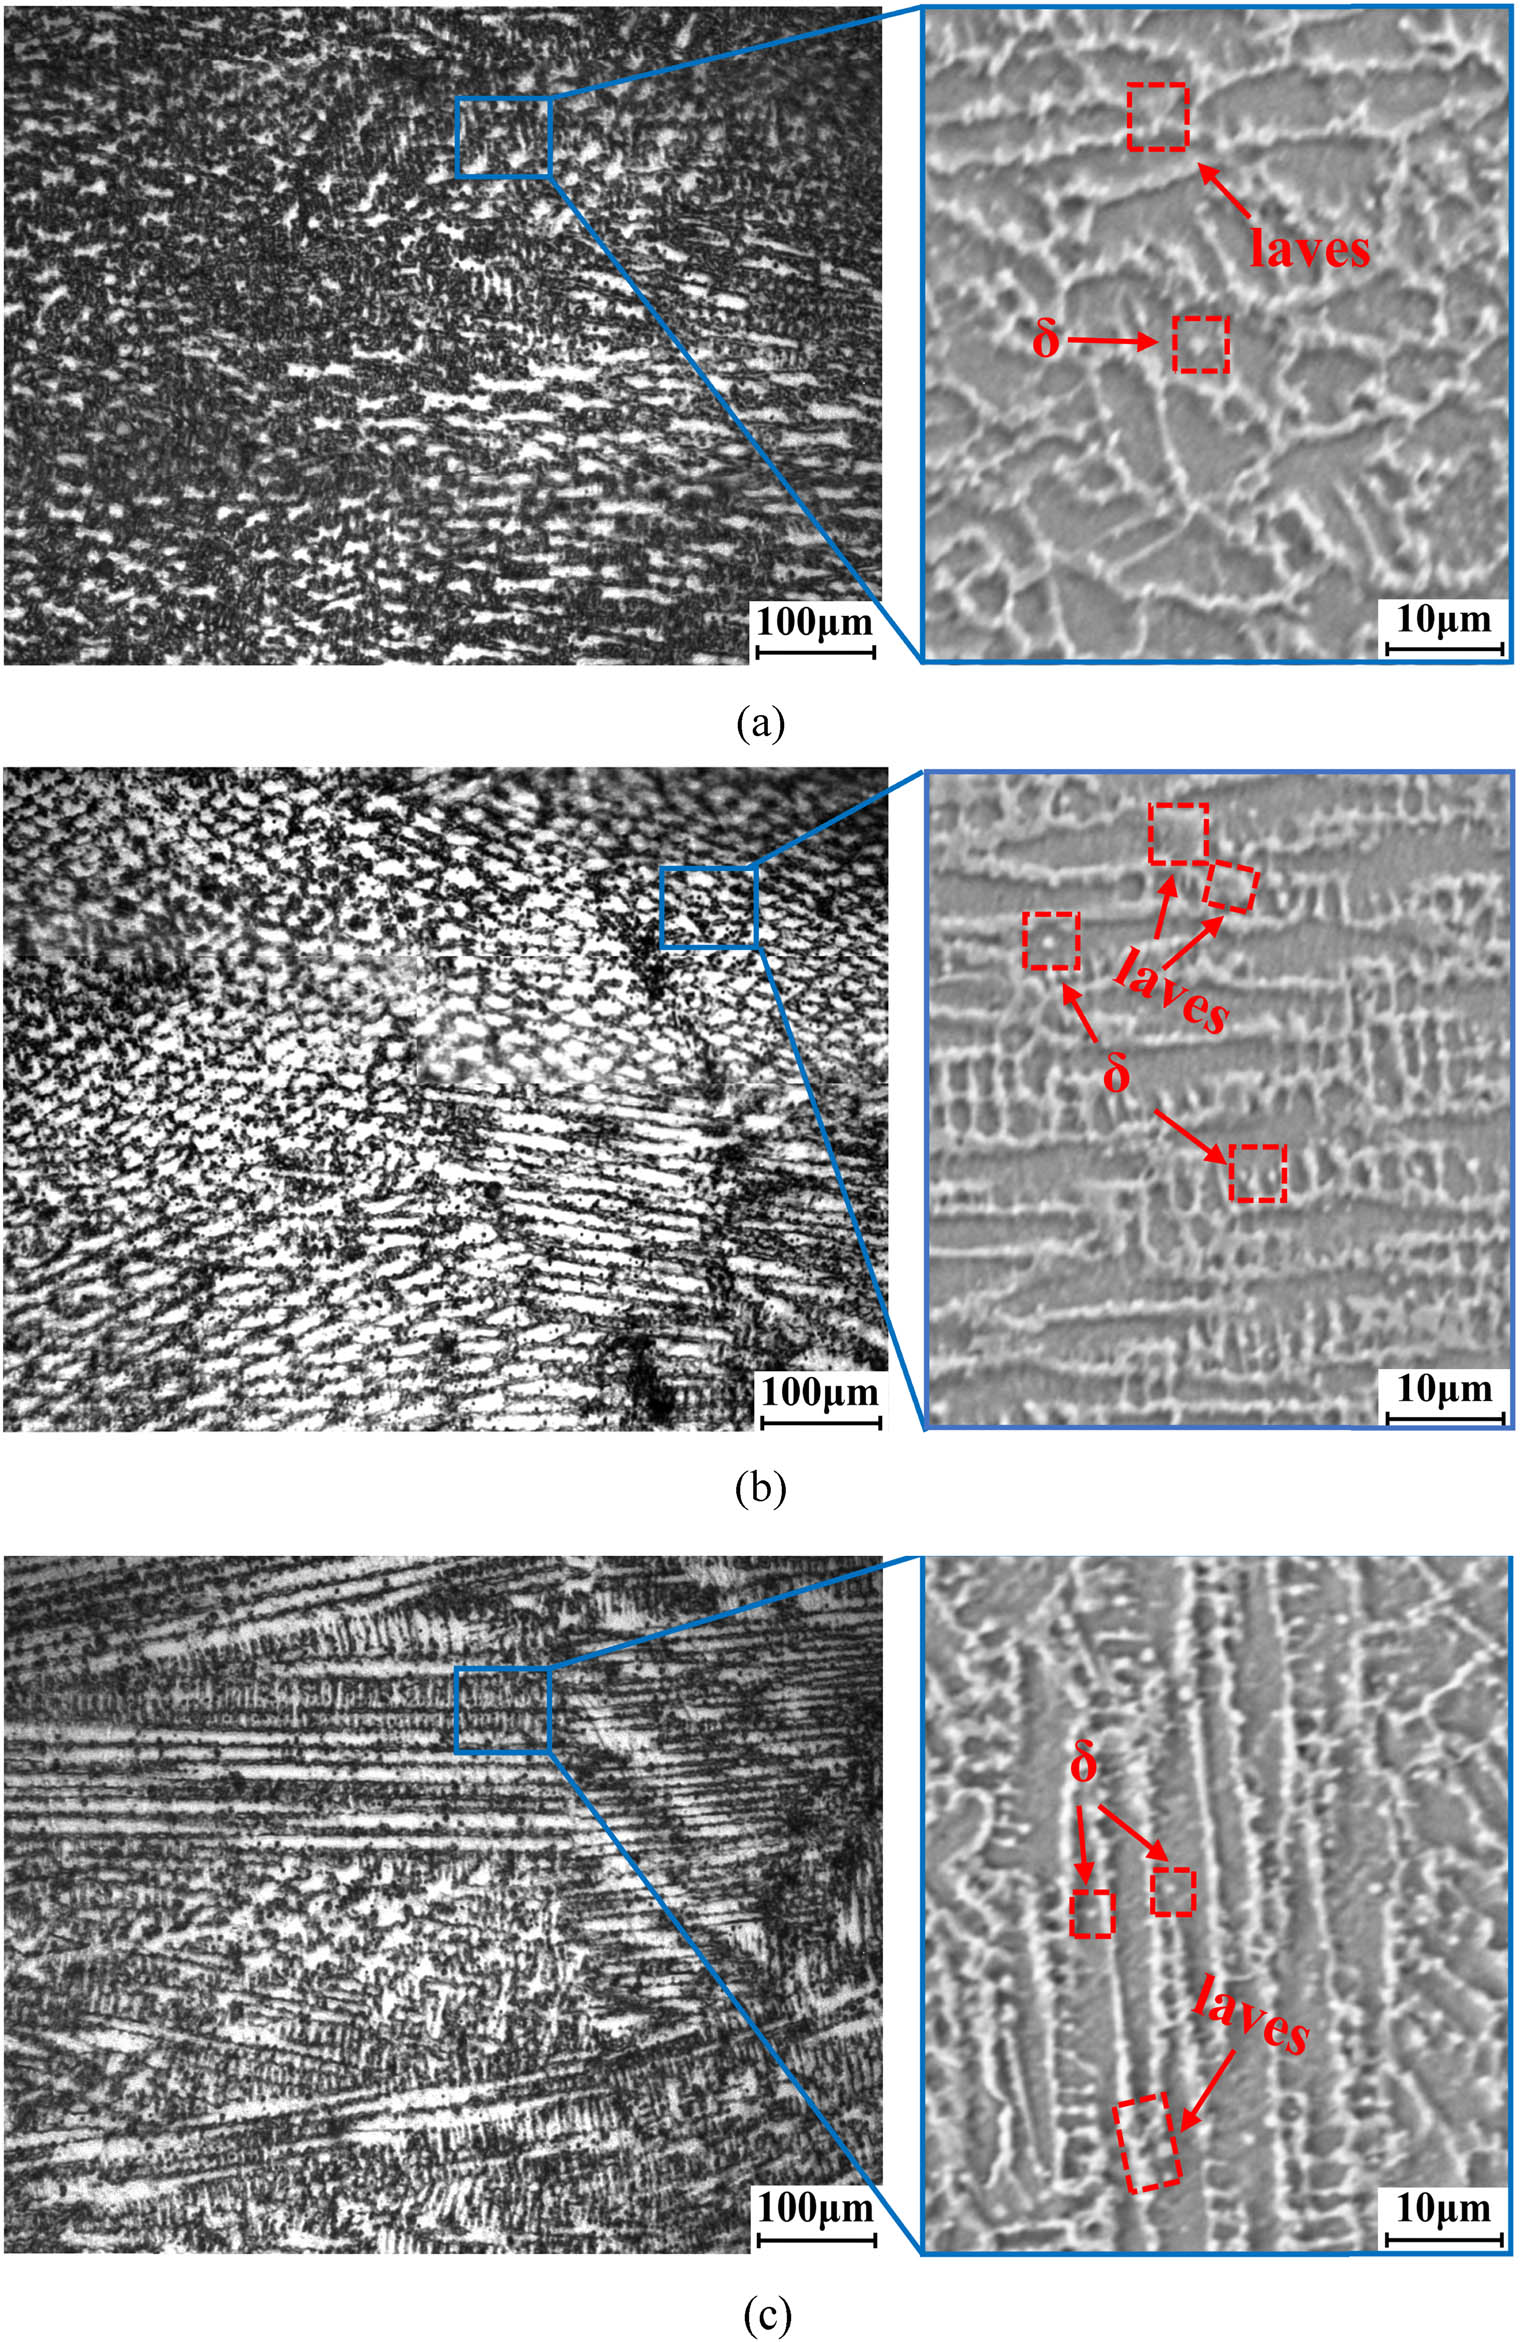
Figure 10
Optical microscopy photo of weld morphology. (a) Duty cycle 50%. (b) Duty cycle 55%. (c) Duty cycle 60%.
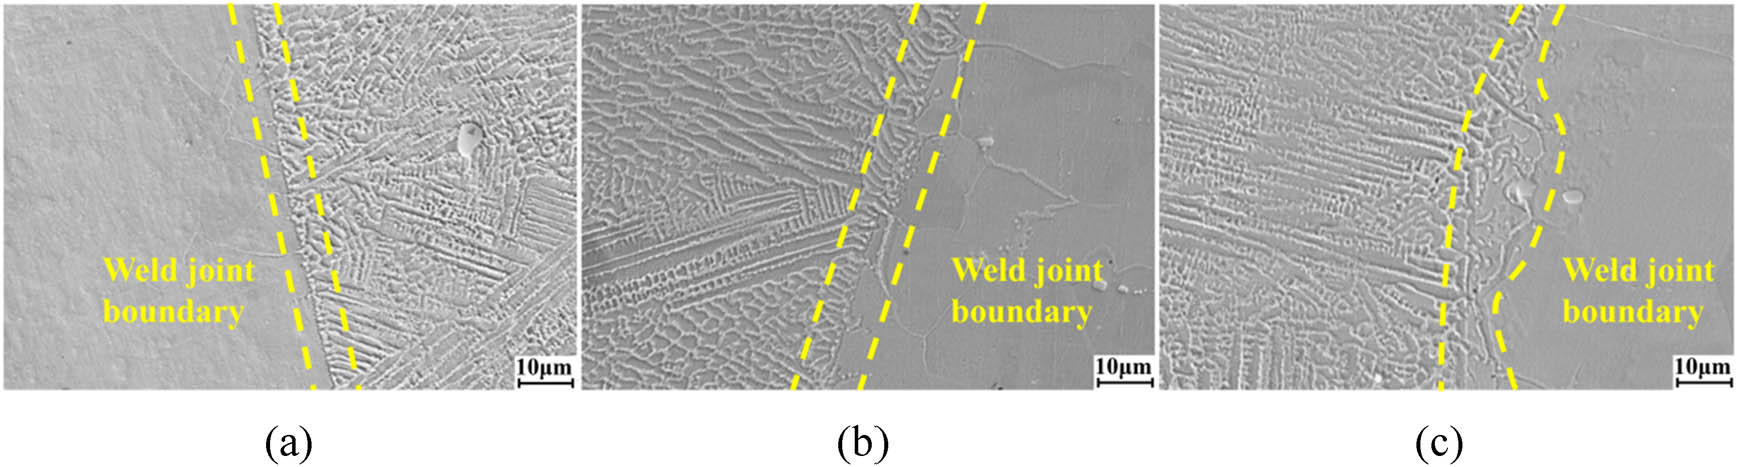
Figure 11
SEM images of welds with different parameters. (a) Duty cycle 50%. (b) Duty cycle 55%. (c) Duty cycle 60%.
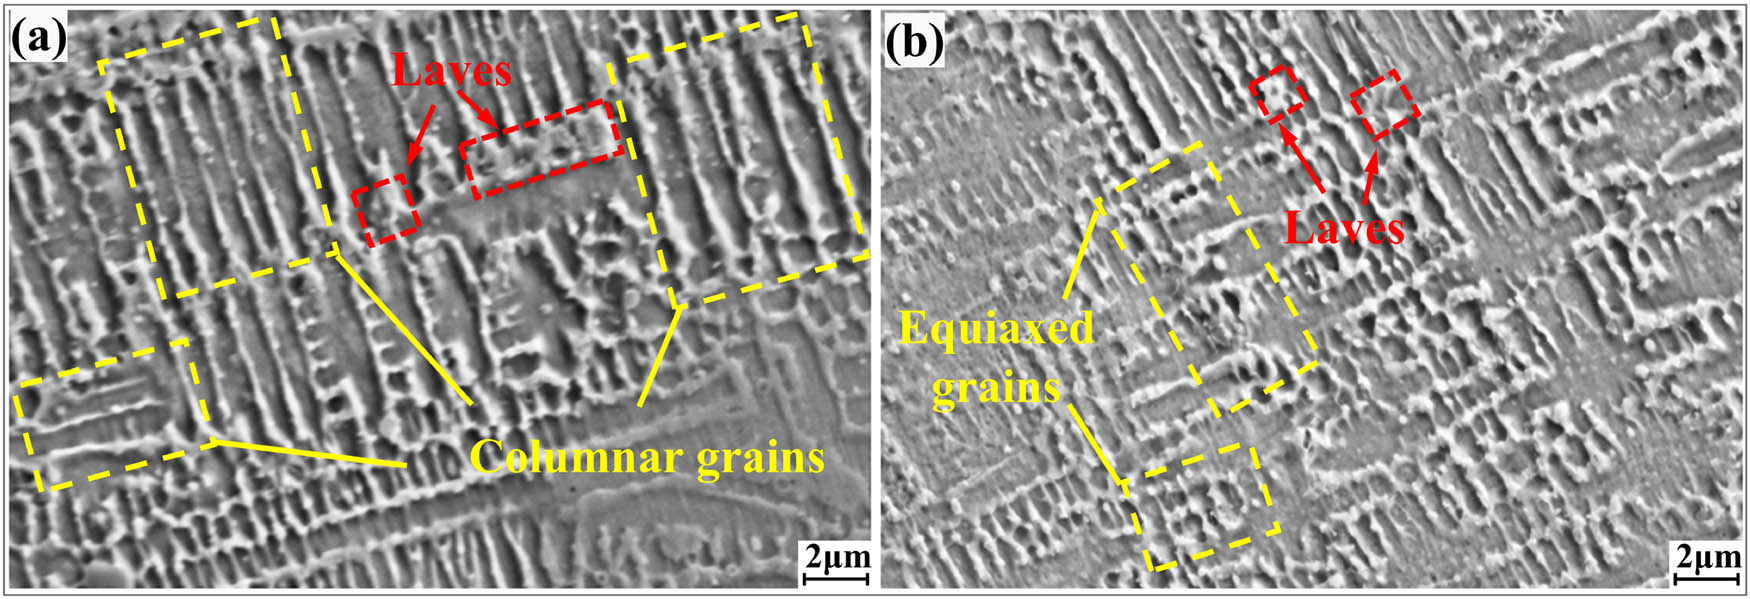
Figure 12
SEM microstructures of the weld FZ: (a) Coarse and interconnected Laves particles near the fusion boundary and (b) fine and dispersed Laves particles in the weld center.
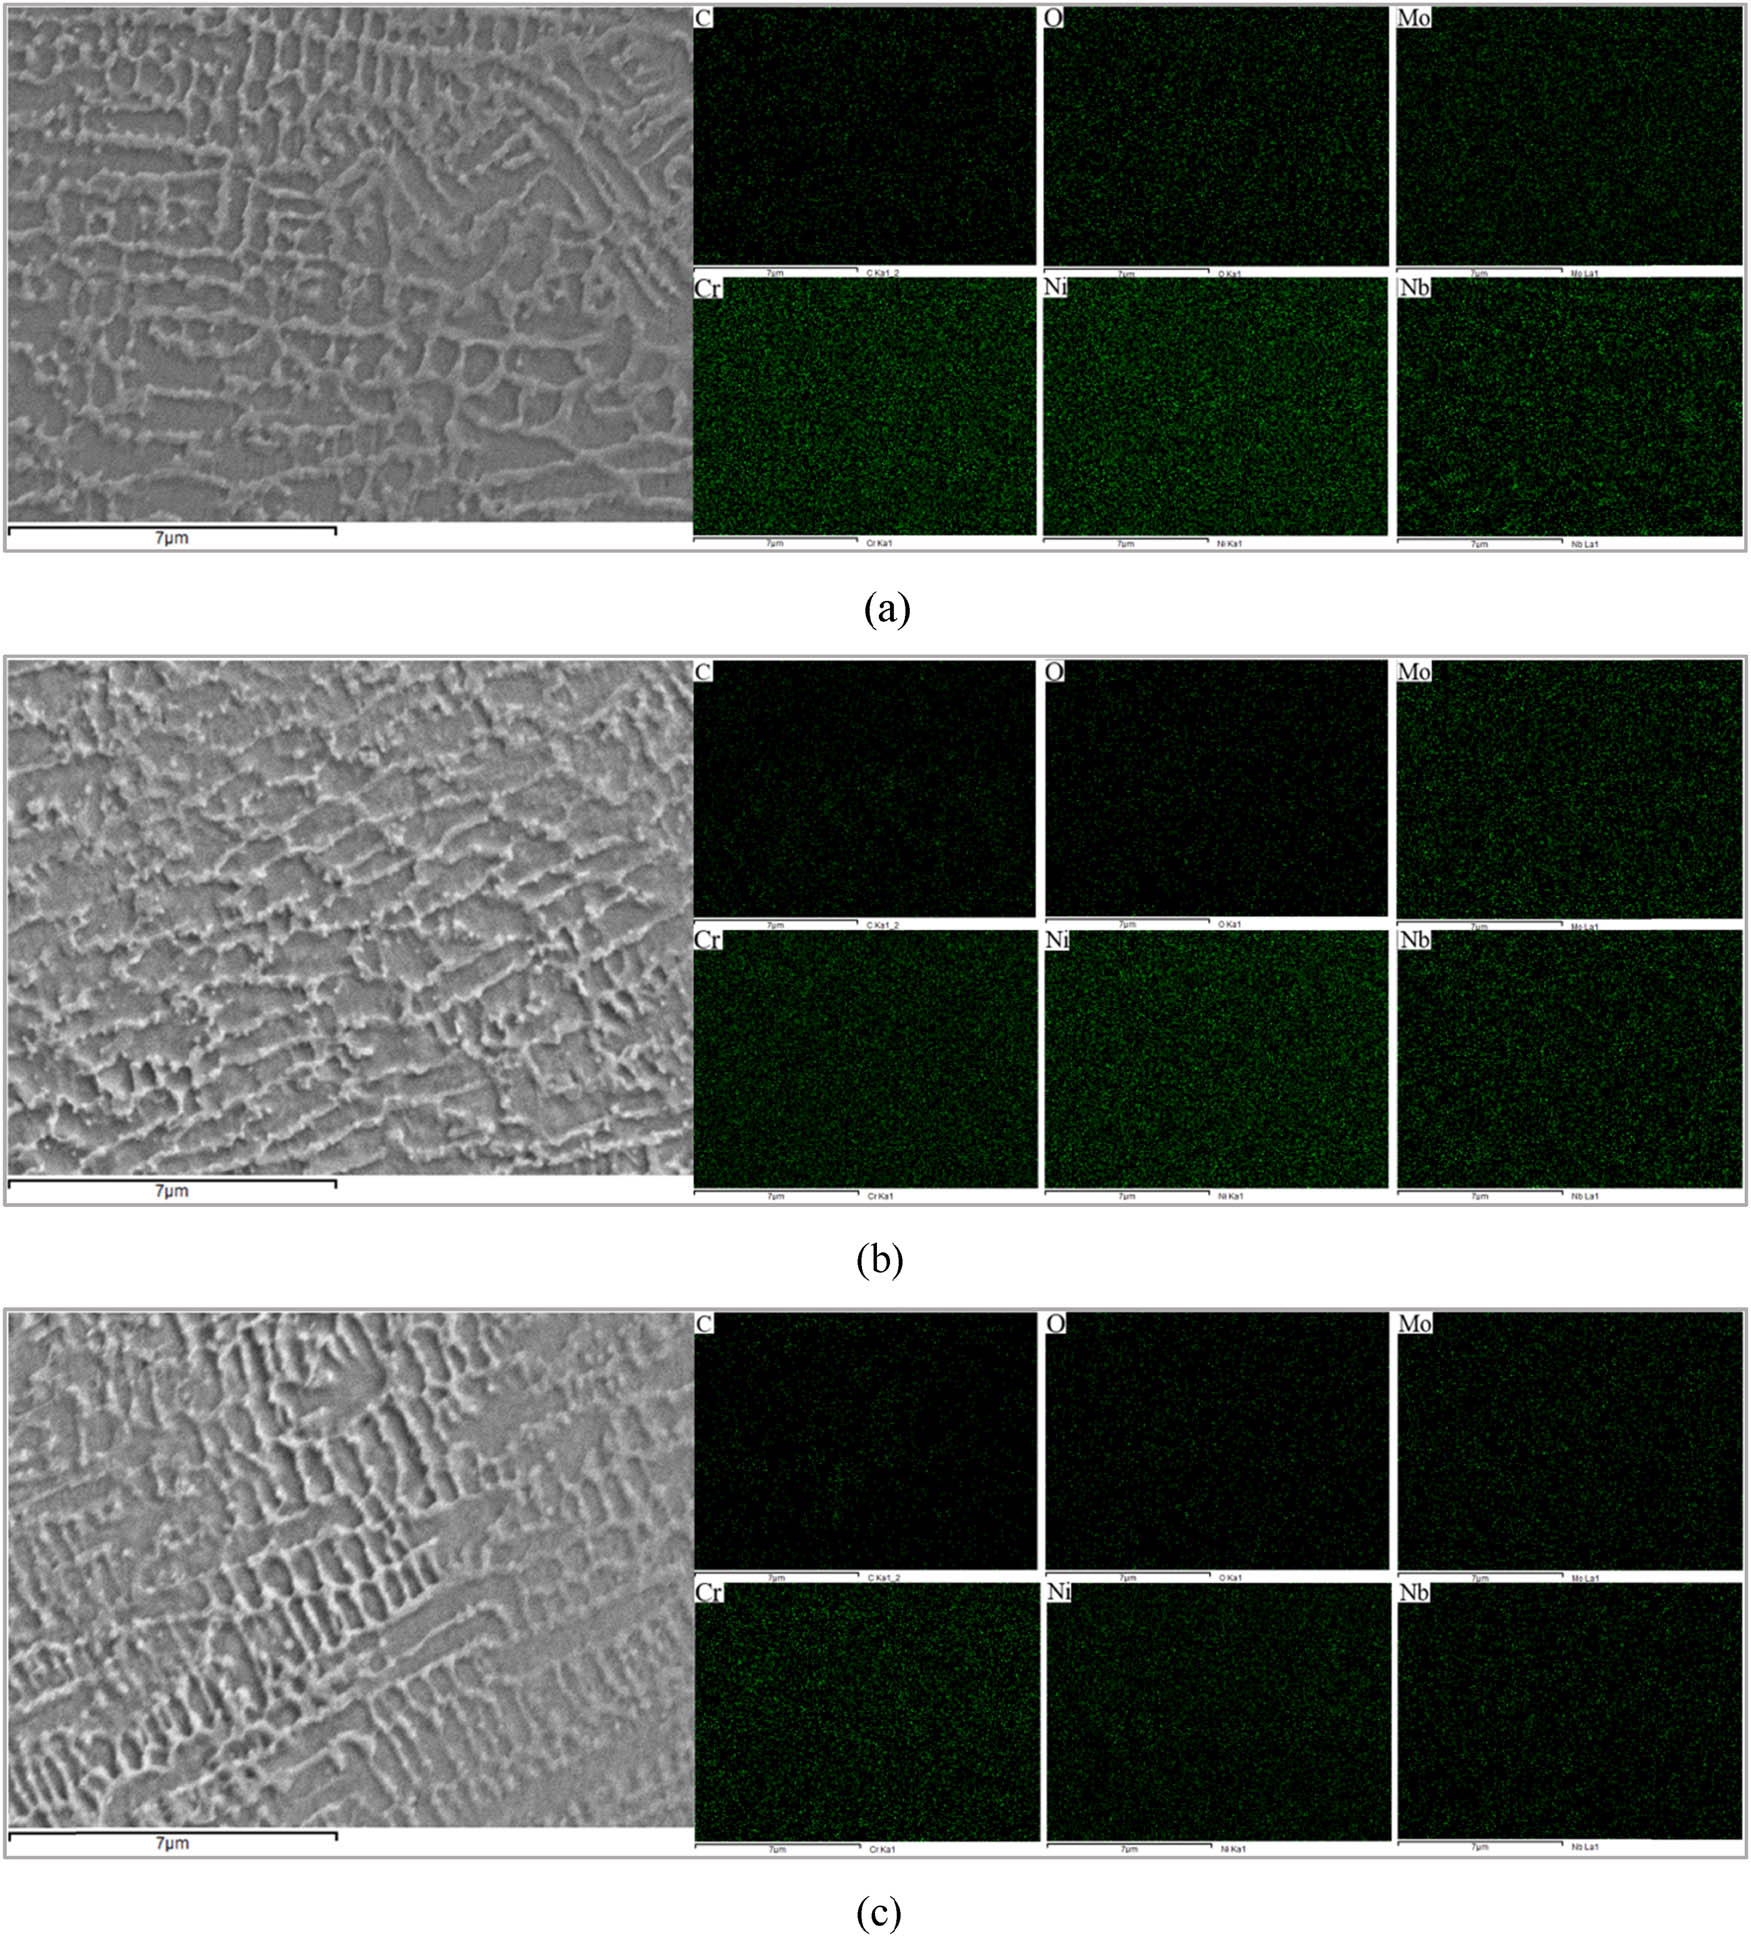
Figure 13
SEM–EDS mapping of different positions of the weld seam. (a) EDS mapping of the weld top region. (b) EDS mapping of the weld middle region. (c) EDS mapping of the weld bottom region.
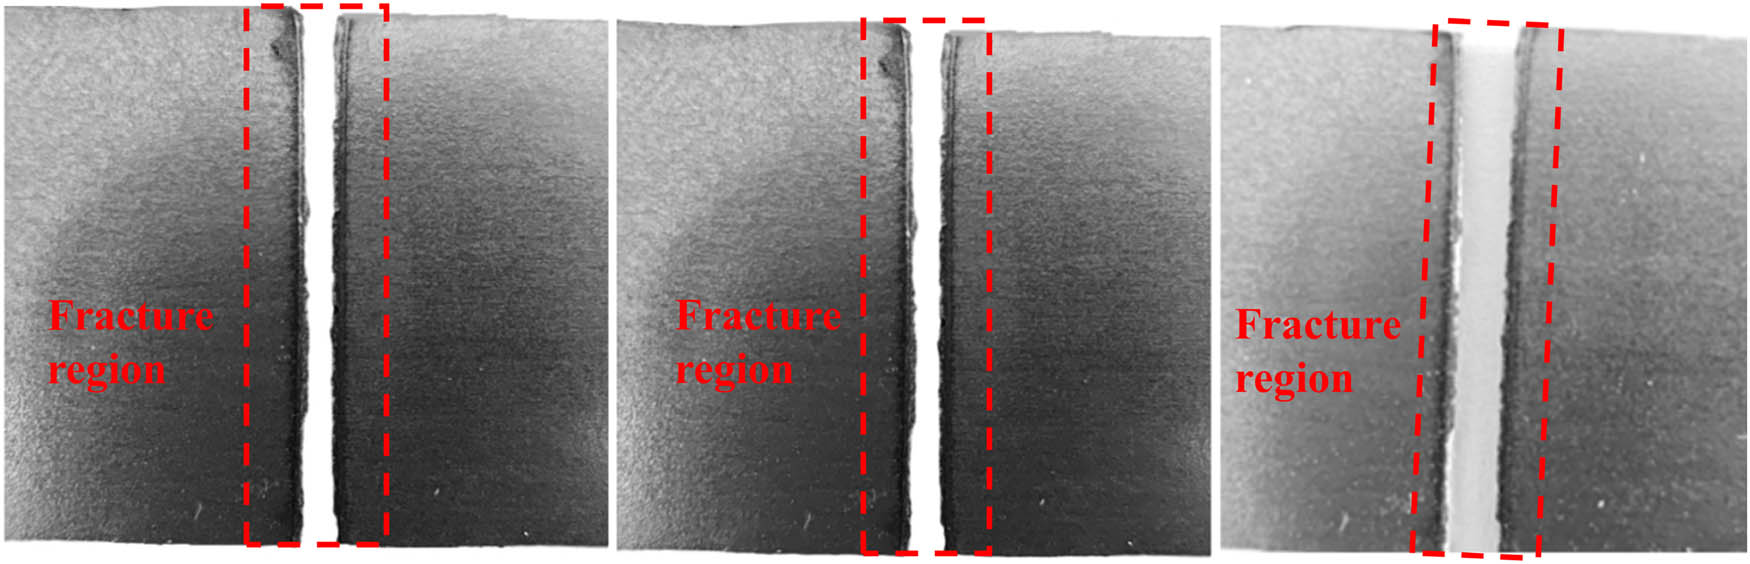
Figure 14
Macroscopic location of fracture of a partially tensile specimen.
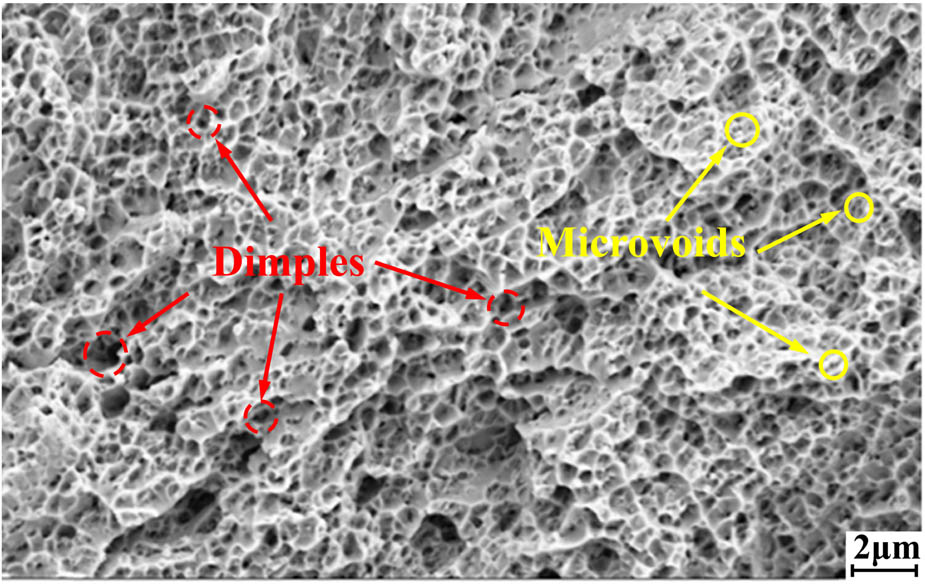
Figure 15
SEM morphology of tensile specimen fracture.