Figure 1
Figure 2
Figure 3
Figure 4
Figure 5
Figure 6
Figure 7
Figure 8
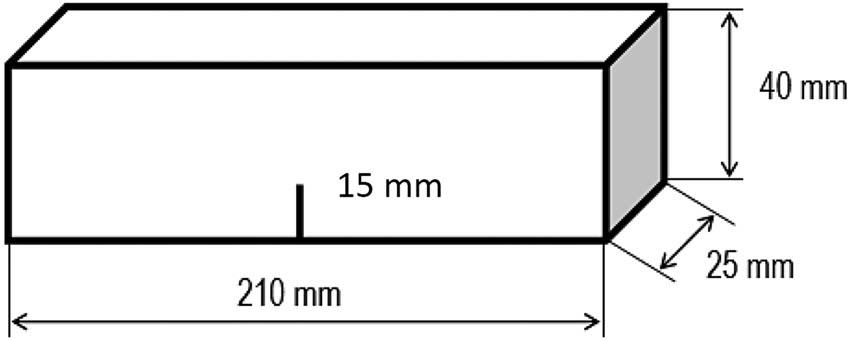
Figure 9
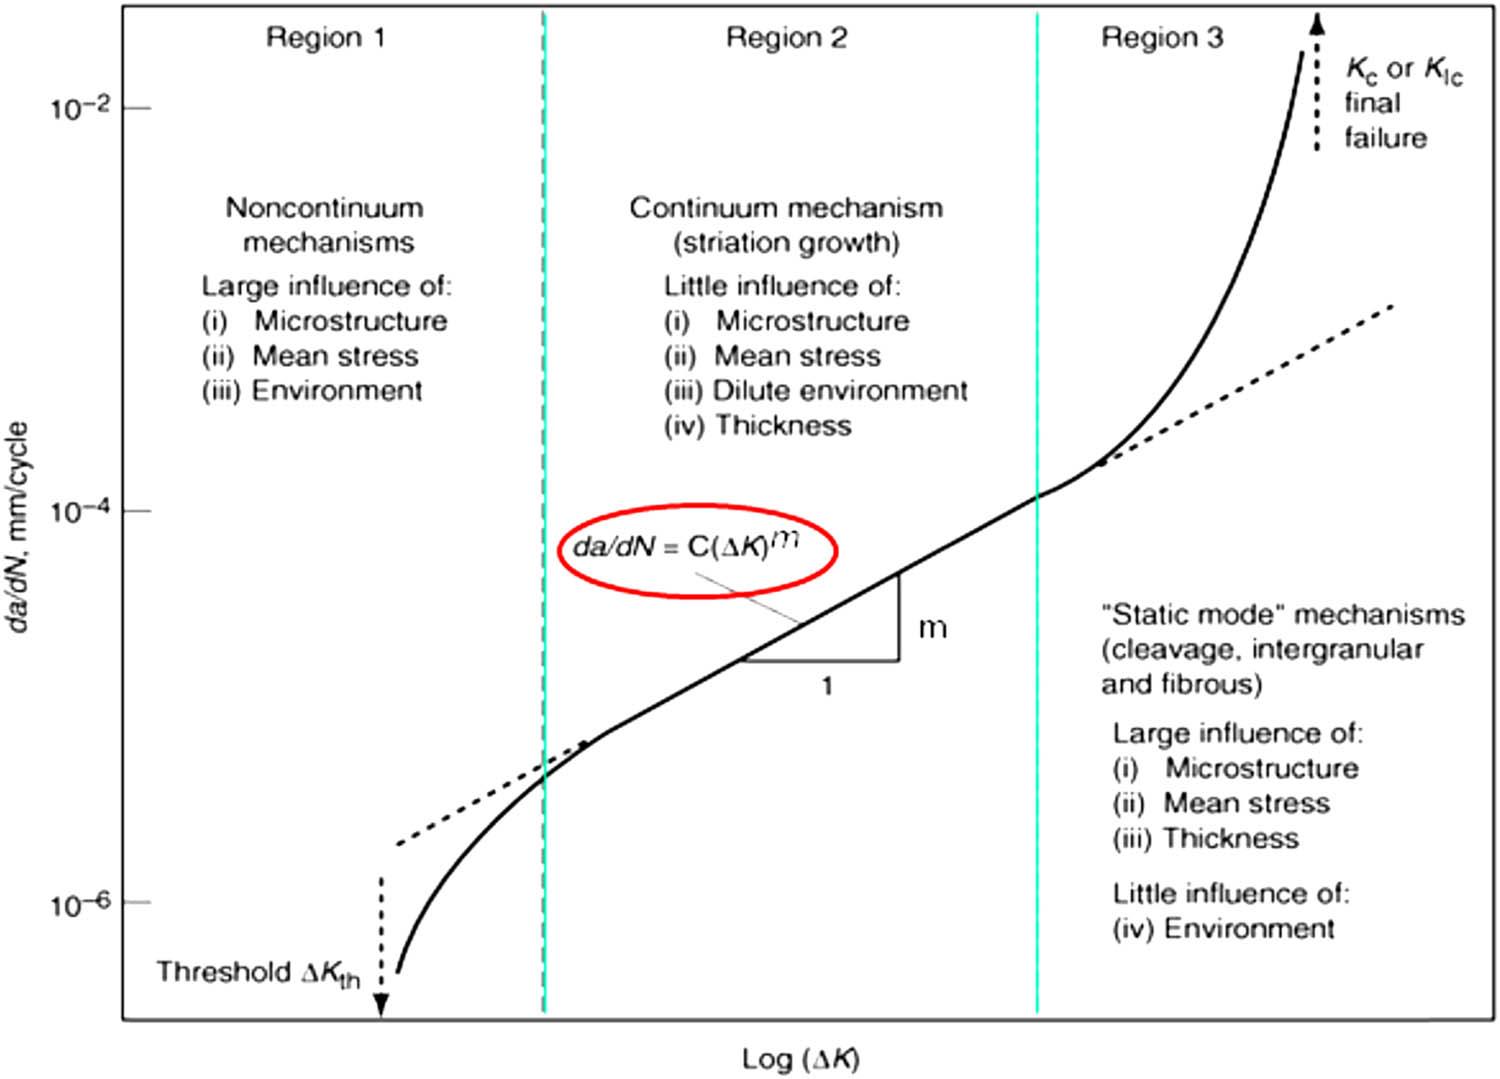
Figure 10
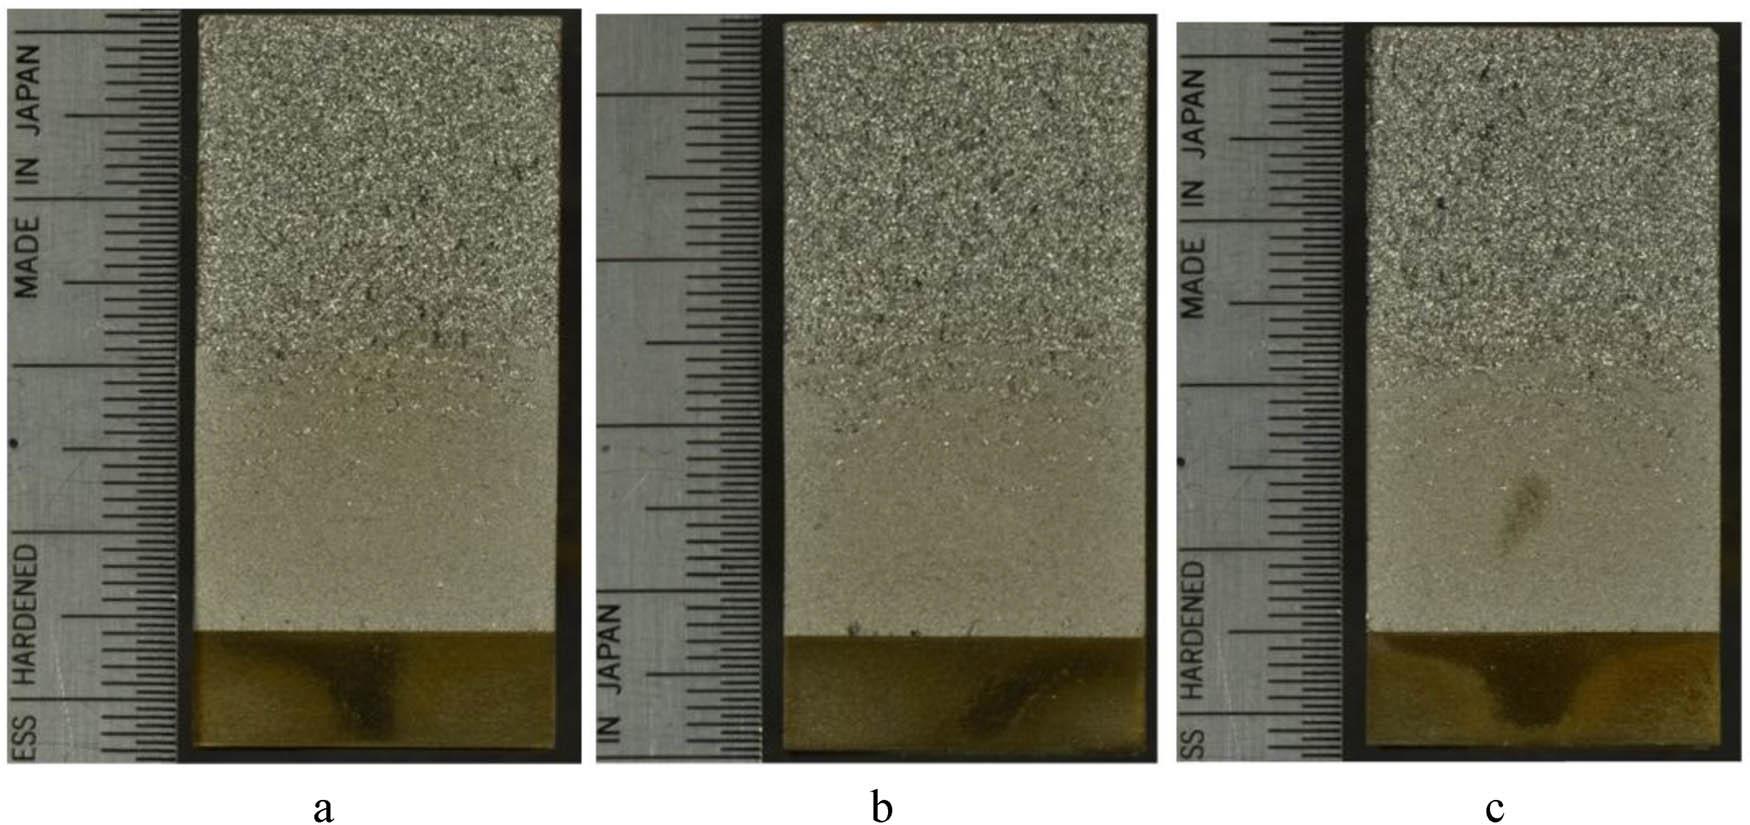
Figure 11
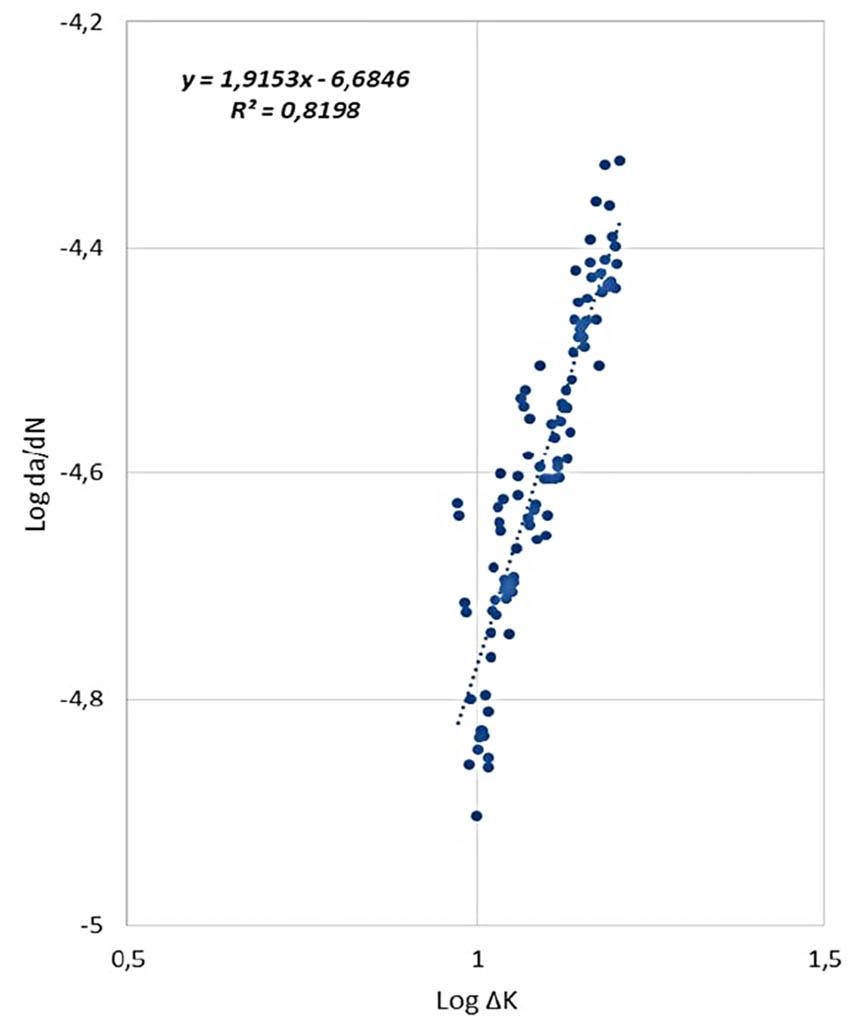
Figure 12
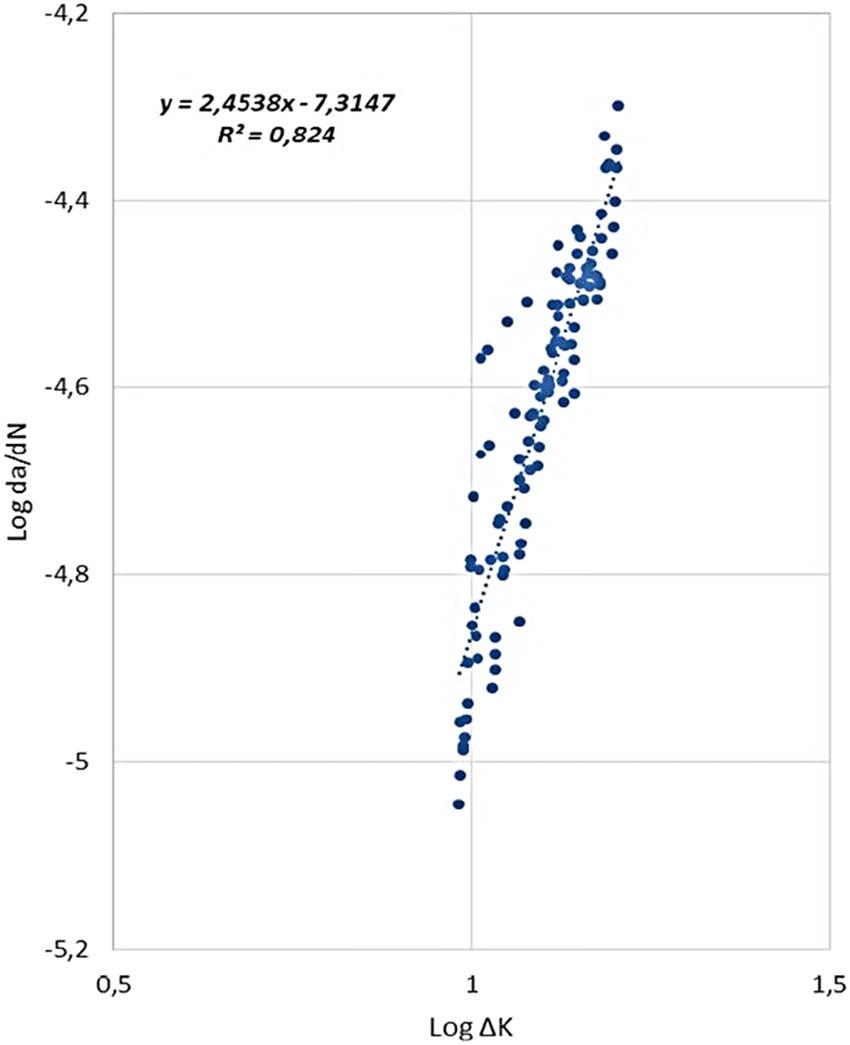
Figure 13
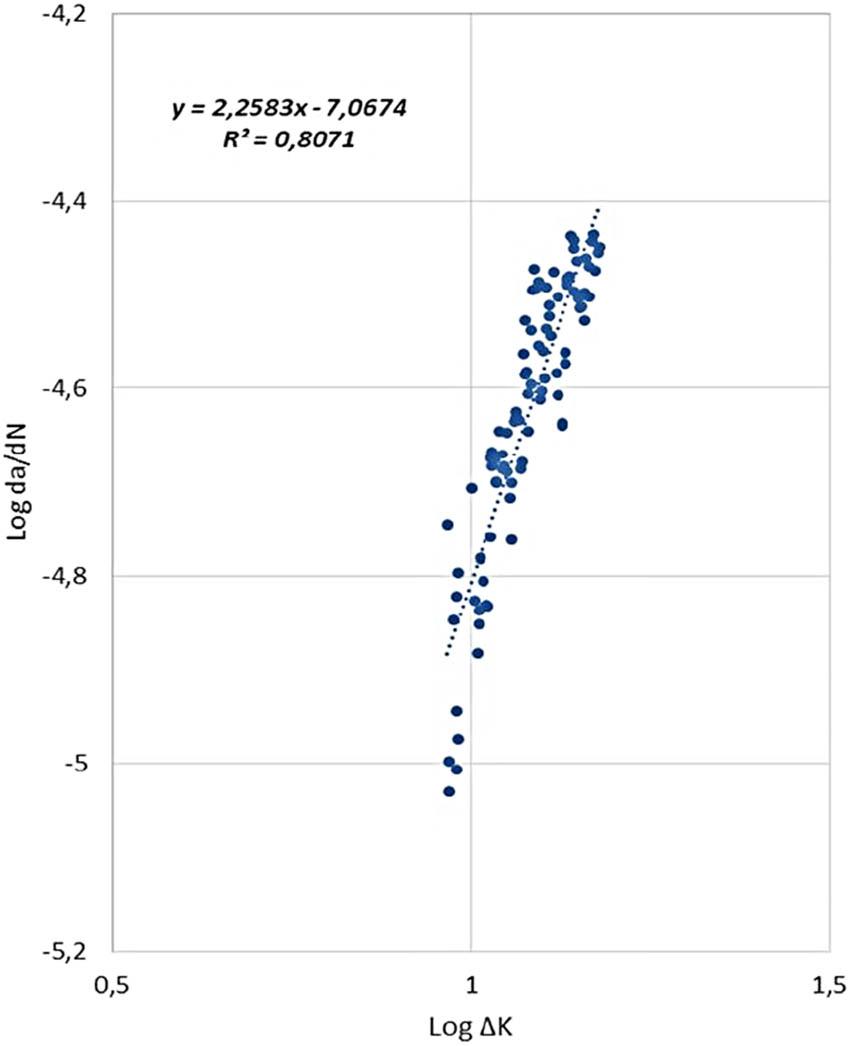
Figure 14
Figure 15
Chemical composition for individual melts_
| Number | Mass in liquid state (%) | 10−4 % (ppm) | ||||||||||
|---|---|---|---|---|---|---|---|---|---|---|---|---|
| of samples | of melts | C | Mn | Si | P | S | Cr | Al max | V max | N max | O max | H max |
| 1 | 321,036 | 0.79 | 1.09 | 0.36 | 0.008 | 0.017 | 0.069 | 0.004 | 0.001 | 0.0056 | 18 | 2.00 |
| 2 | 321,037 | 0.77 | 1.07 | 0.35 | 0.008 | 0.017 | 0.077 | 0.004 | 0.001 | 0.0055 | 18 | 1.83 |
| 3 | 321,038 | 0.77 | 1.08 | 0.39 | 0.009 | 0.014 | 0.076 | 0.004 | 0.001 | 0.0054 | 18 | 1.29 |
| 4 | 331,713 | 0.78 | 1.12 | 0.37 | 0.016 | 0.017 | 0.078 | 0.004 | 0.003 | 0.0050 | 18 | 1.50 |
| 5 | 331,823 | 0.77 | 1.10 | 0.38 | 0.012 | 0.012 | 0.08 | 0.003 | 0.002 | 0.0040 | 14 | 1.3 |
| 6 | 331,824 | 0.78 | 1.13 | 0.38 | 0.011 | 0.019 | 0.08 | 0.003 | 0.002 | 0.0049 | 20 | 1.1 |
| 7 | 331,991 | 0.79 | 1.13 | 0.36 | 0.012 | 0.011 | 0.08 | 0.003 | 0.002 | 0.0043 | 19 | 1.4 |
Basic range of chemical composition and mechanical properties of rail steel grades for heat treatment_
| Steel grade | Mass (%) | R m (MPa) | A (%) | Hardness (HBW) | |||||
|---|---|---|---|---|---|---|---|---|---|
| C | Si | Mn | P max | S max | Cr | ||||
| R260 | 0.60–0.82 | 0.13–0.60 | 0.65–1.25 | 0.030 | 0.030 | ≤0.15 | 880 | 10 | 260–300 |
| R350HT | 0.70–0.82 | 0.13–0.60 | 0.65–1.25 | 0.025 | 0.030 | ≤0.15 | 1,175 | 9 | 350–390 |
| R350LHT | 0.70–0.82 | 0.13–0.60 | 0.65–1.25 | 0.025 | 0.030 | ≤0.30 | 1,175 | 9 | 350–390 |
| R370CrHT | 0.68–0.84 | 0.38–1.02 | 0.65–1.15 | 0.025 | 0.025 | 0.35–0.65 | 1,280 | 9 | 370–410 |
| R400HT | 0.88–1.07 | 0.18–0.62 | 0.95–1.35 | 0.025 | 0.025 | ≤0.30 | 1,280 | 8 | 400–440 |
Conditions for determining the fatigue crack growth rate_
| Fatigue crack growth rate | |||
|---|---|---|---|
| Sample no. | 2a | 2b | 2c |
| Load rate R | 0.5 | 0.5 | 0.5 |
| Amplitude type | Sinusoidal | Sinusoidal | Sinusoidal |
| Load frequency (Hz) | 15 | 15 | 15 |
| Initial ΔK (MPa m1/2) | 9.32 | 9.39 | 9.27 |
| Initial K max (MPa m1/2) | 18.64 | 18.78 | 18.54 |
| Initial ΔP (kN) | 6605.00 | 6600.00 | 6608.00 |
| Final crack length (mm) | 27.26 | 26.93 | 27.75 |
| Temperature (°C) | Room temp. | Room temp. | Room temp. |
| Measurement of the crack front | |||
| Average a (mm) | 25.24 | 24.47 | 24.69 |
| Standard deviation (mm) | 1.0041 | 1.1314 | 0.3606 |
| Paris’ law (da/dN) = C(ΔK) m | |||
| C | 2.0673 × 10⁷ | 4.8451 × 10⁸ | 8.5625 × 10⁸ |
| m | 1.92 | 2.45 | 2.26 |
| R m (MPa) | 1,292 | ||
| R p0,2 (MPa) | 894 | ||
Condition check P max/P Q ≤ 1_1_
| Sample | P Q (N) | P max (N) | P max/P Q |
|---|---|---|---|
| 3a | 17,810 | 18,344 | 1.03 |
| 3b | 18,390 | 18,574 | 1.01 |
| 3c | 17,240 | 18,274 | 1.06 |
| 3d | 18,560 | 18,746 | 1.01 |
| 3e | 18,560 | 18,746 | 1.01 |
Fatigue strength test results_
| Sample no. | Amplitude | Force (kN) | Result |
|---|---|---|---|
| 1a | 0.00135 | 10.78 | No cracks |
| 1b | 0.00135 | 10.88 | No cracks |
| 1c | 0.00135 | 10.75 | No cracks |
| 2a | 0.00135 | 10.83 | No cracks |
| 2b | 0.00135 | 10.83 | No cracks |
| 2c | 0.00135 | 10.88 | No cracks |
| 3a | 0.00135 | 10.83 | No cracks |
| 3b | 0.00135 | 10.76 | No cracks |
| 3c | 0.00135 | 10.57 | No cracks |
Checking the validity criterion K Ic_
| Sample | Check the conditions | |
|---|---|---|
|
a ≥ 2.5 |
B ≥ 2.5 | |
| Steel – R350HT | ||
| 3a | 0.01981 > −0.0079 | 0.02498 > −0.0079 |
| 3b | 0.01983 > −0.0084 | 0.02502 > −0.0084 |
| 3c | 0.01991 > −0.0073 | 0.02498 > −0.0073 |
| 3d | 0.02011 > −0.0088 | 0.02505 > −0.0088 |
| 3e | 0.01993 > −0.0087 | 0.02496 > −0.0087 |
Validity check K Ic_
| Sample | Check the conditions |
|---|---|
| (W – a) > 2.5 | |
| Steel – R350HT | |
| 3a | 0.02013 > −0.0079 |
| 3b | 0.02020 > −0.0084 |
| 3c | 0.02017 > −0.0073 |
| 3d | 0.01993 > −0.0088 |
| 3e | 0.02003 > −0.0087 |
Results of determining the stress intensity factor_
| Sample no. | K Ic (MPa m1/2) | Average value K Ic (MPa m1/2) | Standard deviation K Ic (MPa m1/2) |
|---|---|---|---|
| 3a | 39.20 | 39.86 | 1.50 |
| 3b | 40.27 | ||
| 3c | 37.59 | ||
| 3d | 41.27 | ||
| 3e | 40.39 | ||
| 2a | 39.95 | 40.12 | 1.09 |
| 2b | 40.77 | ||
| 2c | 40.38 | ||
| 2 d | 38.35 | ||
| 2e | 41.16 | ||
| 1a | 46.24 | 42.97 | 2.70 |
| 1b | 45.36 | ||
| 1c | 40.32 | ||
| 1d | 40.67 | ||
| 1e | 42.28 | ||
| Requirements according to EN13674-1 for the R350HT grade | Single min. value 30 MPa m1/2 | Average value min 32 MPa m1/2 |
Results of testing the fatigue crack growth rate_
| Sample no. | da/dN = C (ΔK) m | Indicator m/Gc ΔK = 10, MPa m1/2 | Indicator m/Gc ΔK = 13.5, MPa m1/2 | |
|---|---|---|---|---|
| C | m | |||
| 2a | 2.0673 × 10⁷ | 1.9153 | 17.00 | 30.22 |
| 2b | 4.8851 × 10⁸ | 2.4538 | 13.78 | 28.77 |
| 2c | 8.5625 × 10⁸ | 2.2583 | 15.52 | 30.57 |
| 1a | 1.4207 × 10⁷ | 1.9498 | 12.66 | 22.72 |
| 1b | 1.1649 × 10⁷ | 2.0288 | 12.45 | 22.88 |
| 1c | 2.8016 × 10⁷ | 1.6677 | 13.03 | 21.50 |
| 4a | 1.3571 × 10⁷ | 2.1066 | 17.00 | 32.64 |
| 4b | 1.4220 × 10⁷ | 2.0735 | 16.84 | 31.38 |
| 4c | 1.4038 × 10⁷ | 2.0718 | 16.56 | 30.84 |
| Requirements of the EN13674-1 standard | Max 17 m/Gc | Max 55 m/Gc | ||
Validation requirements for 321038 A101 rail (samples 3)_
| Determining K Ic | ||||||
|---|---|---|---|---|---|---|
| Sample no. | 3a | 3b | 3c | 3d | 3e | |
| R m (MPa) | 1,331 | |||||
| R p0.2 (MPa) | 696 | |||||
| Test temperature (°C) | −20 | −20 | −20 | −20 | −20 | |
| P max (kN) | 18.3443 | 18.5739 | 18.2744 | 18.7456 | 18.7456 | |
| P Q (kN) | 17.81 | 18.39 | 17.24 | 18.54 | 18.56 | |
| Time test (s) | 35.21 | 61.15 | 71.01 | 76.27 | 69.1 | |
| K Q (MPa m1/2) | 39.2 | 40.27 | 37.59 | 41.27 | 40.97 | |
| Rate test (MPa m1/2/s) | 1.11 | 0.66 | 0.53 | 0.54 | 0.59 | |
| Mean value of a | 19.81 | 19.83 | 19.91 | 20.11 | 19.53 | |
| Standard dev. of a | 1.1066 | 1.1580 | 0.9459 | 0.8739 | 1.2609 | |
| 0.45 ≤ (a/W) ≤ 0.55 | 0.50 | 0.50 | 0.50 | 0.50 | 0.50 | |
| P max/P Q < 1.1 | 1.03 | 1.01 | 1.06 | 1.01 | 1.01 | |
| K max < 0.6 K Q | K max (MPa m1/2) | 22.08 | 22.2 | 22.2 | 22.1 | 22.1 |
| 0.6 K Q (MPa m1/2) | 23.52 | 24.162 | 22.554 | 24.762 | 24.582 | |
Validation requirements for 321038 A101 rail (samples 3) – the criterion 2_5(K Q/R p0_2)_
| Determining K Ic | ||||||
|---|---|---|---|---|---|---|
| Sample no. | 3a | 3b | 3c | 3d | 3e | |
| 2.5 (K Q/R p0.2)2 < a 0 | 2.5 (K Q/R p0.2)2 | 0.0079 | 0.0084 | 0.0073 | 0.0088 | 0.0087 |
| a 0 | 19.81 | 19.83 | 19.91 | 20.11 | 19.93 | |
| 2.5 (K Q/R p0.2)2 < B | 2.5 (K Q/R p0.2)2 | 0.0079 | 0.0084 | 0.0073 | 0.0088 | 0.0087 |
| B | 24.98 | 25.02 | 49.98 | 25.05 | 24.96 | |
| 2.5 (K Q/R p0.2)2 < W − a | 2.5 (K Q/R p0.2)2 | 0.0079 | 0.0084 | 0.0073 | 0.0088 | 0.0087 |
| W − a | 20.13 | 20.20 | 20.17 | 19.93 | 20.03 | |
| K Ic results | 39.2 | 40.27 | 37.59 | 41.27 | 40.97 | |
Basic properties of the tested rail steel for individual rail types_
| Sample no. | Basic mechanical properties | ||||
|---|---|---|---|---|---|
| Tensile strength, R m (MPa) | Yield strength R p0.2 (MPa 20°C) | Elongation A (%) | Necking Z (%) | Hardness (HB) | |
| 1 | 1,286 | 881 | 9.1 | 18 | 376 |
| 2 | 1,249 | 854 | 10.3 | 22 | 365 |
| 3 | 1,238 | 875 | 10.9 | 23 | 363 |
| 4 | 1,262 | 877 | 10.7 | 22 | 366 |
| 5 | 1,284 | 904 | 11.2 | 23 | 364 |
| 6 | 1,270 | 899 | 10.4 | 23 | 367 |
| 7 | 1,293 | 885 | 11.5 | 21 | 370 |