Figure 1
Figure 2
Figure 3
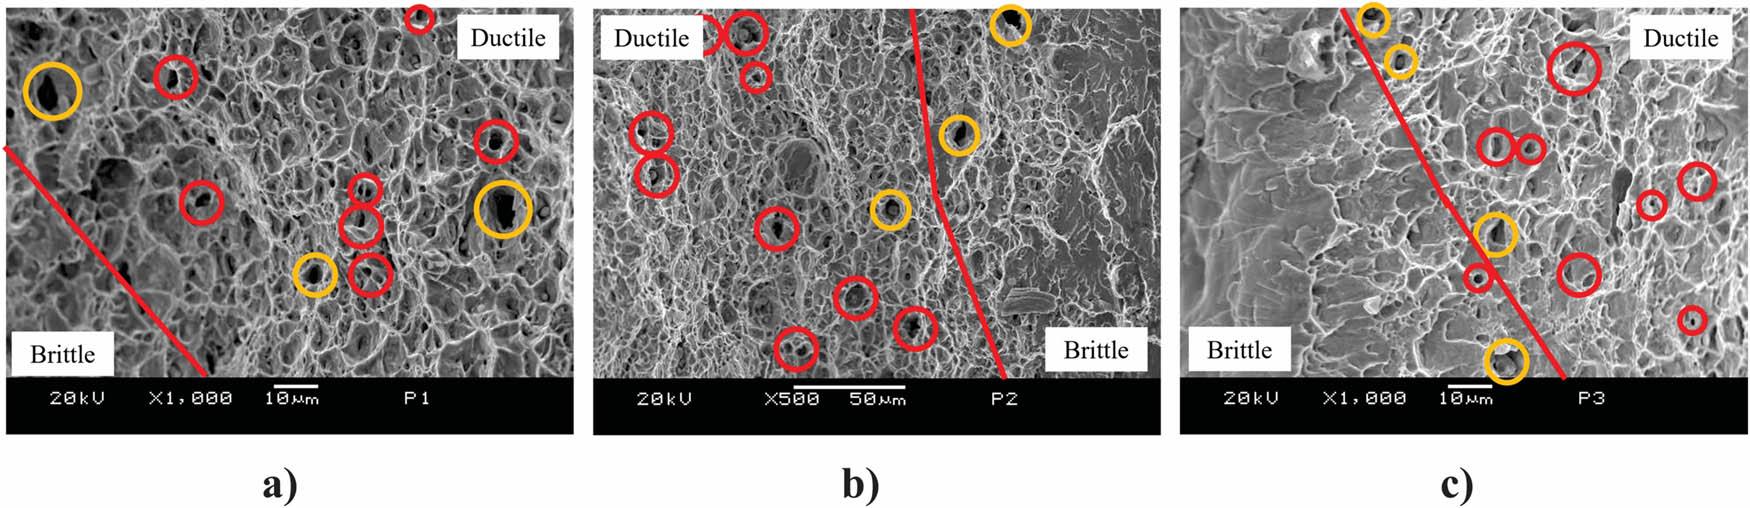
Figure 4
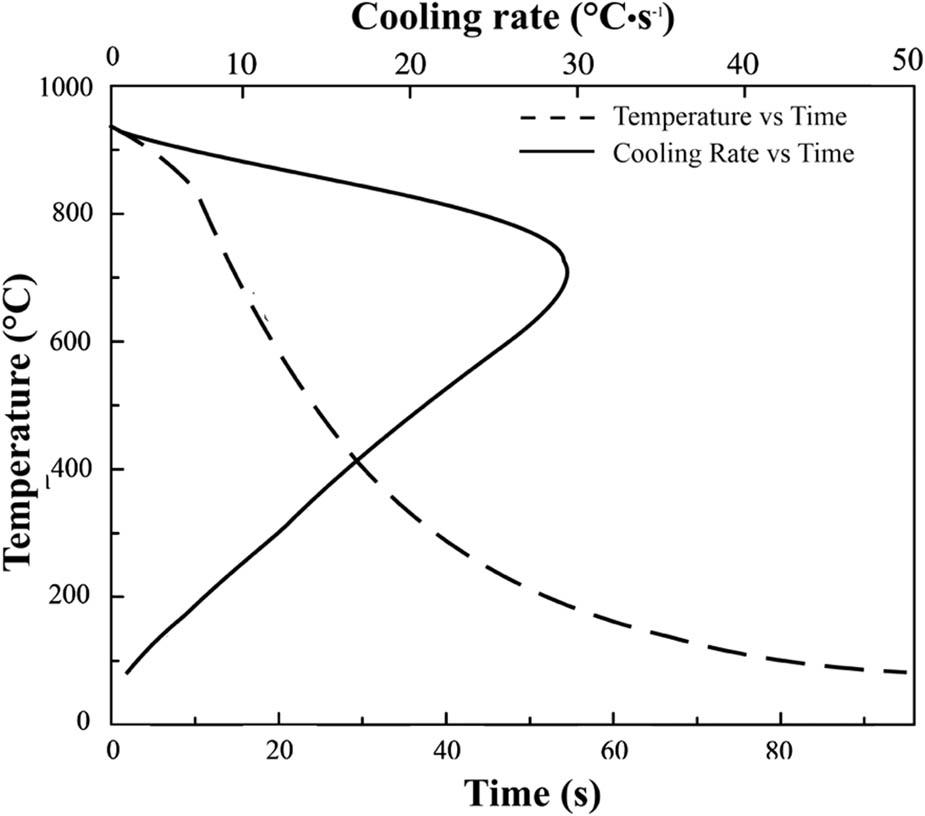
Figure 5
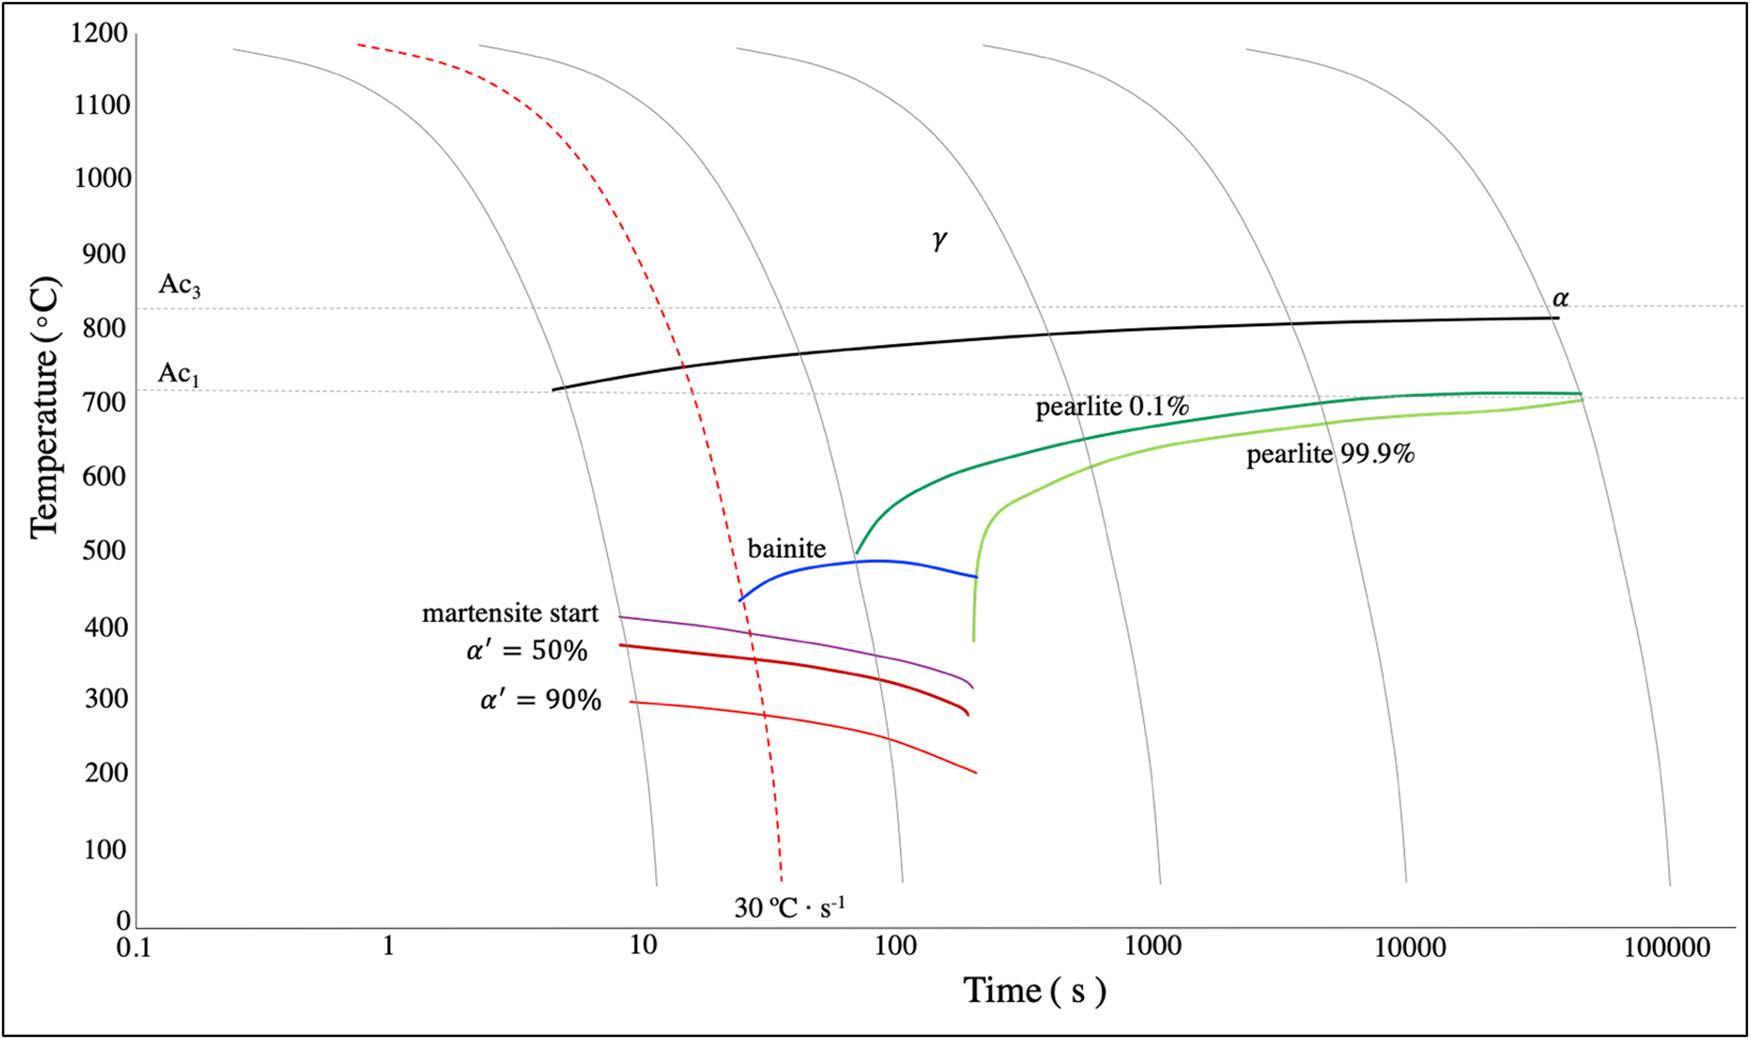
Figure 6
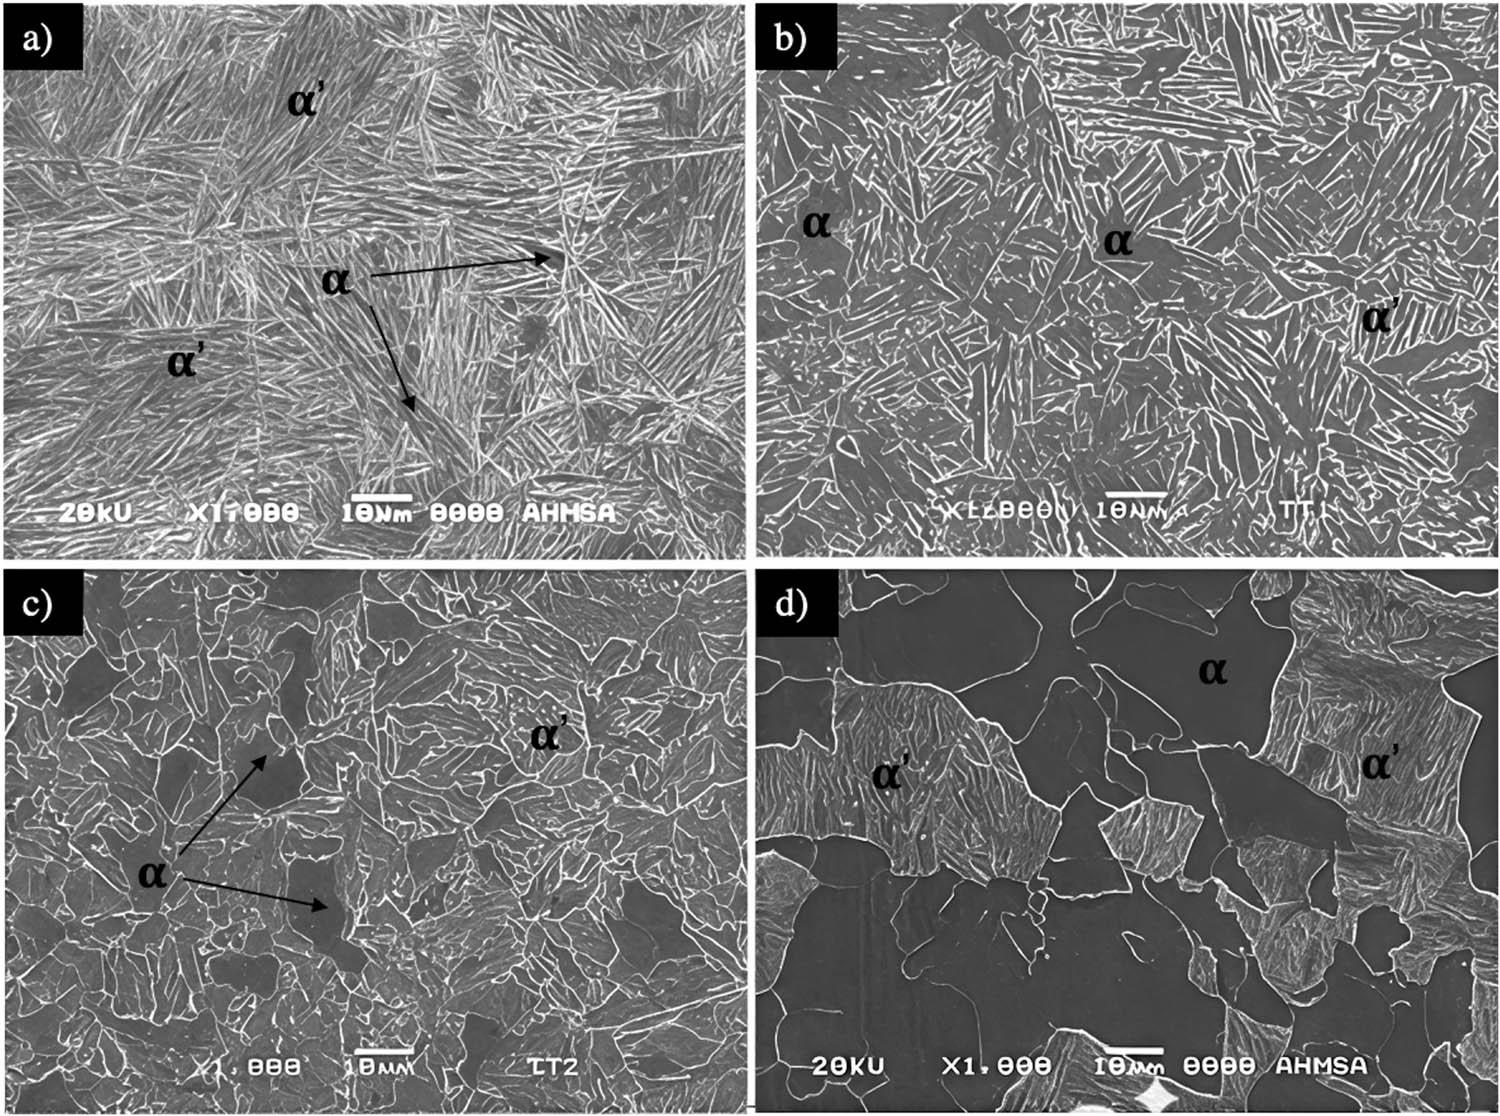
Figure 7
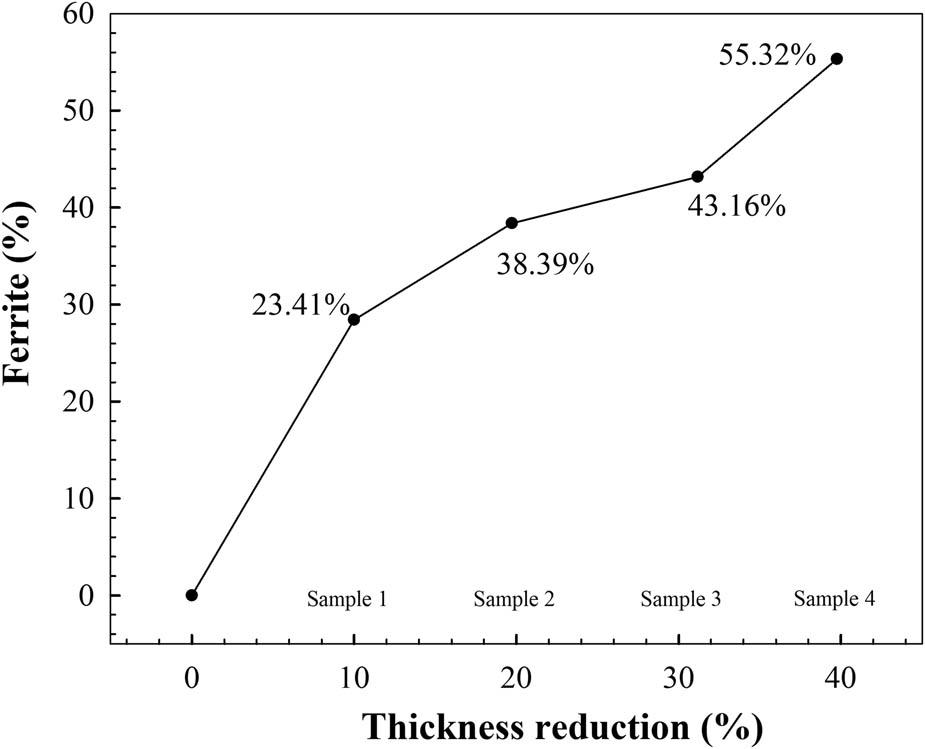
Figure 8
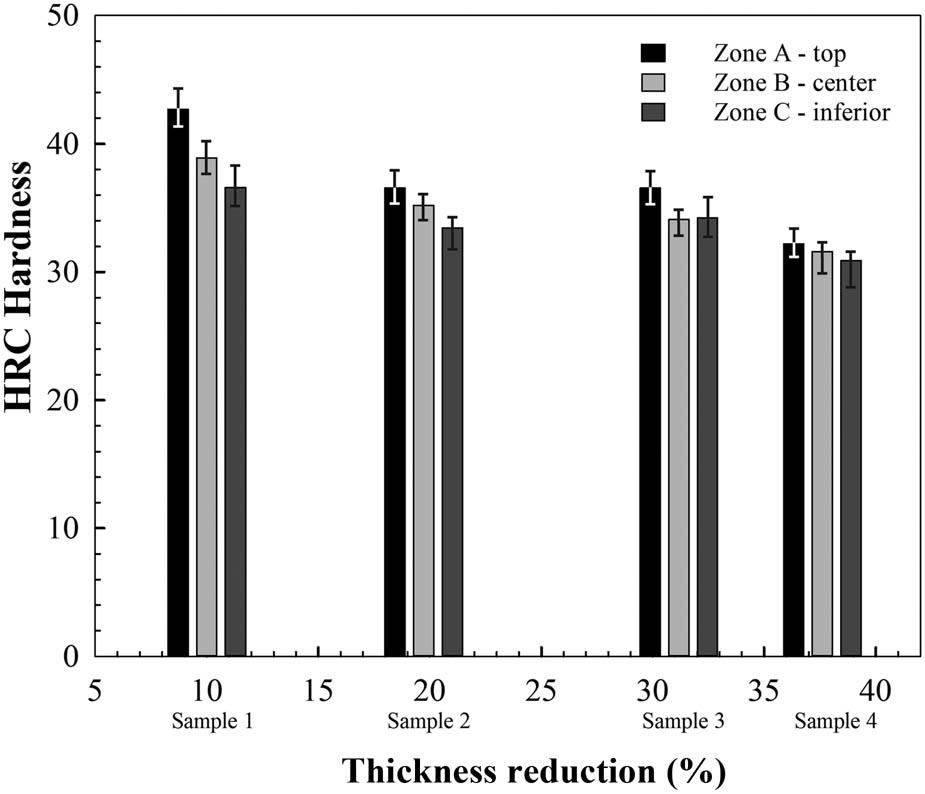
Figure 9
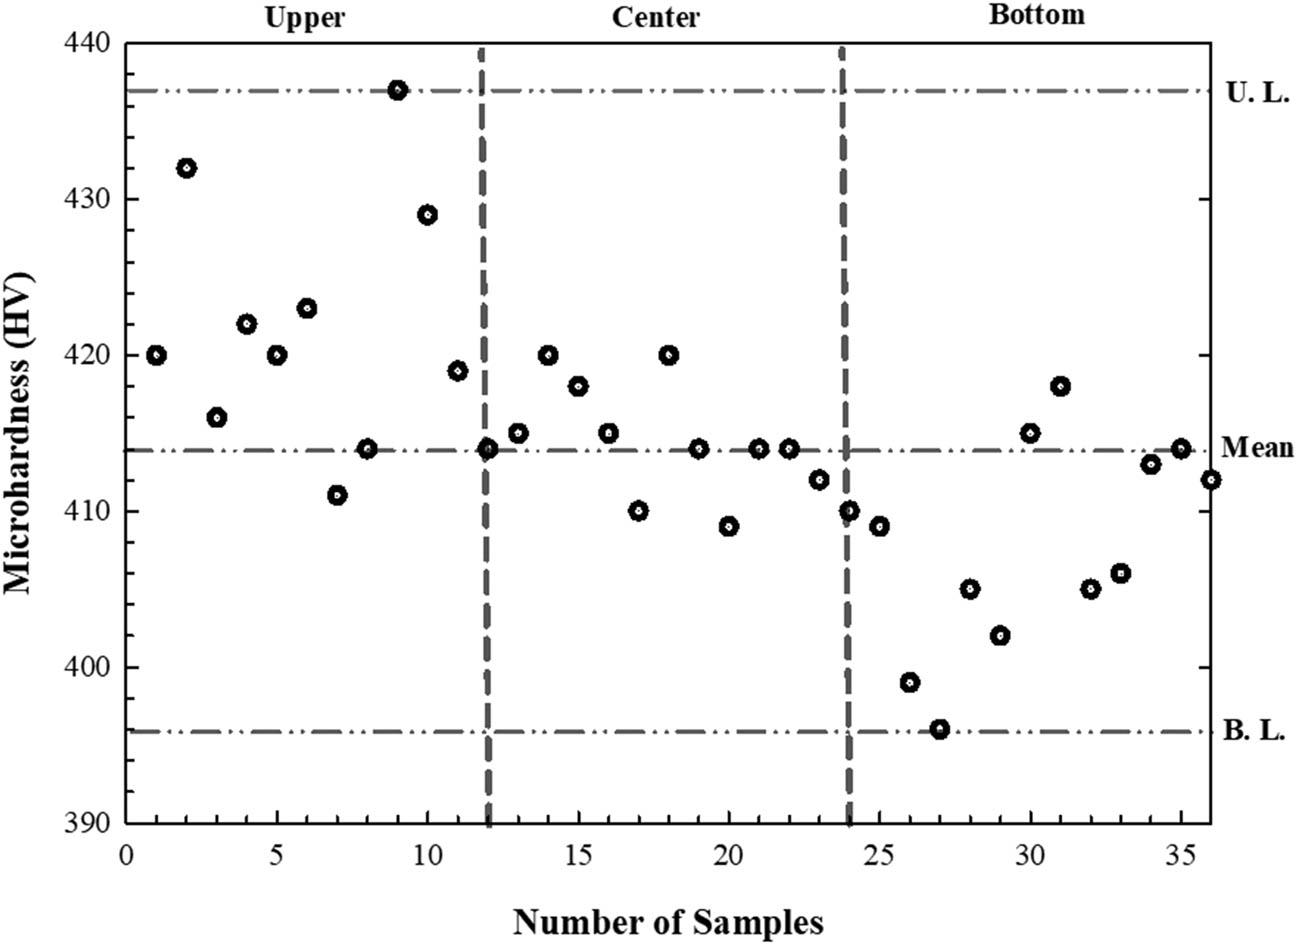
Figure 10
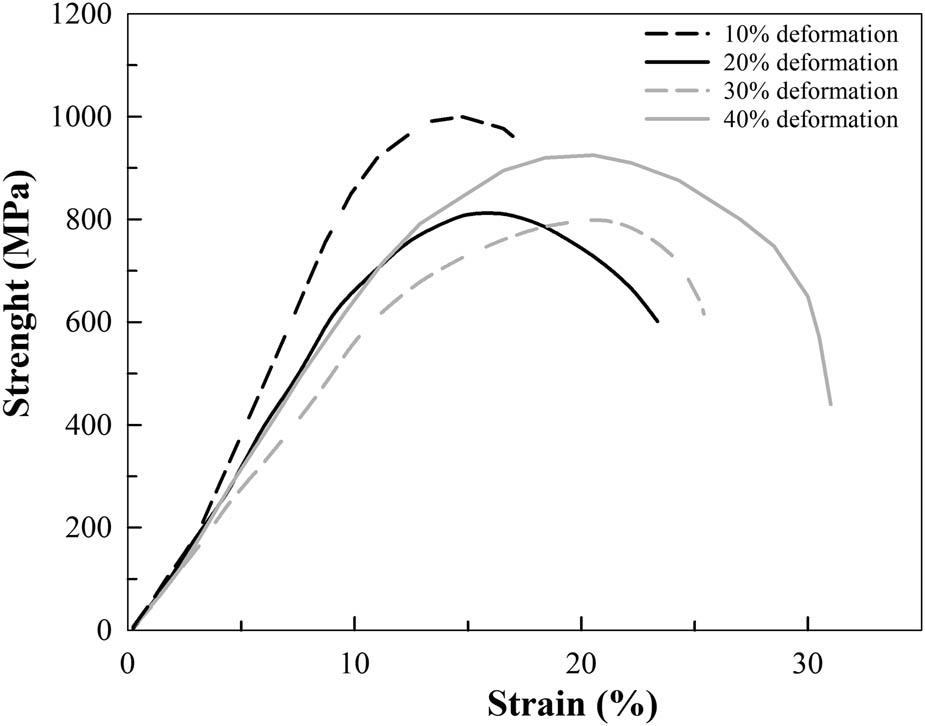
Figure 11
Processing variables used during hot rolling_
| Sample | Number of passes | Reduction (%) | Final thickness (mm, initial = 15.20) | Finishing temperature (°C) |
|---|---|---|---|---|
| 1 | 1 | 10.00 | 13.62 | 953.0 |
| 2 | 2 | 19.72 | 12.21 | 812.7 |
| 3 | 4 | 31.17 | 10.38 | 783.6 |
| 4 | 5 | 39.61 | 9.42 | 744.1 |
Some of the chemical compositions used for the simulation of the CCT diagrams to obtain a DP steel_
| C | Mn | Si | Cr | Mo | Nb | Ti | Al | B | P | S | |
|---|---|---|---|---|---|---|---|---|---|---|---|
| 1 | 0.11 | 1.8 | 0.5 | 2.75 | 0.6 | 0.005 | — | 1 | — | 0.04 | 0.04 |
| 2 | 0.15 | 1.8 | 0.3 | — | 0.6 | 0.003 | 0.5 | 0.9 | 0.0005 | 0.05 | 0.05 |
| 3 | 0.15 | 1.5 | 0.5 | 0.8 | 0.6 | 0.005 | 0.5 | 1 | 0.0001 | 0.05 | 0.05 |
| 4 | 0.15 | 1.8 | 0.5 | — | 0.5 | 0.005 | 0.5 | 1 | 0.0005 | 0.05 | 0.05 |
| 5 | 0.15 | 0.5 | 0.5 | 0.5 | — | 0.003 | — | 0.9 | 0.0001 | 0.05 | 0.05 |
| ⁞ | ⁞ | ⁞ | ⁞ | ⁞ | ⁞ | ⁞ | ⁞ | ⁞ | ⁞ | ⁞ | ⁞ |
| 37 | 0.18 | 0.75 | 0.5 | 0.25 | — | 0.005 | — | 1 | 0.0001 | 0.05 | 0.05 |
| 38 | 0.12 | 1 | 0.4 | — | 0.25 | 0.005 | — | 1 | 0.0003 | 0.02 | 0.02 |
| 39 | 0.15 | 0.25 | 0.3 | — | — | 0.003 | — | 0.9 | 0.0001 | 0.02 | 0.02 |
| 40 | 0.15 | 0.75 | 0.5 | — | — | 0.005 | — | 1 | 0.0005 | 0.02 | 0.02 |
Results obtained from microhardness measurements_
| Limit | Microhardness |
|---|---|
| UL | 437 HV |
| BL | 396 HV |
| Mean | 414 HV |
| Standard deviation | 8.45 |
Chemical composition proposed from the computational study and composition of the experimental steel_
| C | Mn | Si | Nb | Al | B | P | S | |
|---|---|---|---|---|---|---|---|---|
| Chemical composition proposed from the behavior of CCT diagrams | ||||||||
| Min. | 0.14 | 0.5 | 0.3 | 0.003 | 0.3 | 0.0003 | — | — |
| Máx. | 0.16 | 1.0 | 0.5 | 0.005 | 0.9 | 0.0005 | 0.02 | 0.02 |
| Chemical composition of the experimental steel (wt%) | ||||||||
| 0.15 | 1.04 | 0.44 | 0.006 | 0.4 | 0.0005 | 0.014 | 0.03 | |
Phases and mechanical properties calculated with the chemical composition of the experimental steel_
| Properties/phase | Results |
|---|---|
| Cooling rate | 30°C s−1 |
| Hardness | 37.7 HRC |
| Vickers hardness | 400 HV |
| UTS | 900.2 MPa |
| Ferrite | 46.18% |
| Martensite | 52.15% |
| Bainite | 1.52% |
| Pearlite | 0.13% |
| Austenite | 0.02 |