
Since the introduction of advanced high-strength steels, dual-phase (DP) steel has emerged as the ideal candidate group due to its simple and balanced microstructure, allowing for excellent strength without compromising ductility [1]. These low-carbon steels (with carbon content ranging from approximately 0.05 to 0.2%) typically contain Mn, Si, Nb, and other microalloying elements [2]. In general, DP steels are obtained through a heat treatment process that is specifically designed to produce a microstructure composed of a ferrite matrix (soft phase) with amounts of martensite (hard phase) between 5 and 30% [3]. This microstructure enables a good combination between resistance and deformation [4].
The excellent combination of mechanical properties and production methods has positioned it as the material of choice for the majority automotive component production, with more than 74% of the vehicle structures manufactured using this type of steel [5]. DP steels satisfy the requirements of weight reduction and high strength [6], making it ideal for producing bumpers, body panels, and rails, among other components [7]. The impact of hot rolling process parameters on the phases produced and mechanical properties of DP steels has been extensively researched [8], and it is crucial in the manufacturing process of these materials [9]. With the increasing demand for these materials, these variables have gained even greater importance and have been applied to the forming processes and final heat treatment [10] to control the resulting microstructure and mechanical properties [11]. This has enabled it to establish itself as one of the most profitable on the market [12]. Numerous studies have investigated the impact of processing parameters on the behavior of DP steels. Asadi and Palkowski [13] found that high deformations of steel below the TnRX (non-recrystallization temperature) produce finer ferrite grains and martensite blocks, which enhanced mechanical properties, compared to those steels micro-alloyed with Nb and Si to promote grain refinement.
Dawki et al. [14] established the critical cooling rate required for the production of DP steels through heat treatment by developing a logarithmic equation based on chemical composition.
On the other hand, Cai et al. [15] examined how the addition of Al between 0.9 and 1.1% could restrict the bainitic transformation at low cooling rates during continuous annealing. They also found that Mn content lowered the start temperature for the martensitic transformation (Ms), which expanded the range of cooling rates being able to obtain DP steels even at relatively low cooling rates. Schemmann et al. [16] conducted research on the effect of alloying elements on microstructure of DP steels. Their findings indicated that DP steels micro-alloyed with Nb exhibited superior grain refinement and increased elongation at fracture. Suwanpinij et al. [17] studied the effect of hot rolling deformation on phase transformation kinetics in DP steels. They found that austenite grains with a “pancake” morphology promoted the formation of denser nucleation sites, thereby accelerating the kinetics of ferrite transformation. Typically, DP steels from cold-rolled sheets are produced by intercritical annealing, followed by quenching at high rates, which allows obtaining a mixture of ferrite grains and martensite regions. Depending on the type of finished product, intercritical annealing can be accompanied by a hot dip galvanizing process [18]. Alternative routes have been proposed to obtain DP steels, such as control of initial microstructure, optimized heat treatments, optimization of hot rolling process, and modification of the chemical composition. However, there is a lack of information regarding the effects of chemical composition on the behavior of continuous cooling transformation (CCT) diagrams, and its effective use to propose an appropriate chemical composition that allows us to obtain DP steel plates directly from hot rolling process by controlling the cooling rate, without the need for subsequent heat treatment stage, which is the main objective of the present work.
The starting material is a commercial AISI 1018 steel. Therefore, the chemical composition of 1018 steel was considered the base material for the analysis of the CCT diagrams. Accordingly, the phase transformation curves were modified by adding the necessary alloying elements to obtain a DP steel under the following considerations: reducing the amount of alloying elements, i.e., obtaining a low-cost steel compared to those used in other investigations [13,14,15,16,17]; ensuring that the cooling rate used was the same as in industrial processes, i.e., 30°C s⁻¹, and allowing for a microstructure composed of approximately 50%α and 50%α′, with the necessary mechanical properties. Calculations were made by the JMatPro® software version 7.0. Table 1 shows some of the chemical compositions used in the simulation process. As can be seen, initially, the compositions used for simulations contain up to 11 elements due to the significant effect that each of them exerts on the microstructure and steel properties. However, as shown in Table 2, the number of elements recommended for the fabrication of the experimental steel was reduced to eight, trying to maintain a low-alloyed composition. Table 2 also shows that the proposed and experimental compositions are very similar. Carbon (C) and sulfur (S) concentrations in the experimental steel were determined by the combustion technique according to specifications of ASTM E-1019, and the rest of the elements were determined by optical emission spectrometry based on ASTM E-403.
Some of the chemical compositions used for the simulation of the CCT diagrams to obtain a DP steel.
| C | Mn | Si | Cr | Mo | Nb | Ti | Al | B | P | S | |
|---|---|---|---|---|---|---|---|---|---|---|---|
| 1 | 0.11 | 1.8 | 0.5 | 2.75 | 0.6 | 0.005 | — | 1 | — | 0.04 | 0.04 |
| 2 | 0.15 | 1.8 | 0.3 | — | 0.6 | 0.003 | 0.5 | 0.9 | 0.0005 | 0.05 | 0.05 |
| 3 | 0.15 | 1.5 | 0.5 | 0.8 | 0.6 | 0.005 | 0.5 | 1 | 0.0001 | 0.05 | 0.05 |
| 4 | 0.15 | 1.8 | 0.5 | — | 0.5 | 0.005 | 0.5 | 1 | 0.0005 | 0.05 | 0.05 |
| 5 | 0.15 | 0.5 | 0.5 | 0.5 | — | 0.003 | — | 0.9 | 0.0001 | 0.05 | 0.05 |
| ⁞ | ⁞ | ⁞ | ⁞ | ⁞ | ⁞ | ⁞ | ⁞ | ⁞ | ⁞ | ⁞ | ⁞ |
| 37 | 0.18 | 0.75 | 0.5 | 0.25 | — | 0.005 | — | 1 | 0.0001 | 0.05 | 0.05 |
| 38 | 0.12 | 1 | 0.4 | — | 0.25 | 0.005 | — | 1 | 0.0003 | 0.02 | 0.02 |
| 39 | 0.15 | 0.25 | 0.3 | — | — | 0.003 | — | 0.9 | 0.0001 | 0.02 | 0.02 |
| 40 | 0.15 | 0.75 | 0.5 | — | — | 0.005 | — | 1 | 0.0005 | 0.02 | 0.02 |
Chemical composition proposed from the computational study and composition of the experimental steel.
| C | Mn | Si | Nb | Al | B | P | S | |
|---|---|---|---|---|---|---|---|---|
| Chemical composition proposed from the behavior of CCT diagrams | ||||||||
| Min. | 0.14 | 0.5 | 0.3 | 0.003 | 0.3 | 0.0003 | — | — |
| Máx. | 0.16 | 1.0 | 0.5 | 0.005 | 0.9 | 0.0005 | 0.02 | 0.02 |
| Chemical composition of the experimental steel (wt%) | ||||||||
| 0.15 | 1.04 | 0.44 | 0.006 | 0.4 | 0.0005 | 0.014 | 0.03 | |
Fabrication of steel included melting of AISI 1018 steel and required ferroalloys in an Inductotherm VIP 75 induction furnace with a capacity of 20 kg. After fusion, steel ingots with dimensions of 5.0 cm wide × 5.0 cm thick × 25.5 cm were obtained by casting and solidification in metal ingots manufactured from rectangular hollow sections.
The critical transformation temperatures for the experimental steel under continuous heating, Ac1 and Ac3, were determined by dilatometric analysis, using a vertical dilatometer L75 V (Linseis, Germany) at a heating rate of 5°C min⁻¹. The temperatures obtained were approximately 730 and 820°C, respectively. These temperatures were compared and verified with those obtained by JMatPro®.
The hot rolling process was carried out in a reversible duo mill at a roll rotation speed of 18 rpm using samples of 5 cm wide × 1.52 cm thick × 10 cm long, which were cut from the ingots mentioned in the previous section. Figure 1 shows a general diagram of the thermomechanical processing of the experimental steel. Homogenization of steel was conducted at 1,000°C for 45 min, followed by hot rolling with a starting temperature of 1,000°C aiming to reduce the steel thickness from 15.20 to 9.42 mm.
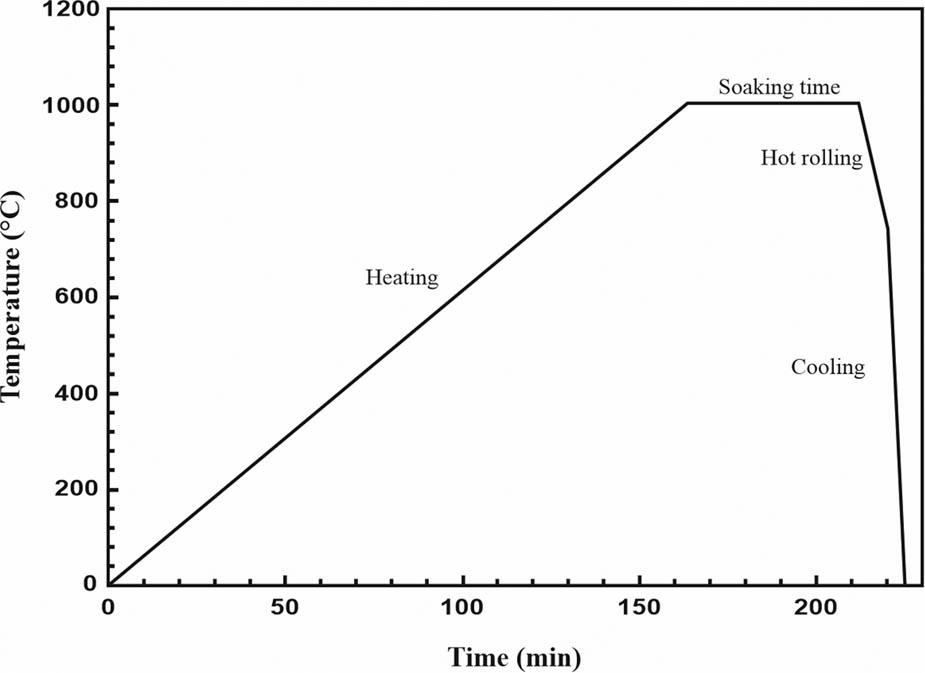
Thermomechanical process used to obtain hot-rolled DP steel plates.
The thickness reduction percentage and finishing temperatures for each rolling pass are shown in Table 3. A cooling system was designed to achieve a cooling rate of 30°C s⁻¹; samples were cooled using water sprays and a Lechler 632.604 nozzle, as shown in Figure 2. Steel plates were instrumented with type K thermocouples. Thermal history was recorded with a data acquisition system, which allowed calculation of the cooling rate by the inverse heat conduction problem technique as reported elsewhere [19].
Processing variables used during hot rolling.
| Sample | Number of passes | Reduction (%) | Final thickness (mm, initial = 15.20) | Finishing temperature (°C) |
|---|---|---|---|---|
| 1 | 1 | 10.00 | 13.62 | 953.0 |
| 2 | 2 | 19.72 | 12.21 | 812.7 |
| 3 | 4 | 31.17 | 10.38 | 783.6 |
| 4 | 5 | 39.61 | 9.42 | 744.1 |
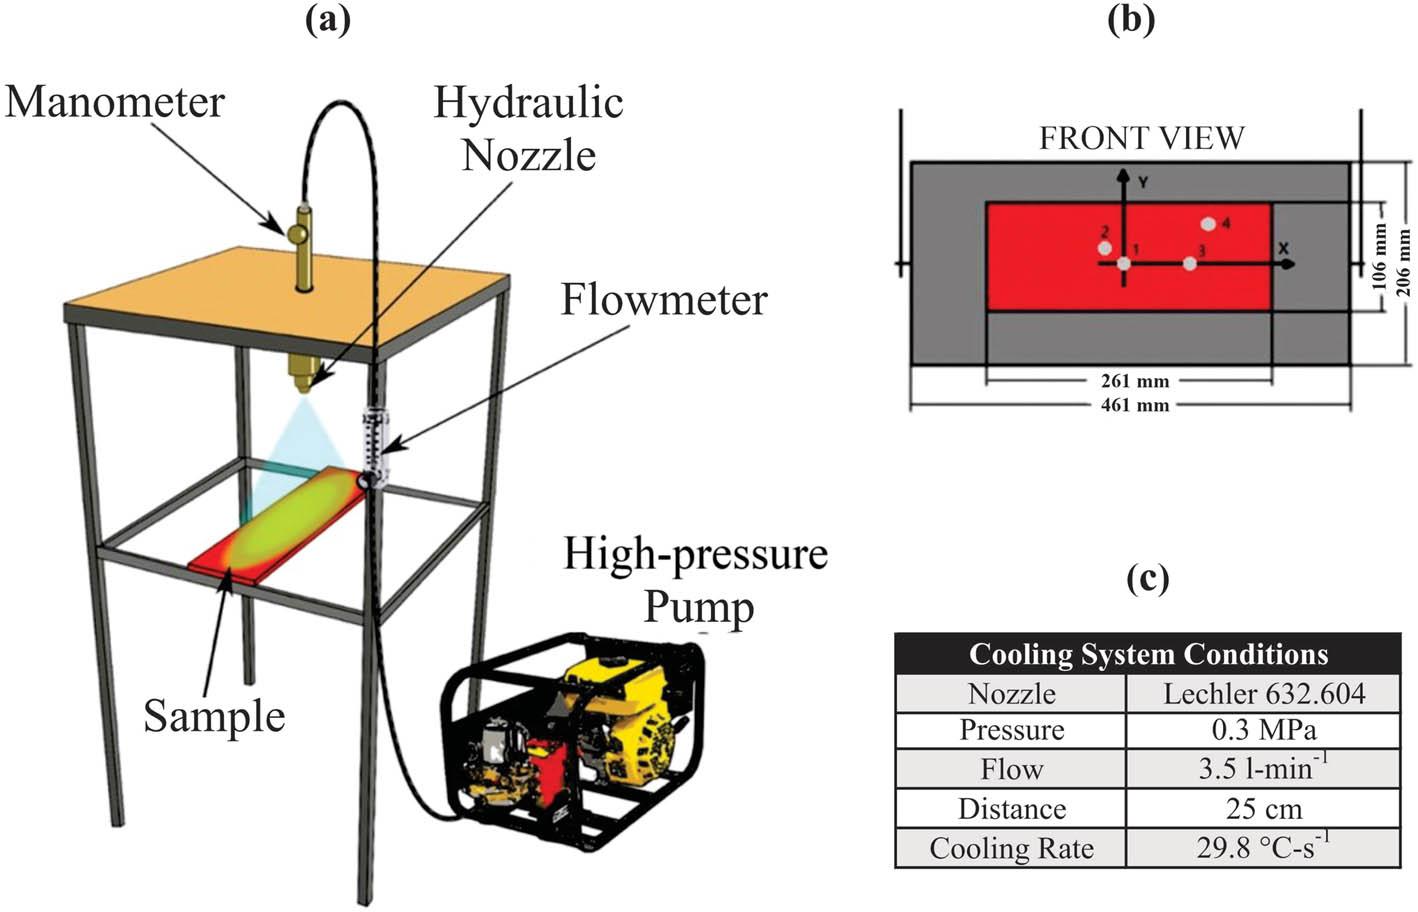
(a) Cooling system designed for cooling of steel after the hot rolling process, (b) diagram of the metal support and plate instrumented with thermocouples, and (c) cooling system conditions [19].
Microstructure of the samples subjected to different hot rolling conditions was characterized by scanning electron microscopy (SEM) in a JEOL microscope model JSM-5910LV; the samples were analyzed by secondary electrons at an acceleration voltage of 20 kV. Three pieces with 2.5 cm × 5 cm × 1 cm dimensions were cut for each experimental condition. Samples were prepared using conventional metallographic techniques, which include grinding with SiC papers of different granulometries and subsequent polishing with 3 and 1 µm diamond paste to achieve a mirror-like surface. To reveal the microstructure, samples were etched by immersion for 20 s in 3% Nital solution. Images were obtained and processed with the open source Image J program to quantify the resulting phases. Hardness measurements were conducted using a Pantec model RB durometer using a load of 150 kgf. Figure 3 shows schematically the distribution of measurements considered for the microhardness measurements along the thickness of the steel plates (A upper, B center, and C lower). Vickers microhardness measurements were performed using a MVK-HVL-Mitutoyo microhardness tester at different locations along the thickness of the steel cross-sections; 36 indentations were made on each sample, using an indentation force of 300 gf. On the other hand, uniaxial tensile tests were performed on an Instron 1195 Universal machine with a maximum load capacity of 10 tons. Ten specimens were cut and machined according to the ASTM E8 standard. The experiments were carried out at a loading rate of 2 mm min⁻¹, and the deformation of the samples was recorded with an extensometer located on the calibrated section of the specimen. The experiments for each rolling condition were performed in triplicate. Finally, V-notch impact tests (Charpy test) were performed according to ASTM E23 on the samples that showed the best proportion and distribution between the two phases (ferrite and martensite). The experiments were conducted on an Instron SI-1A series machine. Rectangular specimens with dimensions of 10 mm × 10 mm × 55 mm were cut and machined. The V-notch was located in the center of the specimen with an opening angle of 45°. Three samples were tested at room temperature. After the impact test, the fracture zone was analyzed by SEM.
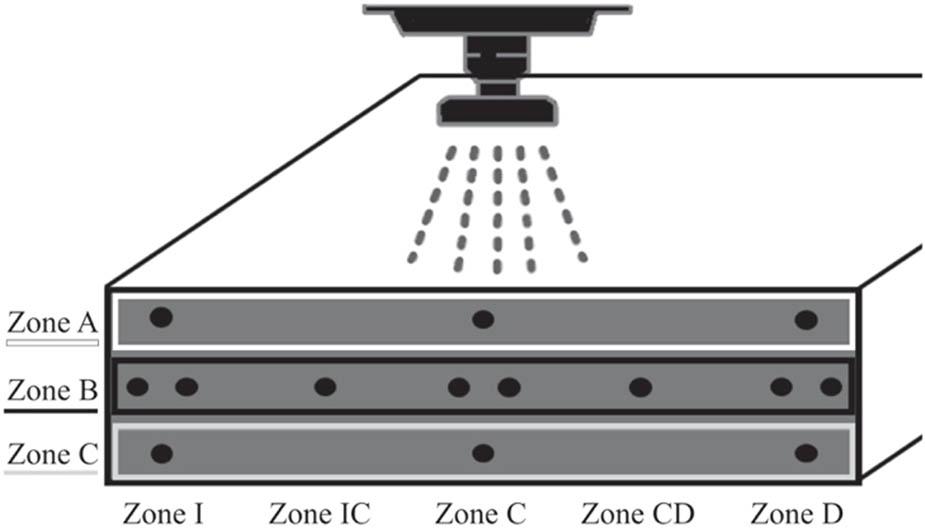
Scheme of distribution hardness measurements in cross sections of steel.
The cooling profiles obtained experimentally in the steel plates are shown in Figure 4. The dashed line indicates the variation of temperature with respect to time for the conditions shown in Figure 2(c), while the solid line represents the cooling rate (30°C s⁻¹) achieved under such conditions.
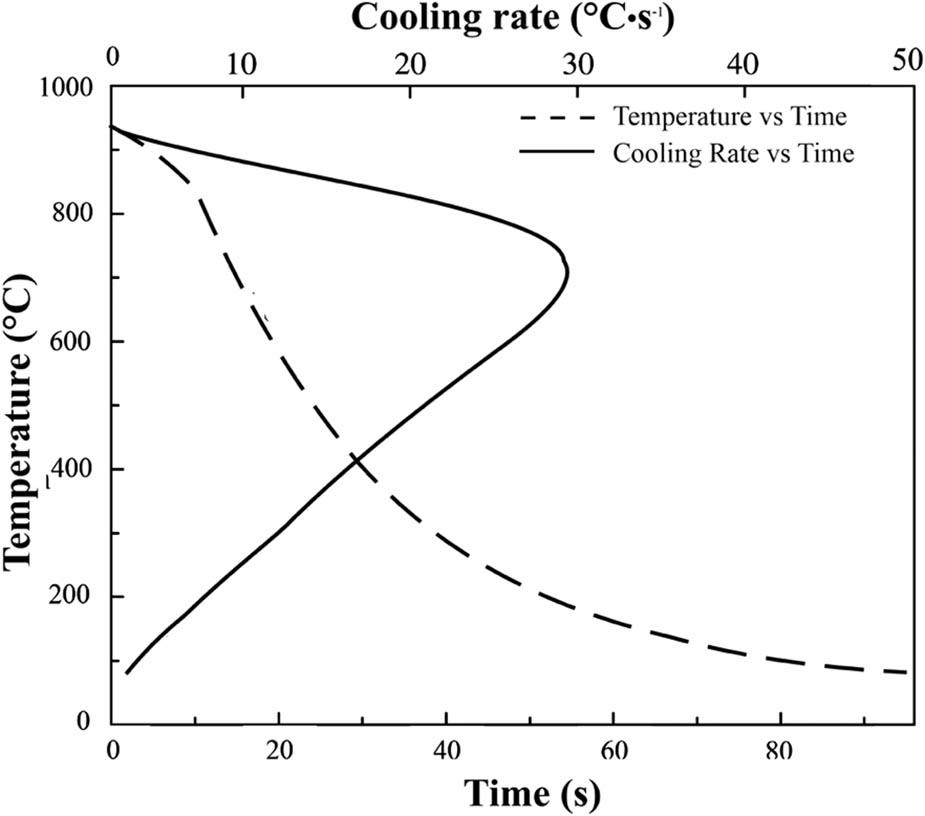
Cooling rate achieved with conditions shown in Figure 2(c).
This cooling rate was superimposed on the CCT diagram shown in Figure 5 (red dashed line), which was calculated using the chemical composition of the experimental steel (Table 2). According to this diagram, cooling of steel from about 1,200°C (austenite phase field) could lead to microstructures consisting mainly of a mixture of ferrite and martensite on continuous cooling at 30°C s⁻¹. However, the cooling line passes very close to the start bainitic transformation line; therefore, some small amount of this phase may be present in the microstructure. As shown in Table 4, for the chemical composition of the experimental steel, and using this cooling rate, could allow obtaining DP steels composed of about 46% of ferrite and 52% of martensite, with a ultimate tensile strength (UTS) of about 900 MPa.
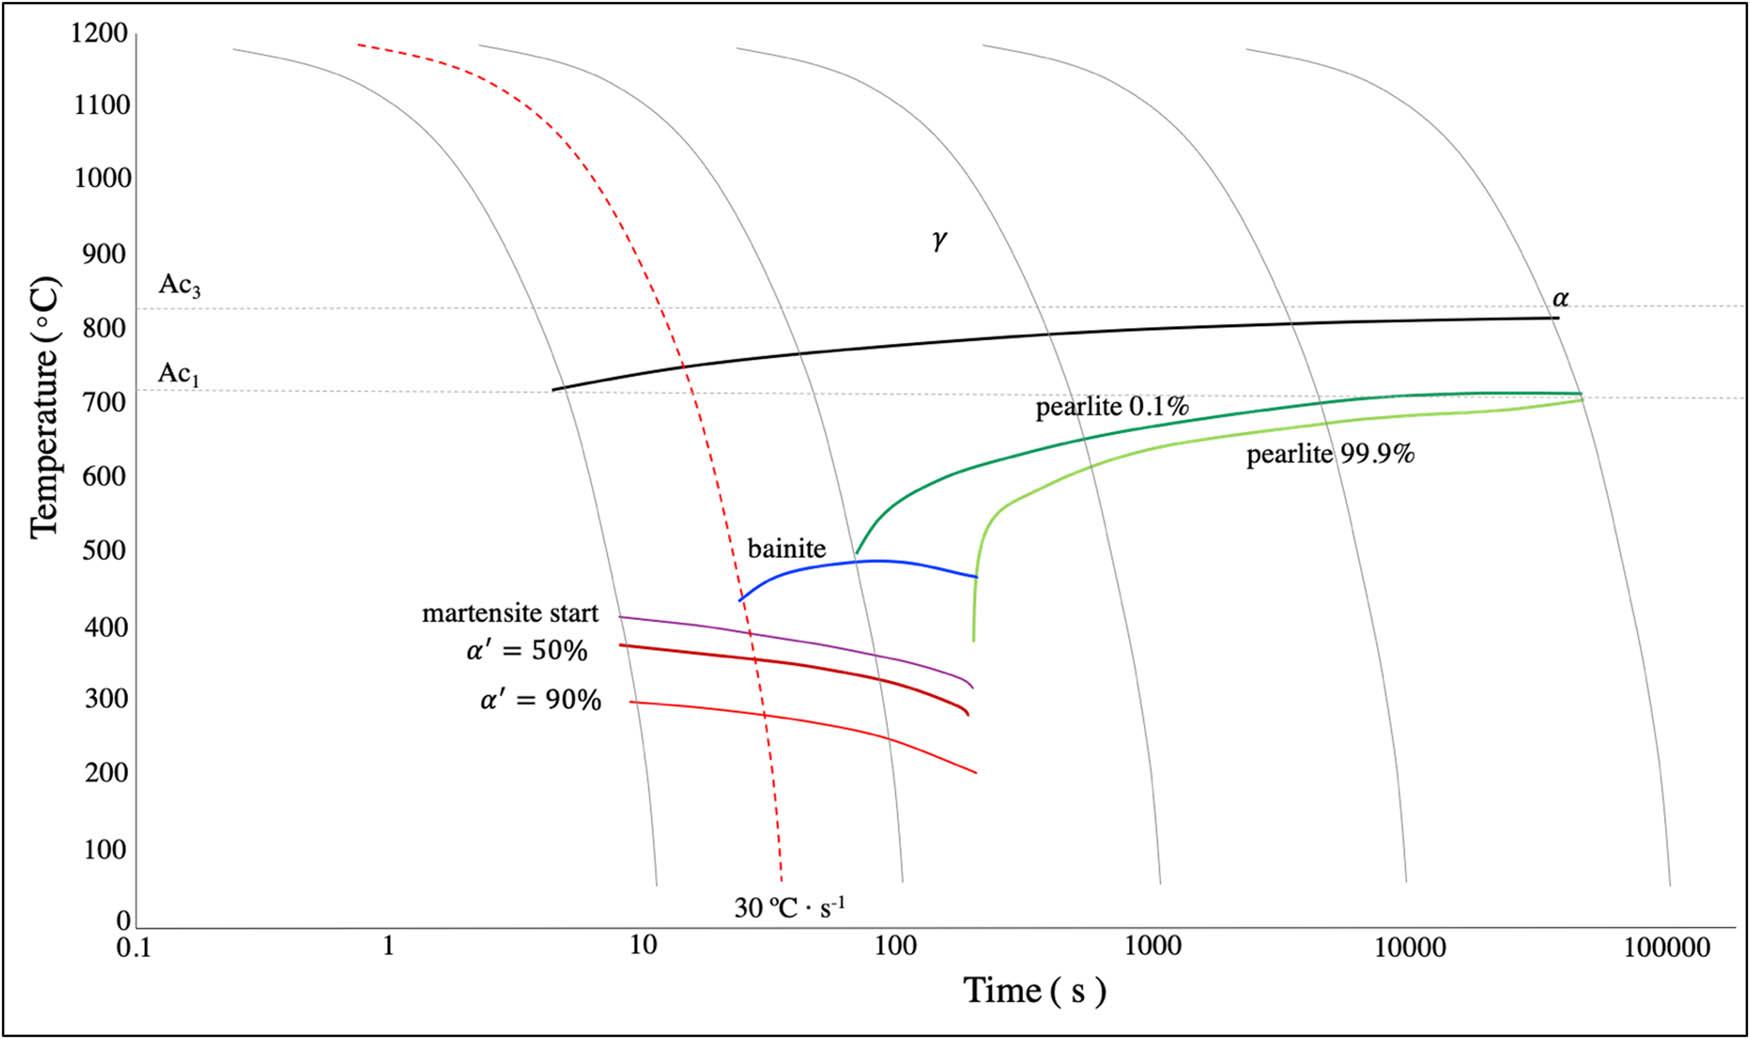
CCT diagram calculated using the chemical composition of the experimental steel.
Phases and mechanical properties calculated with the chemical composition of the experimental steel.
| Properties/phase | Results |
|---|---|
| Cooling rate | 30°C s−1 |
| Hardness | 37.7 HRC |
| Vickers hardness | 400 HV |
| UTS | 900.2 MPa |
| Ferrite | 46.18% |
| Martensite | 52.15% |
| Bainite | 1.52% |
| Pearlite | 0.13% |
| Austenite | 0.02 |
DP steels are frequently obtained through a step-by-step process of intermediate annealing and quenching after hot rolling [20]. During intercritical annealing, austenite isothermally transforms into ferrite, forming a mixture of austenite and ferrite. The phase transformation occurs from this mixture (γ + α), where the remaining austenite transforms to martensite during tempering, thereby forming the microstructure of DP steel [21]. Contrary to the typical route for obtaining DP steels, Figure 6 shows the effect of the degree of deformation and the finishing rolling temperature on the microstructures of hot-rolled steel. In general, the combination of these processing parameters with controlled cooling produces microstructures composed of α + α′ with different amounts of the phases. Figure 6(a) corresponds to the sample subjected to 10% thickness reduction and rolled at temperatures within the austenite phase field, above Ac3 (Table 3). As can be seen, the microstructure is mainly composed of martensite and small amounts of ferrite. A similar behavior was observed in Figure 6(b), after applying a 20% thickness reduction and using a finishing temperature slightly below Ac3 (T < 830°C), which means very close to the γ-region. These results suggest that the low degree of deformation promotes the formation of a small number of nuclei for the formation of ferrite, which, added to the short time available for the transformation of austenite to ferrite at this temperature, favors the transformation to martensite on cooling due to the amount of austenite available [22]. The above is more significant when the steel is subjected to larger thickness reductions (30 and 40%) and lower finishing temperatures, i.e., within the two-phase range Ac1 < T < Ac3 (783.6 and 744.0°C, respectively), as shown in Figure 6(c) and (d). These processing conditions result in the formation of a greater number of preferential sites for ferrite nucleation, thereby increasing the driving force of the γ → α phase transformation. It has been reported that shear bands can be formed during rolling of steel at temperatures within the two-phase field region where ferrite and austenite coexist, which is due to the difference in workability between ferrite and austenite [23]. Shear bands are regions of high misorientation and thus represent additional nucleation sites for ferrite formation, therefore limiting the amount of austenite that transforms to martensite during continuous cooling, as described in other studies [24]. This behavior is crucial, as the fraction of phases present will ultimately determine the mechanical properties of steel [25]. However, unlike what has been reported in the literature, the microstructures in Figure 6 show that controlling the operating conditions during hot rolling and the cooling rate is sufficient to promote a microstructure characteristic of DP steel.
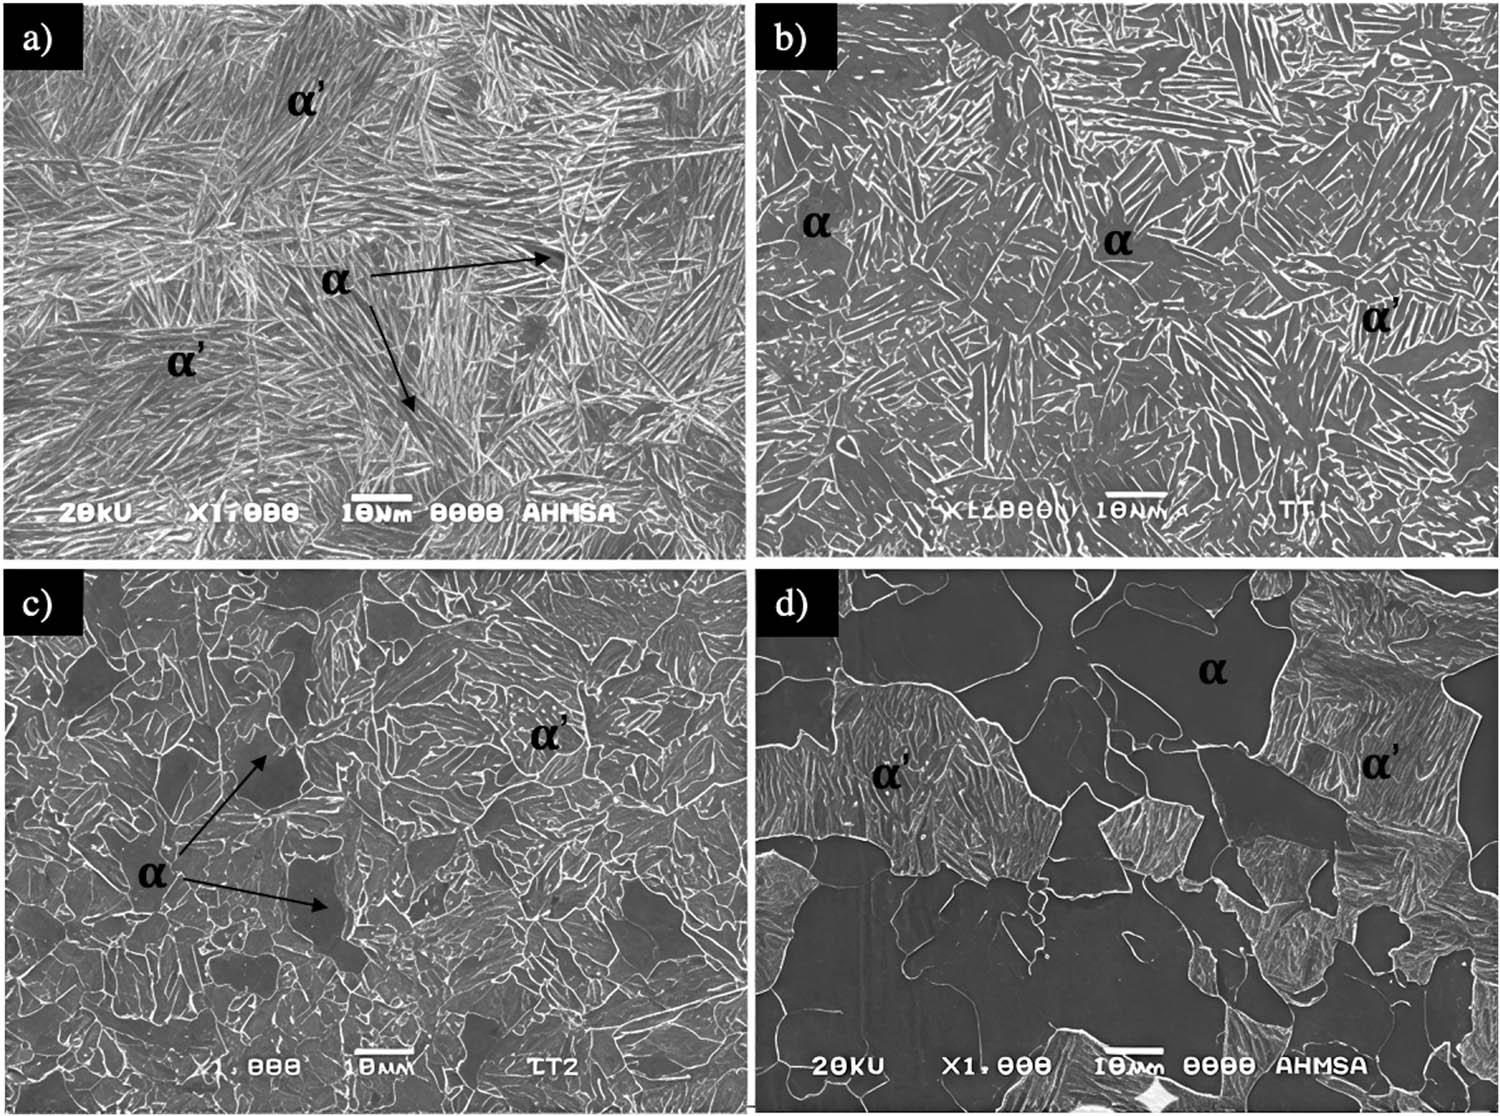
Effect of thickness reduction during hot rolling on the γ → α + α′ phase transformation for the experimentally produced steel: (a) 10% (953.0°C), (b) 20% (812.7°C), (c) 30% (783.6°C), and (d) 40% (744.0°C). Cooling rate was kept constant at 30°C s−1.
The quantification of the phases present in the hot-rolled samples is shown in Figure 7. As can be seen, the amount of ferrite obtained in the sample with a thickness reduction of 10% is 23.41% and increases to 55.32% when the thickness reduction increases to 40%. These results confirm that the deformation degree applied during hot rolling, which is not fed as an input value to the software, as important contribution in determining the phases percent after thermomechanical process. Some authors have reported that processing parameters have an important effect on the final microstructure of DP steels and, consequently, on their mechanical properties [26]. The effect of grain size and phase fraction on the mechanical behavior in DP steels is a determining factor because the mechanical properties are primarily dependent on the morphological parameters of the phases formed during intercritical annealing in the austenite/ferrite mixture and later inherited to the transformation products [27]. On the other hand, it has been demonstrated that soaking time and temperature play a predominant role in the quantity and austenite grain size. Using start temperatures above 1,000°C promotes a rapid austenite grain growth, which is related to dissolution of second phases such as carbides and nitrides in the matrix (i.e., when the starting microstructure is composed of ferrite and pearlite) [28]. Other authors have found that temperatures higher than Ac3 lead to high martensite amount after cooling [23]. Soaking time also plays a vital role in the austenite transformation; the increase in the austenitization time allows austenite grain growth, affecting the kinetics of the austenite to ferrite transformation on cooling [17]. All these parameters need to be controlled during steel processing to obtain DP steels.
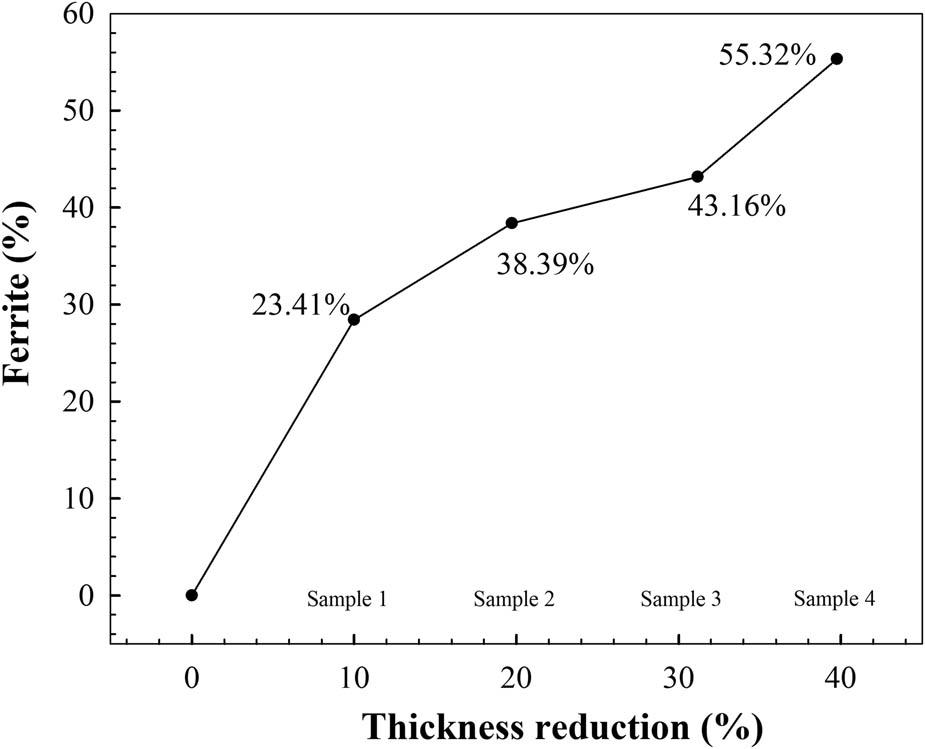
Effect of thickness reduction, applied during hot rolling, on the amount of ferrite.
Figure 8 shows the results of the Rockwell C hardness measurements corresponding to each experimental condition, using the methodology shown in Figure 3. The highest hardness values (38 HRC on average) correspond to those samples processed in the γ-region, which is consistent with the large amount of martensite observed in Figure 6(a), due to the phase transformation caused by cooling from this region. On the other hand, hardness values from 31 to 36 HRC are obtained in those samples subjected to hot rolling at temperatures within the intercritical (γ + α) region, which was attributed to the increase in the amount of ferrite, as shown in Figure 6(c) and (d). This behavior suggests that the cooling rate from different finishing regions of the rolling is decisive in the amount of the phases and the hardness value obtained. In general, individual hardness values (per sample) vary slightly depending on the hot rolling conditions; this behavior is associated with the heat extraction rate. In Figure 4, zone A, which is closest to the cooling region, shows the γ → α′ phase transformation, resulting in slightly higher values than the rest of the sample.
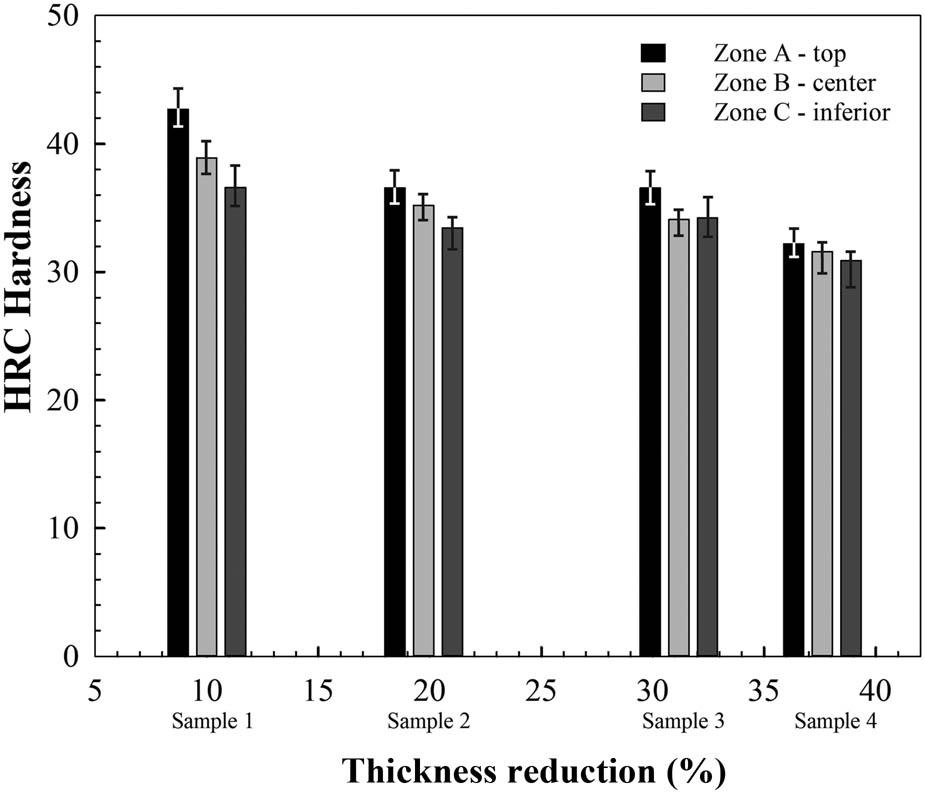
Hardness values obtained for samples subjected to different hot rolling conditions.
Figure 9 shows the individual Vickers microhardness profile carried out throughout the plate thickness of sample 4 (55α + 45α´ DP steel). As can be seen, there is a slight variation in the microhardness values obtained among the different areas. The lower limit (B.L.), upper limit (U.L.), and mean values of microhardness measurements are shown in Table 5. As can be seen, most of the measurements remain around the mean value (414 HV). These results are comparable to those reported in the literature for DP steels [29]. The difference in microhardness values in each zone is related to the variations in the martensite amount with the distance between the position of the cooling system nozzle and the steel plate, which implies variations in local cooling rates.
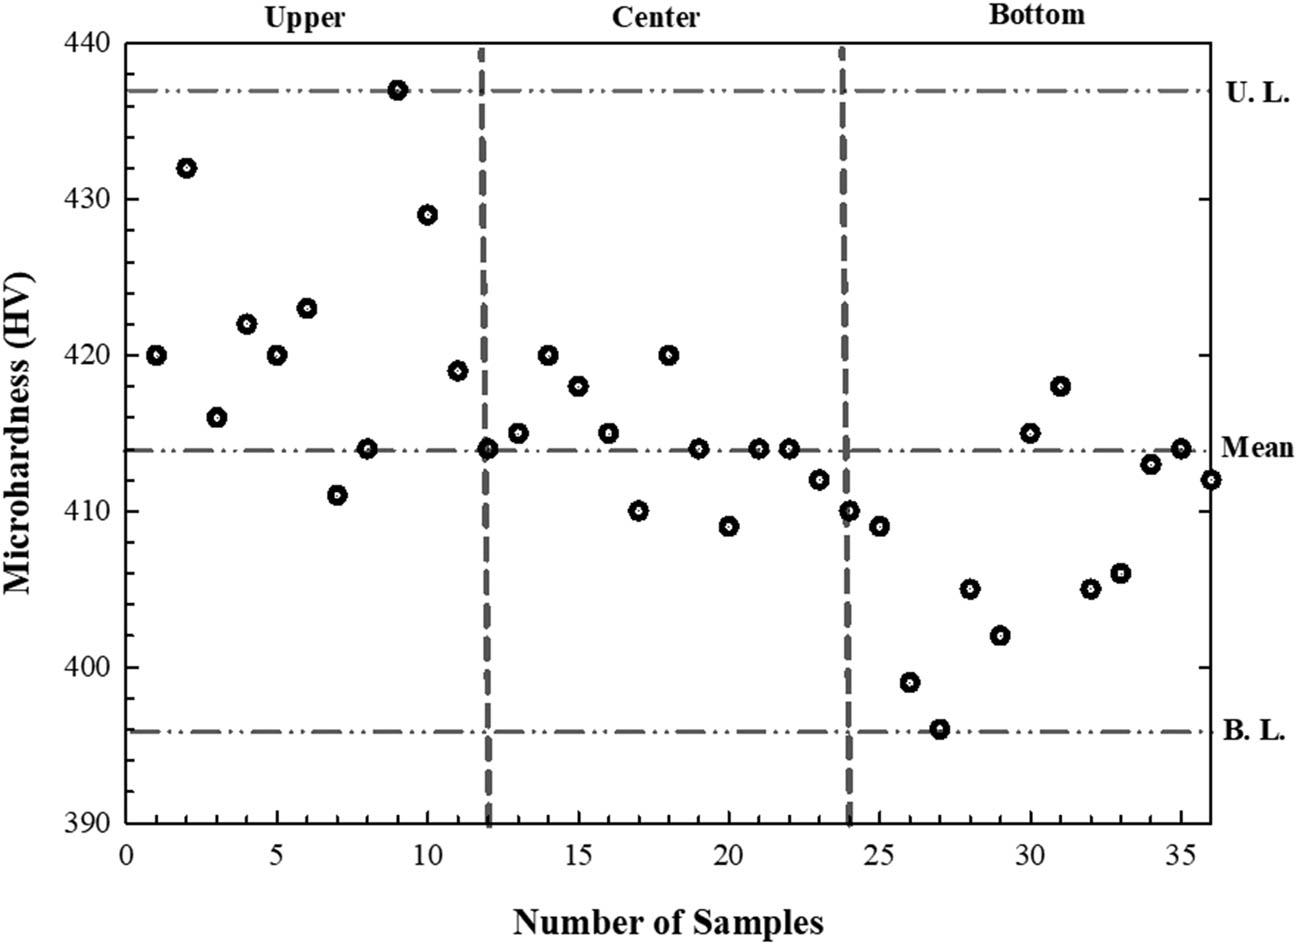
Vickers microhardness profile made throughout the thickness of sample 4, which is composed of ∼55%α + 45%α´.
Results obtained from microhardness measurements.
| Limit | Microhardness |
|---|---|
| UL | 437 HV |
| BL | 396 HV |
| Mean | 414 HV |
| Standard deviation | 8.45 |
The results from tension tests for each processing condition are shown in Figure 10. It is interesting to observe the effect of processing conditions on the behavior of the stress–strain curve for the resulting DP steels. The graph shows that when the steel is rolled at low deformation percentages (10%), the curve exhibits a UTS maximum of 1,000 MPa, but the elongation percentages are lower than 17%. This value is improved when the thickness reduction increases and the finishing temperature decreases, which is associated with phase transformation. In general, the behavior shown under these conditions is associated with the martensite amount present in the microstructure since, on average, these steels are composed of more than 70% of this phase, according to what is shown in Figures 6 and 7. In contrast, the samples subjected to reductions greater than 30% exhibit a significant decrease in tensile strength to 900 MPa, as shown in Figure 10. However, the elongation at fracture is considerably improved since it reaches values between 25 and 30%. These results are attributed to the larger amount ferrite, which was increased with the increase in the deformation degree and decreasing finishing temperature. Therefore, the resulting mechanical properties result from the contribution of both phases (∼55.32%α–44.68%α), as shown in Figure 7. A comparison between the calculated mechanical properties (Table 4) and those obtained experimentally shows that, under certain processing conditions, they are similar, such that this condition allows obtaining the optimal balance between strength (900 MPa), elongation (30%), and toughness (123 J) required in DP steels. It can allow us to conclude that apart from chemical composition, deformation degree and rolling need to be adjusted conditions to obtain DP steels under industrial processing conditions.
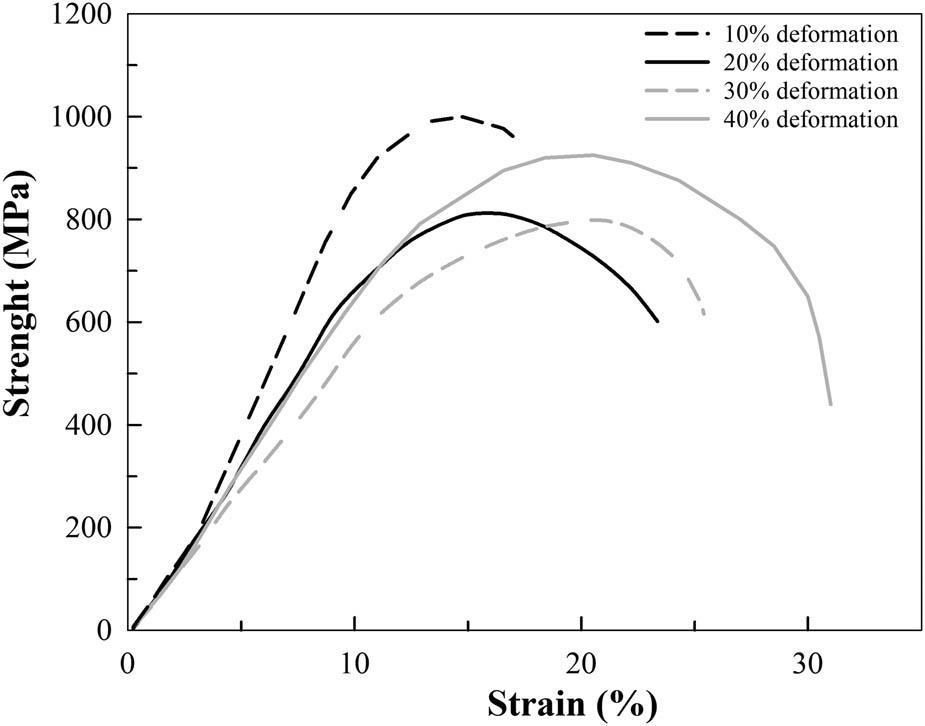
Stress vs strain graph corresponding to steels processed under different hot rolling conditions to 10% (953.0°C), 20% (812.7°C), 30% (783.6°C) and 40% (744.0°C).
Figure 11 shows the SEM fracture analysis of the DP steel as illustrated in Figure 11. Two behaviors can be found in the images: the existence of both ductile and brittle fractures and the presence of hollows. The latter is a characteristic phenomenon for ductile fractures in DP steels. This mechanism occurs in three sequential stages: nucleation, growth, and hollow coalescence, giving rise to an adipose fracture surface [30]. In the photomicrographs presented in Figure 11, a mixed behavior can be observed that contains both ductile and brittle characteristics since it is easy to identify the presence of hollows, as well as cleavage on the fracture surface, mechanisms that are responsible for generating the fracture known as quasi-fragile [31]. Images show the regions with micro hollows – marked with red circles caused by the ductile phase – ferrite, the same area that presents a fracture with an adipose surface. In contrast, the cleavage surface with plane deformation characteristic of a brittle fracture caused by martensite can be observed. On the other hand, deep hollows are identified and highlighted in yellow; they generally exist between the cleavage interface and the surrounding hole zones, associated with those primary holes formed between ferrite–martensite interfaces [32].
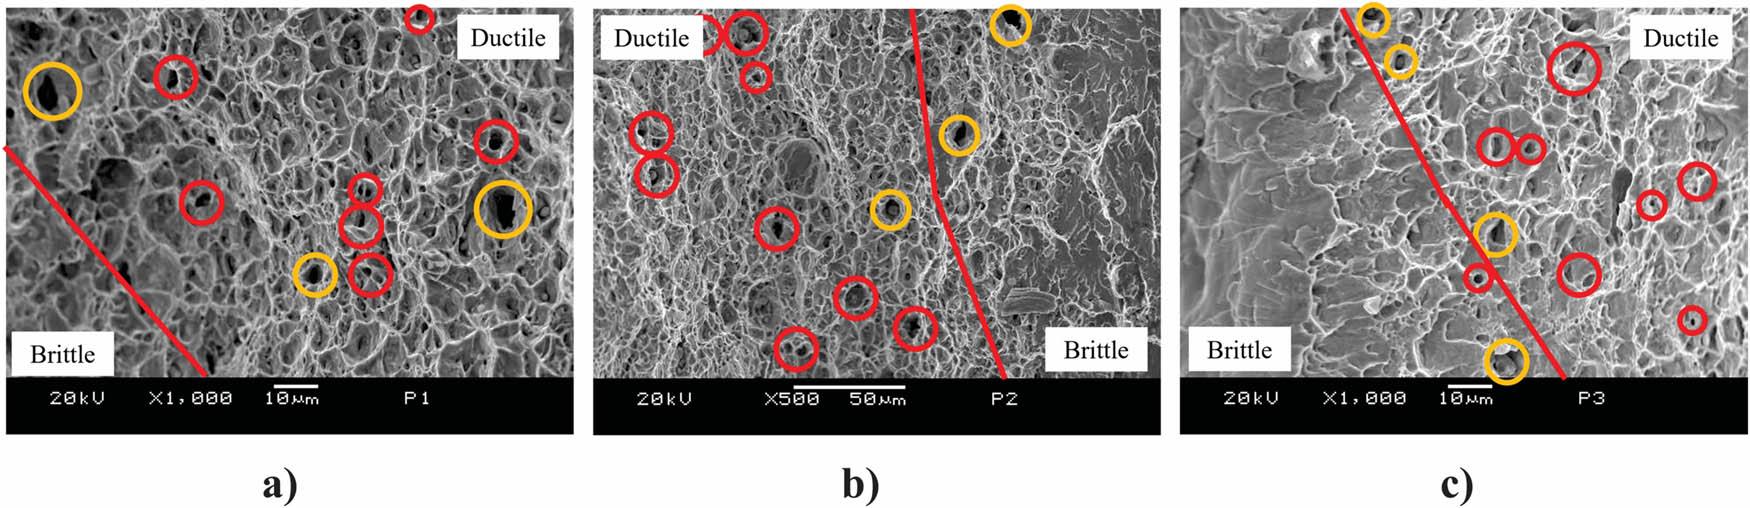
SEM photomicrographs of the DP steel corresponding to sample 4 after being subjected to the impact test: (a) specimen 1, (b) specimen 2, and (c) specimen 3.
The conclusions that can be drawn from the results of the present work are the following:
-
The study of the behavior of CCT diagrams as a function of chemical composition is a potential tool for the manufacture of hot-rolled DP steel plates. These steels can be obtained by small chemical modifications of a commercial AISI 1018 steel grade.
-
The combination of processing parameters and controlled cooling has a decisive influence on the number of phases in the final product. Low deformation and a rolling finish temperature close to Ac3 promote the formation of microstructures that are predominantly composed of martensite. In contrast, a higher percentage of thickness reduction and finishing temperatures in the range Ac1 < T < Ac3 favor the formation of a greater amount of ferrite due to the reduced amount of austenite available in this region for γ → α′ phase transformation during cooling. This behavior suggests that a critical deformation percentage can be established for the manufacture of DP steel, with phase equilibrium obtained directly from the hot rolling process by controlling only the cooling rate.
-
Using a thickness reduction of 40% and a cooling rate of 30°C s−1 allowed obtaining a DP steel composed of 55α + 45α´ under industrial requirements. The contribution of both phases produced a good combination between UTS, elongation at fracture, and impact resistance. In general, the steels manufactured satisfy the requirement of mechanical properties necessary in DP steels.
-
The findings of this research suggest that it is possible to use the developed methodology for the manufacture of DP steel plates by hot rolling without subsequent processing steps, which represents a significant advantage for industrial processes. It also significantly reduces costs and saves energy.
The authors want to acknowledge the TecNM-ITM, Investigadores por México CONACyT and CONACyT for their continuous support to Doctoral Scholarship 4037968 and SNI for the permanent support to the academic groups.
Authors state no funding involved.
Conceptualization, N.L. and C.H.; methodology, V.G.; software, E.G.; validation, J.R.; investigation, V.G. and N.L; resources, E.G. and N.H.; writing – original draft preparation, N.L.; writing – review and editing, C.A. and V.G.
Authors state no conflict of interest.