Figure 1
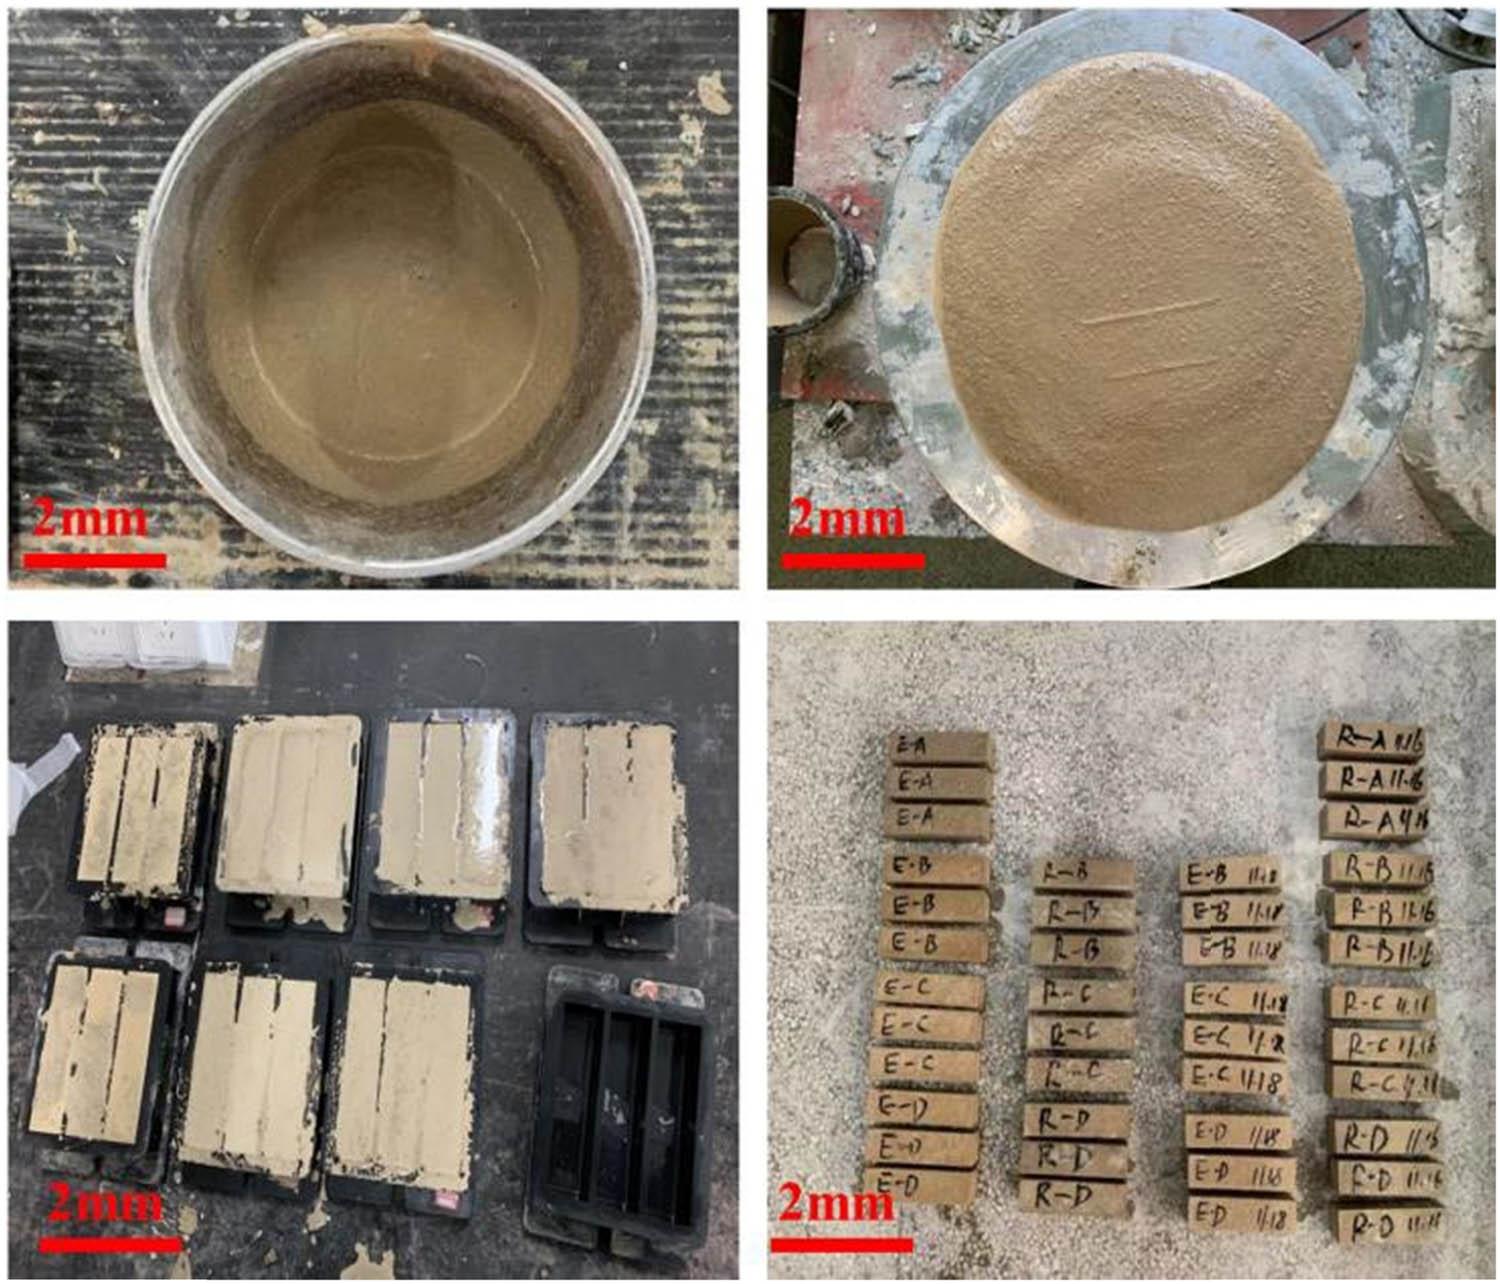
Figure 2
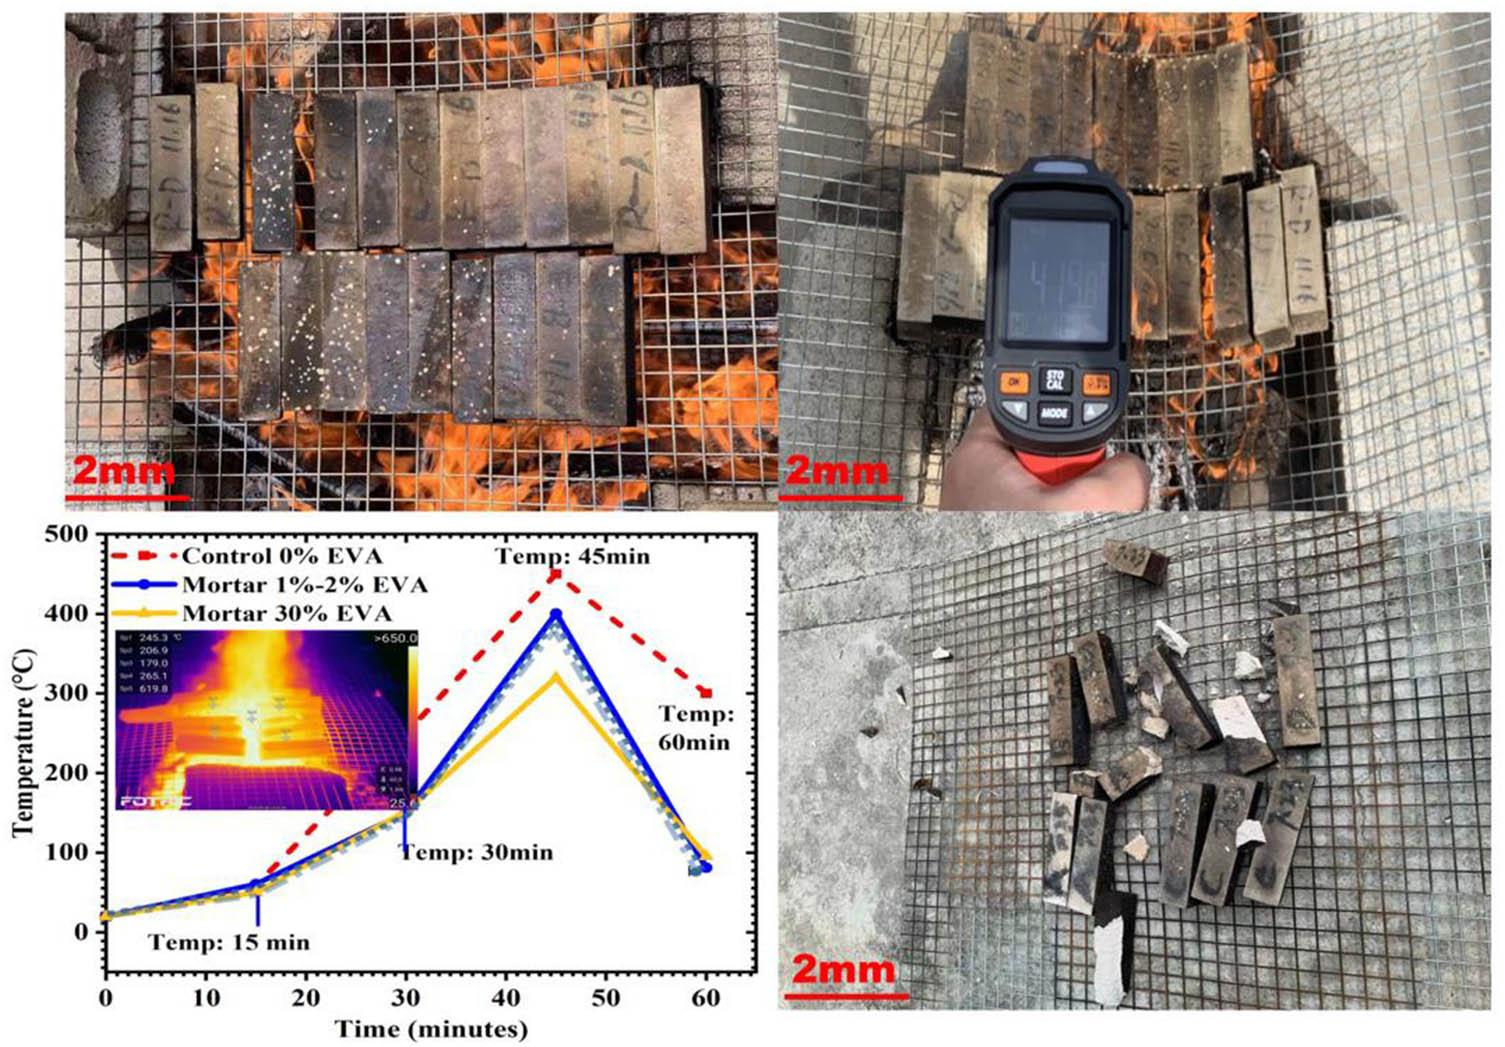
Figure 3
Figure 4
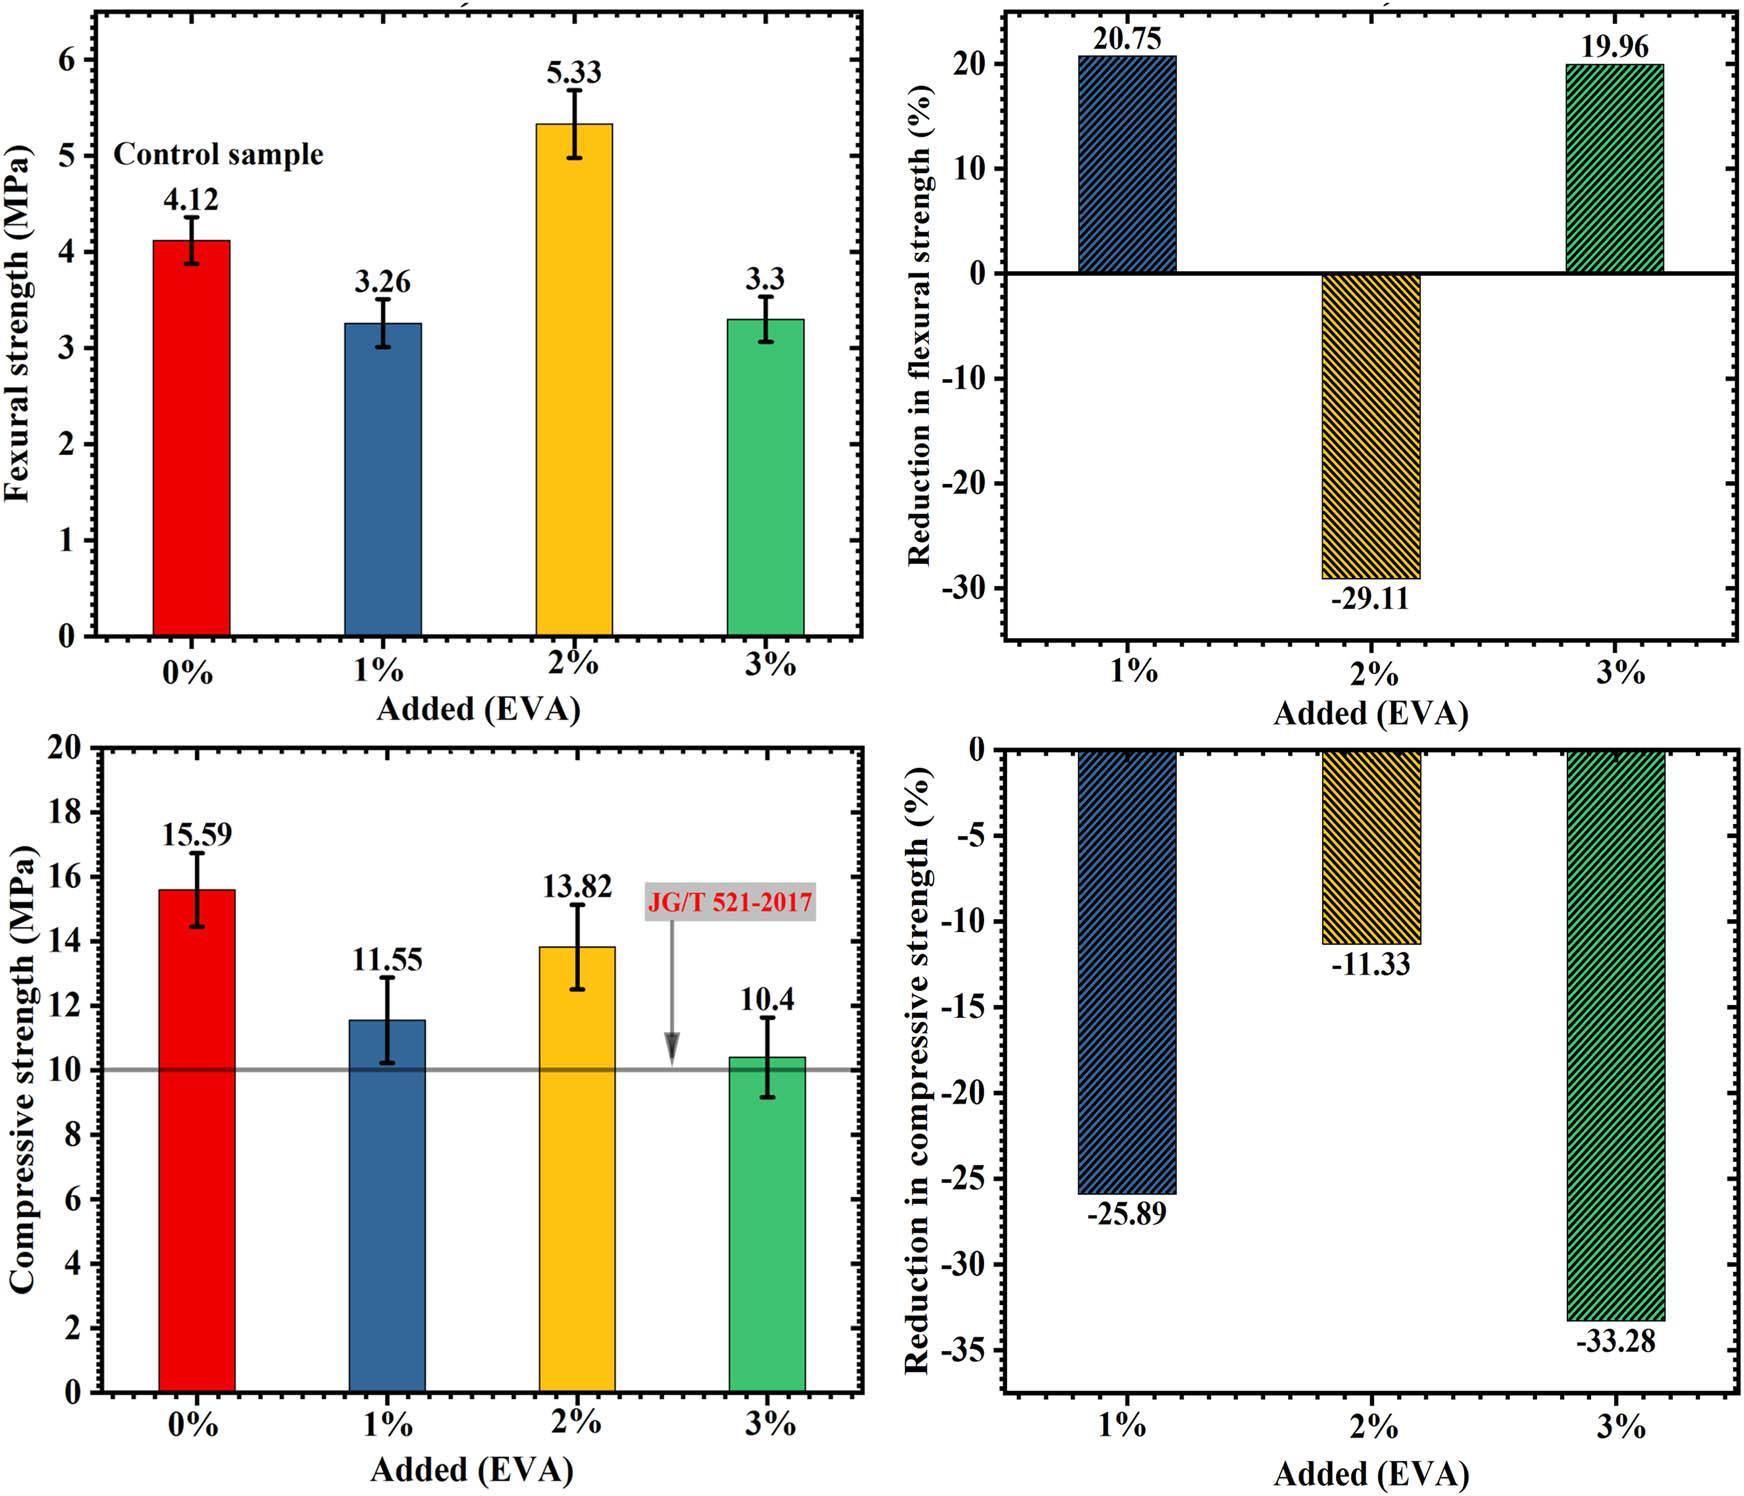
Figure 5
Figure 6
Figure 7
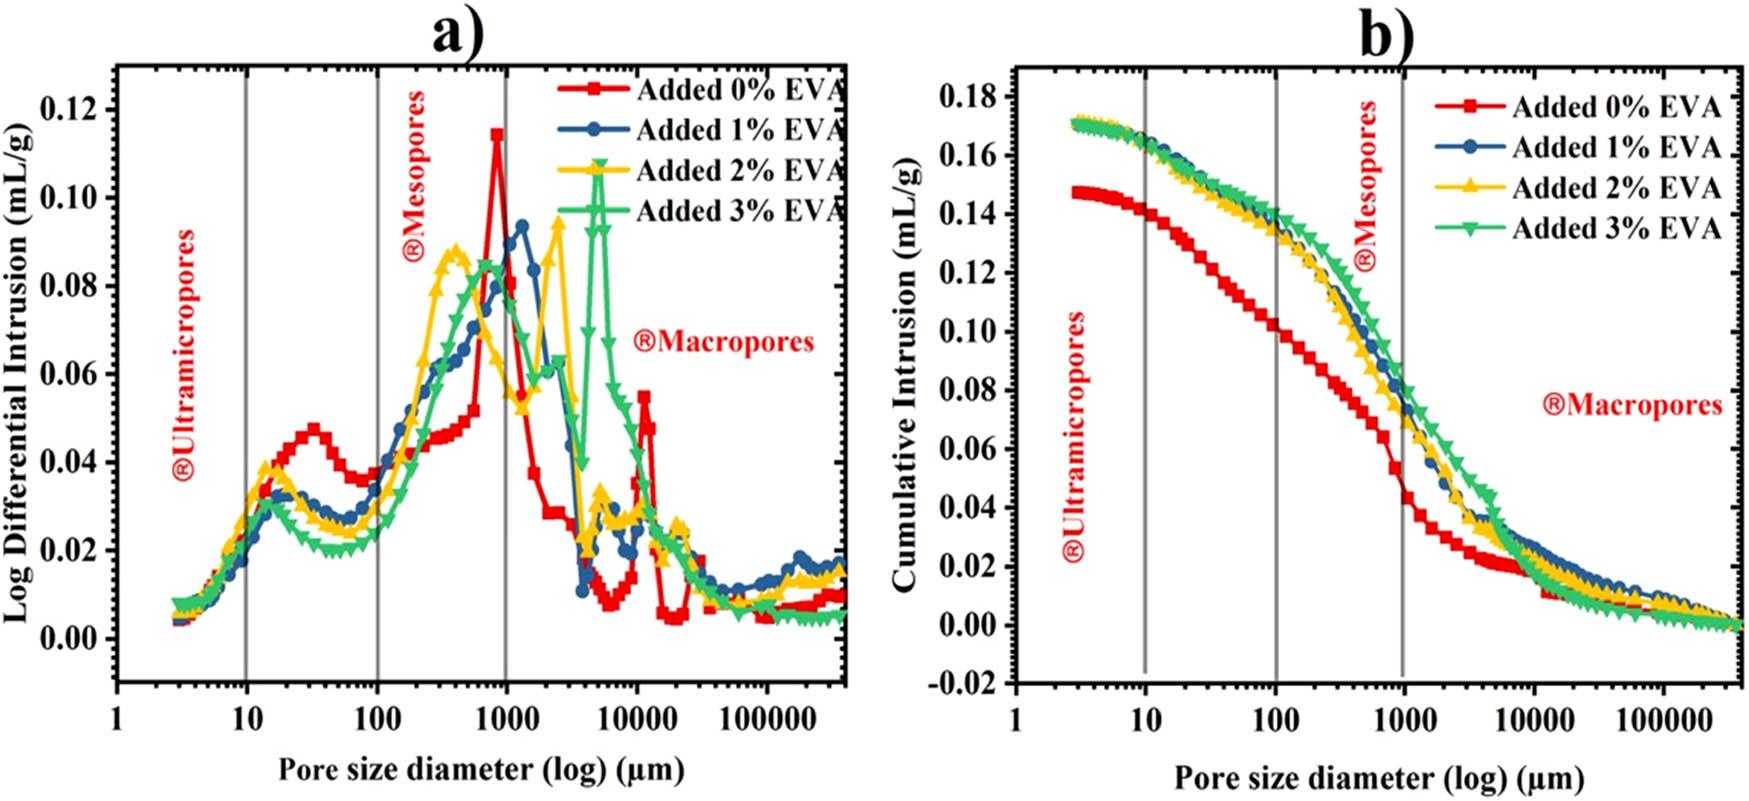
Figure 8
j_msp-2025-0021_tab_004
| Oxide | SiO2 | Al2O2 | Fe2O3 | MgO | SO3 | Na2O | K2O | Cao | Specific gravity | |
|---|---|---|---|---|---|---|---|---|---|---|
| Compositions | (g/cm3) | 3.1 | ||||||||
| Weight (%) | 7.5 | 35 | 1.5 | — | 15.5 | — | — | 41.0 | ||
| Mineralogical phase composition | C2S | C4A3$ | C11A7F | CaSO4 | Fluor-elpasolite | Others | Specific surface (m2/kg) | |||
| 450 | ||||||||||
| Weight (%) | 18 | 60 | 4.4 | 9.9 | 4.5 | 3.2 | ||||
Summary of the MIP testing of EVA PMCSAC mortars_
| Group | Average values parameters | |||
|---|---|---|---|---|
| Total intrusion volume (mL/g) | Total pore area (m2/g) | Median pore diameter (nm) | Tortuosity (%) | |
| 0% EVA added | 0.147 | 10.87 | 13.22 | 3.00 |
| 1% EVA added | 0.170 | 9.26 | 13.36 | 3.48 |
| 2% EVA added | 0.171 | 10.69 | 11.36 | 17.20 |
| 3% EVA added | 0.170 | 9.39 | 10.36 | 3.72 |
Mixing of the EVA PMCSAC mortar samples_
| Number of samples | CSAC (g) | Sand (g) | EVA content (%) | Water (g) | Water reducer (%) |
|---|---|---|---|---|---|
| A | 450 | 1,350 | 0 | 225 | 0.5 |
| B | 450 | 1,350 | 1.0 | 225 | 0.4 |
| C | 450 | 1,350 | 2.0 | 225 | 0.3 |
| D | 450 | 1,350 | 3.0 | 225 | 0.2 |
Compressive and flexural strength analysis of EVA-enhanced CSAC mortars following direct fire exposure_
| Sample group | Mean compressive strength | Std. Dev. compressive | Confidence interval | Mean flexural strength | Std. Dev. flexural | Flexural confidence interval |
|---|---|---|---|---|---|---|
| 0% EVA (Control, Sample A) | 15.2585 | 2.2574 | (12.9605, 17.5565) | 4.228 | 0.5764 | (3.663, 4.793) |
| 1% EVA (Sample B) | 11.8875 | 2.7735 | (9.5886, 14.1864) | 3.2668 | 0.1638 | (3.2516, 3.2804) |
| 2% EVA (Sample C) | 13.1567 | 3.2475 | (10.4839, 15.8295) | 5.6865 | 0.8920 | (4.6680, 6.7040) |
| 3% EVA (Sample D) | 10.7400 | 3.3218 | (8.0790, 13.4010) | 3.3040 | 0.2213 | (3.2281, 3.3799) |