High-entropy alloys (HEAs) were first studied and reported by Yeh et al. [1] in the year 2004, in which multicomponent solid solutions consisting of four or more equimolar or near-equimolar elements ranging from 5 to 35% were involved. A stabilized single-phase solid solution could be attained through the mixing of a high configurational entropy effect produced by incorporating several metallic elements. This kind of multi-component HEA has received more attention recently due to its unique microstructures, and improved physical and mechanical properties due to high mixing entropy, sluggish diffusion, and lattice distortion effects [2,3,4,5,6,7,8]. In contrast, traditional alloys have one principal element that constitutes at least 50% of the alloy content, and the desired microstructure and properties are achieved by adding minor elements, such as iron (Fe), aluminum (Al), copper (Cu), and magnesium (Mg) [6,7]. HEAs can serve in several fields, including acting as intermediate layers for soldering and brazing between different alloys and between alloys and carbides [9,10]. Further, these multicomponent alloys exhibit superparamagnetic and ferromagnetic behavior, which can be used in soft magnetic materials. In addition, HEAs have potential applications in nuclear-powered engineering due to their high resistance to irradiation and corrosion. Hence, it was suggested to be used as shielding materials for pressure vessels and nuclear fuels. Further, HEAs can be applied as thermal barrier coatings for refractory components and are potential candidates for making cutting tools due to their extremely high hardness and strength [11]. However, most HEAs involve the addition of two or three heavy metallic elements, leading to an increase in weight, which diminishes in aerospace, transportation, and other industries requiring lightweight materials. To address this issue, lightweight high-entropy alloys (LWHEAs) can be developed by incorporating lightweight metallic elements [12,13,14,15,16].
LWHEA families possess a mix of low-density elements such as Al, Mg, Li, Si, Be, Sc, and Ti [17]. Mechanical alloying (MA) is the common technique used to produce LWHEAs due to the wide differences in their melting points [17]. Based on thermodynamic principles, single-phase LWHEAs were developed with enhanced mechanical properties [18]. Al-Ti-V-Co-Ni LWHEAs were developed with a density of 6.24 g/cm3 and excellent compressive strength at 25 and 600°C [19]. Al15Zr40Ti28Nb12Cr5, Al15Zr40Ti28Nb12Mo5, and Al15Zr40Ti28Nb12Si5 LWHEAs were fabricated by arc melting, which displayed superior compressive yield strengths of 1.36, 1.27, and 1.35 GPa, respectively [20]. The MgAlSiCrFeNi LWHEA, prepared by MA and spark plasma sintering (SPS), exhibited an excellent hardness of around 10 GPa [21]. The TiAlVNbMo refractory LWHEA was developed using arc melting, which revealed excellent strength and plasticity up to 1,000°C [22].
Youssef et al. [23] developed a new single-phase face-centered cubic (FCC) LWHEA with a density of 2.670 g/cm3 based on the elemental composition of Al20Li20Mg10Sc20Ti30. They used MA to synthesize this alloy and reported that it exhibited a combination of low density and high hardness, surpassing all other metal materials. Tseng et al. [24] studied an LWHEA with the composition of Al20Be20Fe10Si15Ti35. The material was fabricated using vacuum arc melting in a copper mold. The castings were remelted several times to achieve a homogeneous structure. This alloy exhibited a density of 3.910 g/cm3 and a Vickers hardness of 911 HV, along with high oxidation resistance up to 900°C. Yang et al. [25] investigated a series of LWHEAs based on the composition of Al-Li-Mg-(Sn, Cu, Zn). Induction melting under argon gas was used for alloy production. Al80Li5Mg5Zn5Sn5 and Al80Li5Mg5Zn5Cu5 alloys were reported to exhibit a single-phase stabilized FCC crystalline structure with a density lower than 4.54 g/cm3. Their results indicated that the high concentrations of Al, Li, and Mg resulted in mixing entropy insufficient for a stable solid solution phase. Stepanov et al. [26] studied the structure and properties of an Al-Nb-Ti-V LWHEA. This alloy displayed a body-centered cubic (BCC) structure with a density of 5.59 g/cm3. It exhibited a compressive yield strength of 1,020 MPa at room temperature (RT), 685 MPa at 800°C, and 158 MPa at 1,000°C. Hammond et al. [27] developed an AlFeMgTiZn LWHEA using MA and equal channel angular extrusion. The alloy displayed a compressive strength of 1 GPa at RT, with strength decreasing at higher temperatures. A fracture strain exceeding 40% was observed during high-temperature testing.
Li et al. [28] developed LWHEAs with the composition Mg x (MnAlZnCu)100–x , where x = 20, 33, 43, 45.6, and 50 at%. The Mg20(MnAlZnCu)80 alloy exhibited a hexagonal close-packed (HCP) structure, with compressive strength ranging from 400 to 500 MPa, plasticity from 4.83 to 3.29%, and hardness from 178 to 431 HV. The density of the alloys ranged from 2.20 to 4.29 g/cm3. Stepanov et al. [29] studied Al x NbTiVZr alloys, where x = 0, 0.5, 1, and 1.5. Arc melting under high-purity argon was used for alloy synthesis, with casting performed in a copper mold. The increase in aluminum content reduced the alloy density from 6.49 g/cm3 (NbTiVZr) to 5.55 g/cm3 (Al1.5NbTiVZr). Microhardness increased with aluminum content, with NbTiVZr alloy exhibiting 379 HV and Al1.5NbTiVZr alloy displaying 619 HV. The NbTiVZr alloy showed a yield strength of 1,320 MPa and a ductility of 4.2%. Kumar and Gupta [30] summarized the properties of LWHEAs, including their density, structure, hardness, strength, and fracture strain.
The research on LWHEAs has made significant strides, yet several gaps remain unaddressed. One major limitation is the narrow focus on specific compositions, with limited exploration of broader multicomponent systems. Elements such as Mg, Al, Ti, Li, and Si possess an excellent combination of low density and superior mechanical properties. However, their potential in LWHEAs has not been fully investigated. Additionally, while various LWHEAs have been developed, comprehensive studies on their microstructure–property relationships, particularly for alloys incorporating lightweight elements, remain scarce. This research aims to bridge these gaps by synthesizing a novel Mg30-Al25-Ti25-Li15-Si LWHEA using MA with varying milling times. The alloy is systematically characterized using X-ray diffraction (XRD), scanning electron microscopy (SEM), and transmission electron microscopy (TEM) to analyze phase formation, grain structure, and defect density. Furthermore, structural refinement in terms of the crystallite size, lattice strain, and dislocation density was examined using theoretical peak broadening models such as Scherrer, Williamson–Hall, and size–strain plot (SSP) methods. In addition, the study investigates the cold and high-temperature densification behavior to optimize the compaction process, establish the relationship between processing parameters and microstructure, and enhance the overall performance of LWHEAs.
The current research focuses on the synthesis and characterization of new Mg30-Al25-Ti25-Li15-Si5 LWHEAs. The lowest-density elements were selected for this study based on their density and atomic size. Table 1 illustrates the elements of interest with their significant properties, such as the atomic number, atomic radius, density, and melting point. These properties guided the selection of elements and alloys according to the HEA design concept [31,32,33]. Additionally, the melting temperatures listed in Table 1 inform the choice of the production technique. Given the wide differences in melting points, the MA method, a solid-state production process, was used to synthesize the proposed LWHEAs, avoiding challenges associated with large differences in melting temperatures.
A list of low-density elements selected for the present study [14].
| Element | Atomic number | Atomic radius (nm) | Melting temperature (K) | Density (g/cm3) |
|---|---|---|---|---|
| Mg | 24 | 0.1249 | 923 | 1.74 |
| Al | 26 | 0.1241 | 933.3 | 2.70 |
| Ti | 13 | 0.1432 | 1,941 | 4.50 |
| Li | 27 | 0.1251 | 453.5 | 0.53 |
| Si | 14 | 0.1153 | 1,687 | 2.33 |
High-purity elemental powders of Mg, Al, Ti, Li, and Si, with a purity of >99.9% and an average particle size of <44 µm (−325 mesh), were used as starting materials for the ball milling process. The designed alloy composition and powder processing parameters for the Mg30-Al25-Ti25-Li15-Si5 LWHEAs are presented in Tables 2 and 3. The MA process was carried out using a Pulverisette 5/2 classic line ball mill. The type of vial (250 ml capacity) employed was a tungsten carbide (WC) with an inner diameter of 75 mm, an outer diameter of 90 mm, and a depth of 90 mm; the ball material used was also WC with a diameter of 10 mm; the number of balls used in each run was 38 in each vial, maintaining a ball-to-powder weight ratio (BPR) of 15:1; and the total quantity of powder mixture per batch was 20 g. To prevent oxidation and cold-welding during milling, absolute ethanol with a purity of >99.99% was used as the process control agent. The pre-mixed elemental powders were mechanically alloyed at a rotation speed of 300 rpm for milling durations of 0, 5, 10, and 20 h, producing alloy samples coded as L1-0, L1-5, L1-10, and L1-20, respectively. The L1-0 sample corresponds to the pre-mixed powders that were not subjected to ball milling. The milling process followed a controlled sequence to minimize heat accumulation: a 15-min forward cycle, followed by a 15-min stop, then a 15-min reverse cycle, and another 15-min stop. This cycle was repeated continuously to achieve uniform and effective milling while avoiding excessive increases in temperature.
Chemical composition of the developed Mg30-Al25-Ti25-Li15-Si5 LWHEA.
| Mg | Al | Ti | Li | Si | |||||
|---|---|---|---|---|---|---|---|---|---|
| Wt% | At% | Wt% | At% | Wt% | At% | Wt% | At% | Wt% | At% |
| 30 | 24.57 | 25 | 18.45 | 25 | 10.40 | 15 | 43.03 | 5 | 3.55 |
Ball milling processing parameters of the developed Mg30-Al25-Ti25-Li15-Si5 LWHEA.
| Alloy code | Chemical composition | PBR | Milling speed | Milling time (h) |
|---|---|---|---|---|
| L1-0 | Mg30-Al25-Ti25-Li15-Si5 | 15:1 | 300 rpm | 0 (premixed Conditions) |
| L1-5 | 5 | |||
| L1-10 | 10 | |||
| L1-20 | 20 |
The Mg30-Al25-Ti25-Li15-Si5 processed alloy samples were characterized using various advanced techniques. Phase identification was conducted using XRD with a Cu-Kα radiation source. The samples were scanned at a rate of 0.6°/min with a step size of 0.01° over a 2θ range of 20–80°. The raw XRD data were analyzed using X’Pert High Score Plus software to identify the phases present. The Debye–Scherrer method and various peak-broadening models were also used to determine the crystallite size and lattice strain. The size and morphology of the starting powders and processed alloy powders were studied using a field emission gun scanning electron microscope (FEGSEM). The chemical composition and elemental distribution of the processed powders were characterized using EDS detectors attached to an FEGSEM, with data analyzed using EDAX-TEAM innovative software. TEM was employed to examine the nanostructures and lattice distortions of the developed alloys.
The continuous compaction behavior of the processed Mg30-Al25-Ti25-Li15-Si5 alloy powders was investigated through uniaxial die compaction tests performed at RT and high temperatures of 275 and 550°C [34]. The compaction experiments utilized a die fabricated from H13 tool steel with an inner diameter of 15 mm, upper and lower plungers with outer diameters of 15 mm, and an ejector with a 12 mm outer diameter for sample ejection. The tests were conducted using an MTS universal testing machine with a 250 kN capacity and TextWorks software. The machine was operated at a crosshead speed of 1 mm/min. The processed powders were loaded into the die and compressed up to 200 MPa to produce density–pressure curves. For each composition and milling condition, at least three samples were compacted, and the average values were considered for further analysis. The compaction data were analyzed in three stages, namely, particle rearrangement and packing stage (10–50 MPa), elastic deformation of the powder particles (50–100 MPa), and plastic deformation and densification stage (100–200 MPa).
The Mg30-Al25-Ti25-Li15-Si5 LWHEA was successfully developed via MA, utilizing elements selected based on their properties to achieve optimal performance. Table 4 illustrates the fundamental properties of the constituent elements, such as atomic radius, electronegativity, valence electron count (VEC), atomic weight, melting temperature, and density. These properties are critical in designing the alloy to ensure low density, high strength, and thermal stability. The variation in atomic radii and melting points necessitated the use of MA, a solid-state synthesis method capable of overcoming the challenges posed by significant differences in these parameters. The enthalpy of mixing (∆H mix) values, shown in Table 5, reveal the thermodynamic compatibility between the elements in the alloy. Notably, negative enthalpy values such as those between Mg and Si (−26 kJ/mol) and Al and Si (−19 kJ/mol) indicate strong chemical affinity, favoring the formation of stable intermetallic phases. The positive ∆H mix values, such as between Mg and Ti (16 kJ/mol), suggest partial immiscibility, which can lead to nanostructured or multiphase alloys. This balance between positive and negative enthalpy values contributes to the stabilization of a high-entropy solid solution phase, as supported by thermodynamic criteria for HEAs [1–6,26,30,35]. Table 6 highlights the key physicochemical and thermodynamic properties of the developed alloy powders. The alloy exhibits a mixing enthalpy (∆H mix) of −0.4205 kJ/mol, indicating thermodynamic stability. The entropy of mixing (∆S mix) of 11.42 J/mol K supports the formation of a high-entropy solid solution, while the Gibbs free energy (∆G mix) of −3,823 J/mol further confirms the thermodynamic feasibility of single-phase stabilization. The high melting temperature (T m = 855.8 K) and parameter (Ω = 15.82) of the alloy suggest strong thermal stability, which is suitable for high-temperature applications. Additionally, the atomic size difference (δ = 5.93%) and VEC of 1.704 indicate favorable conditions for forming stable solid solutions while avoiding brittle intermetallic phases. The formation of solid solutions, along with the necessary conditions to have better properties in HEAs, was discussed by Ye et al. [2], Kumar and Gupta [30], and Sivasankaran et al. [31].
Properties of the elements used in the present study to develop the Mg30-Al25-Ti25-Li15-Si5 alloy.
| Element | Atomic number | Atomic radius (nm) | Pauling electronegativity | VEC | Atomic weight | Melting temperature (K) | Density (g/cm3) |
|---|---|---|---|---|---|---|---|
| Mg | 24 | 0.1249 | 1.660 | 6 | 51.9961 | 2,180 | 7.2 |
| Al | 26 | 0.1241 | 1.833 | 8 | 55.8450 | 1,811 | 7.9 |
| Ti | 13 | 0.1432 | 1.610 | 3 | 26.9815 | 933 | 2.7 |
| Li | 27 | 0.1251 | 1.880 | 9 | 58.9332 | 1,768 | 8.9 |
| Si | 14 | 0.1153 | 1.900 | 4 | 28.0855 | 1,687 | 2.3 |
Enthalpy of mixing (
| Element | Mg | Al | Ti | Li | Si |
|---|---|---|---|---|---|
| Mg | Mg | −2 | 16 | 0 | −26 |
| Al | −2 | Al | −30 | −4 | −19 |
| Ti | 16 | −30 | Ti | 34 | −66 |
| Li | 0 | −4 | 34 | Li | −30 |
| Si | −26 | −19 | −66 | −30 | Si |
Bold value represents the element symbols.
Physicochemical and thermodynamic properties for the Mg30-Al25-Ti25-Li15-Si5 developed alloy powders via MA.
| Alloy code | Mixing enthalpy, ΔH mix (kJ/mol) | Entropy of mixing, ΔS mix (J/mol K) | Gibbs free energy, | Melting temperature, T m (K) | Thermodynamic parameter, Ω | Mean atomic radius, | Atomic size difference, δ (%) | Valency electron concentration, VEC | Difference in Pauling electronegativity, | Density, ρ (g/cm3) |
|---|---|---|---|---|---|---|---|---|---|---|
| L1-0, L1-5, L1-10, and L1-20 | −0.4205 | 11.42 | −3,823 | 855.8 | 15.82 | 0.1504 | 5.93% | −0.4205 | 11.42 | 1.704 |
The SEM analysis of as-received elemental powders (Figure 1) revealed distinct morphologies and particle sizes for Mg, Al, Ti, and Si. Mg exhibited irregular, plate-like, or flaky particles with an average size of 65 ± 3.78 µm, while Al showed elongated, irregular morphologies with a smaller particle size of 3.87 ± 0.85 µm. Ti displayed irregular dendritic structures with an average size of 22.46 ± 2.47 µm, and Si particles were observed to have irregular and flaky shapes with an average size of 13.78 ± 4.78 µm. These particle morphology variations are attributed to each element’s intrinsic properties, such as ductility (e.g., Mg and Al), brittleness (e.g., Si), and the production methods used for the elemental powders. However, due to the low atomic number and high reactivity of Li, its analysis via SEM was not feasible. This limitation is inherent to the imaging technique, as Li’s low electron density and rapid surface oxidation hinder its detection.

Surface morphology of as-received elemental powders used to synthesize LWHEA in this work by SEM: (a) Mg, (b) Al, (c) Ti, and (d) Si.
The SEM analysis of mechanically alloyed Mg30-Al25-Ti25-Li15-Si5 powders after different milling times (5, 10, and 20 h) is shown in Figure 2. At 5 h of milling, the powders exhibited irregular and equiaxed morphologies with an average particle size of 1.74 ± 0.25 µm. With increased milling time to 10 h, the particle size was significantly reduced to 0.68 ± 0.35 µm, and by 20 h, the powders attained an average size of 0.57 ± 0.47 µm. This progressive reduction in the particle size is primarily due to the intense plastic deformation, fracturing, and cold-welding processes induced by high-energy milling. The irregular and equiaxed morphologies suggest a dynamic equilibrium between fracturing and welding during milling, leading to the refinement and homogenization of particles. The formation of equiaxed powder surface morphologies in various HEAs was also observed by Li et al. [28] while developing Mg x (MnAlZnCu)100–x (x = 20, 33, 43, 45.6 and 50%) HEAs and by Addepalli et al. [36] when developing nanocrystalline CoCrNiTiMox (x = 1, 1.5 at%) HEAs.
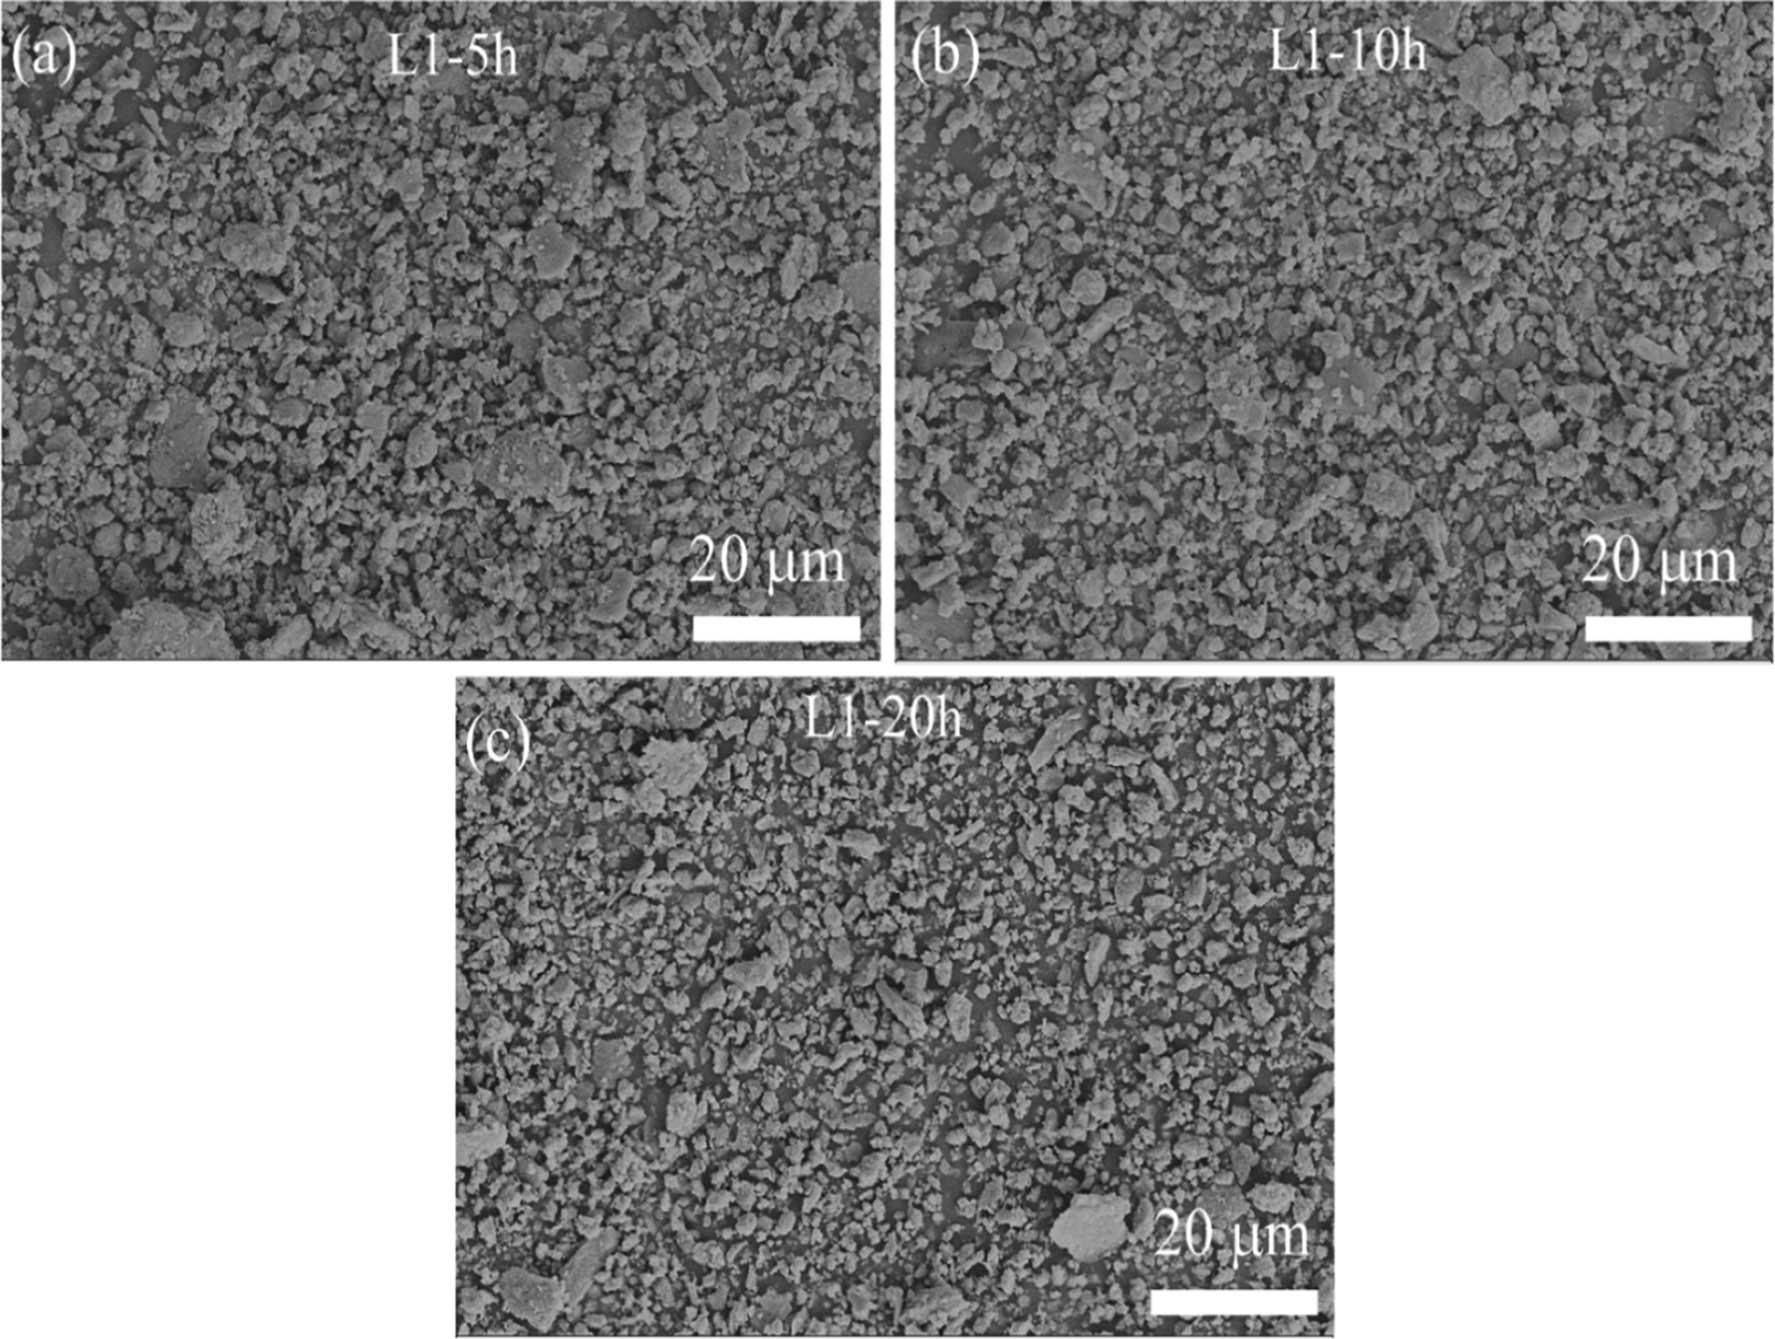
SEM images of the microstructures of MAed Mg30-Al25-Ti25-Li15-Si5 LWHEAs milled for different times (5, 15, and 20 h) showing powder surface morphology: (a) L1-5 h, (b) L1-10 h, and (c) L1-20 h.
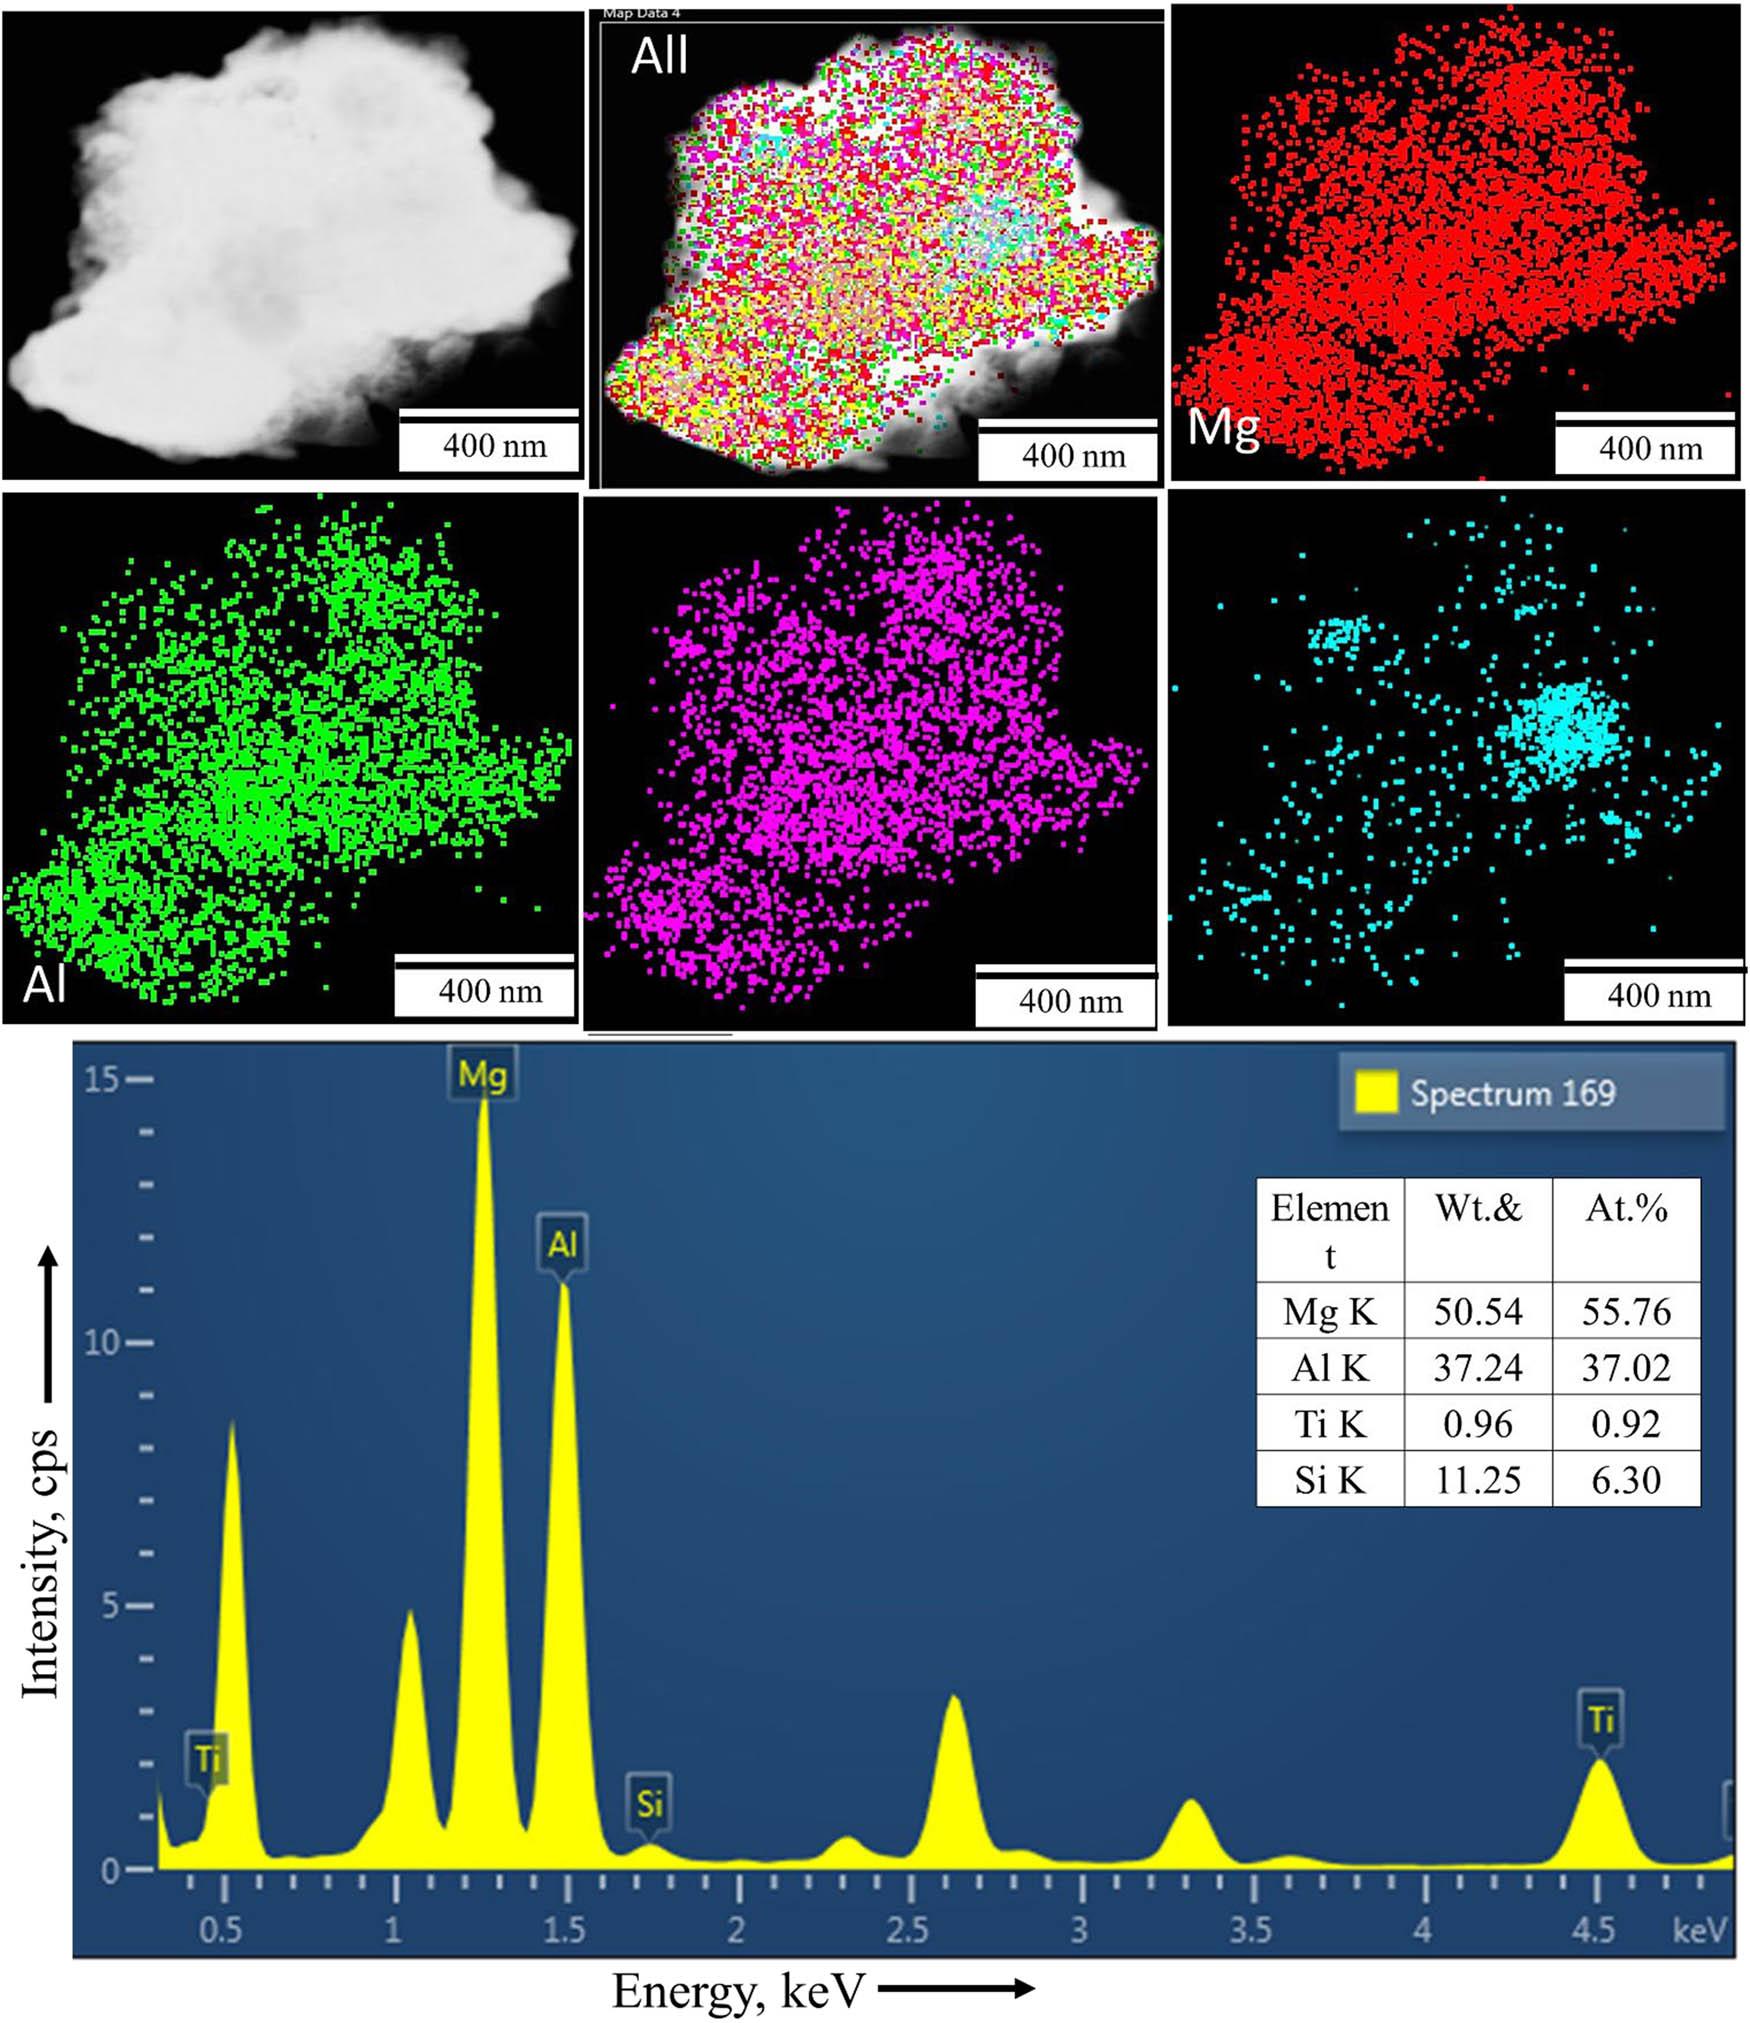
The SEM-EDAX spectra (Figure 3) confirmed the uniform distribution of elemental components (Mg, Al, Ti, and Si) in the alloy powders for all milling durations. The elemental compositions in both weight and atomic percentages were consistent with the nominal composition of Mg30-Al25-Ti25-Li15-Si5, indicating the successful incorporation of the individual elements into the alloy matrix. The increasing homogeneity observed with prolonged milling time is attributed to enhanced diffusion and atomic mixing facilitated by repeated impact during MA. The same phenomenon was also reported by Kumar and Gupta [30], Sivasankaran et al. [31,32], Soundararajan et al. [33], and Addepalli et al. [36] when developing different HEAs.

SEM images of the microstructures with EDAX analyses of MAed Mg30-Al25-Ti25-Li15-Si5 LWHEAs milled for different times (5, 15, and 20 h) showing element composition (both wt% and at%): (a) L1-5 h, (b) L1-10 h, and (c) L1-20 h.
The elemental mapping results (Figure 4) further supported the findings from EDAX analyses, demonstrating the uniform distribution of Mg, Al, Ti, and Si throughout the powder particles. At 5 h, minor segregation of elements was observed, likely due to incomplete alloying at the early milling stages. By 10 h, the elemental distribution became more uniform, and at 20 h, a homogeneous distribution of all elements was achieved, indicating successful alloy formation. The progressive homogenization (after 20 h) reflects the increased diffusion and mixing energy imparted by prolonged milling. The same finding was also observed by Kumar et al. [30].

SEM images of the microstructures with elemental mapping of MAed Mg30-Al25-Ti25-Li15-Si5 LWHEAs milled for different times (5, 15, and 20 h) showing the distribution of the incorporated elements and alloy formation (first from left image: SE SEM microstructure; immediate right of four images: mapping of Mg, Al, Ti, and Si): (a) L1-5 h, (b) L1-10 h, and (c) L1-20 h.
The XRD analysis of the as-received elemental powders, presented in Figure 5, reveals the distinct crystalline structures of the individual components used in developing the Mg30-Al25-Ti25-Li15-Si5 LWHEAs. The diffraction peaks correspond to the characteristic planes of each element in Figure 5: (a) Mg exhibits sharp peaks, indicating an HCP structure; (b) Al shows the typical FCC lattice; (c) Ti displays a hexagonal structure; (d) Li is characterized by its BCC configuration; and (e) Si demonstrates the diamond cubic structure. These observations confirm the high purity and crystalline nature of the initial powder, which are the basis for the alloy synthesis via MA. Figure 6 illustrates the XRD patterns of the Mg30-Al25-Ti25-Li15-Si5 LWHEA powders milled for different durations: 0 h (L1-0 h), 5 h (L1-5 h), 10 h (L1-10 h), and 20 h (L1-20 h). The XRD analysis of the milled Mg30-Al25-Ti25-Li15-Si5 powders revealed several distinct peaks corresponding primarily to the HCP crystal structure of the alloy (JCPDS No: 00-004-0770), as well as the intermetallic phases Mg2Si (JCPDS No: 00-035-0773) and Al12Mg17 (JCPDS No: 00-001-1128). It was observed that the peaks associated with Mg2Si and Al12Mg17 exhibited minor intensities at 10 h. However, as the milling time increased to 20 h, the peak of Mg2Si decreased, and the peak of Al12Mg17 increased. The observed variation in the peak intensities of Mg2Si and Al12Mg17 phases with milling time can be attributed to the kinetics of phase formation and thermodynamic stability [38]. At 10 h of milling, Mg2Si forms readily due to its initial stability. However, as milling progresses to 20 h, the enhanced diffusion and redistribution of elements favor the formation of Al12Mg17, which is thermodynamically more stable under prolonged milling conditions. Additionally, the mechanical energy induces grain refinement and partial amorphization of Mg2Si, reducing its peak intensity, while Al12Mg17 crystallinity increases, leading to a dominance of its phase. The observed formation of Mg2Si and Al12Mg17 nanocrystalline phases during MA was also reported by Yang et al. [25] and Stepanov et al. [26]. In addition, as the milling time increases to 10 h, the XRD patterns exhibit further peak broadening and a decrease in peak intensity, signaling enhanced diffusion and homogenization among the constituent elements [39]. After 20 h of milling, the XRD peaks become broader and less distinct, suggesting the formation of a nanocrystalline or partially amorphous structure. The disappearance of some elemental peaks and the emergence of new peaks align with the formation of solid solution phases, consistent with HEA characteristics. These changes are attributed to repeated fracturing, cold welding, and severe plastic deformation during high-energy ball milling, which facilitates atomic mixing and the stabilization of high-entropy phases. These findings were also reported by Jeong and Lee [18] during the development of single-phase LWHEAs.

XRD peaks of the as-received elemental powders of (a) Mg, (b) Al, (c) Ti, (d) Li, and (e) Si.

XRD patterns of the milled Mg30-Al25-Ti25-Li15-Si5 LWHEA powders for different durations: (a) L1-0 h, (b) L1-5 h, (c) L1-10 h, and (d) L1-20 h samples.
The peak broadening technique is a well-known method for measuring crystal size and lattice strain in the developed nanocrystalline LWHEAs. The observed reduction in the crystallite size and increased lattice strain with milling duration were quantified using peak broadening models such as the Scherrer and Williamson–Hall methods. To obtain accuracy in the material properties, first, instrumental broadening must be corrected for all the peaks, and it is expressed using the following equation [21]:
The crystal size of the Mg30-Al25-Ti25-Li15-Si5 LWHEA powders was determined using the Scherrer model, in which the crystal size is calculated based on peak broadening observed in the XRD patterns. The Scherrer equation assumes negligible strain effects and estimates the crystal size (D) using the following relationship [37]:

Scherrer model: (a) Mg30-Al25-Ti25-Li15-Si5 (0 h), (b) Mg30-Al25-Ti25-Li15-Si5 (5 h), (c) Mg30-Al25-Ti25-Li15-Si5 (10 h), and (d) Mg30-Al25-Ti25-Li15-Si5 (20 h).
Estimation of the size and strain for different milled time durations of Mg30-Al25-Ti25-Li15-Si5 LWHEA powders.
| Sample/model | Parameter | Mg30-Al25-Ti25-Li15-Si5 (0 h) | Mg30-Al25-Ti25-Li15-Si5 (5 h) | Mg30-Al25-Ti25-Li15-Si5 (10 h) | Mg30-Al25-Ti25-Li15-Si5 (20 h) |
|---|---|---|---|---|---|
| Scherrer | Size (D) (nm) | 1422.14 | 1066.7100 | 719.3300 | 618.4100 |
| W-H UDM | Size (D) (nm) | 90.5700 | 89.0300 | 81.3200 | 73.7200 |
| Strain (ε) (%) | 0.0002 | 0.0013 | 0.0044 | 0.0097 | |
| W-H USDM | Size (D) (nm) | 47.0200 | 44.5000 | 34.5800 | 30.8000 |
| Strain (ε) (%) | 0.0004 | 0.0011 | 0.0032 | 0.0043 | |
| SSP | Size (D) (nm) | 98.0400 | 60.2200 | 54.1900 | 42.5300 |
| Strain (ε) (%) | 0.0001 | 0.0008 | 0.0010 | 0.0030 |
The crystal size and lattice strain of Mg30-Al25-Ti25-Li15-Si5 LWHEAs were estimated using the W-H UDM, which assumes isotropic strain across the crystallographic structure. The relationship between the broadening of XRD peaks (β cos θ) and the strain-induced distortion is expressed as follows [23]:
Linear fitting of the plot with
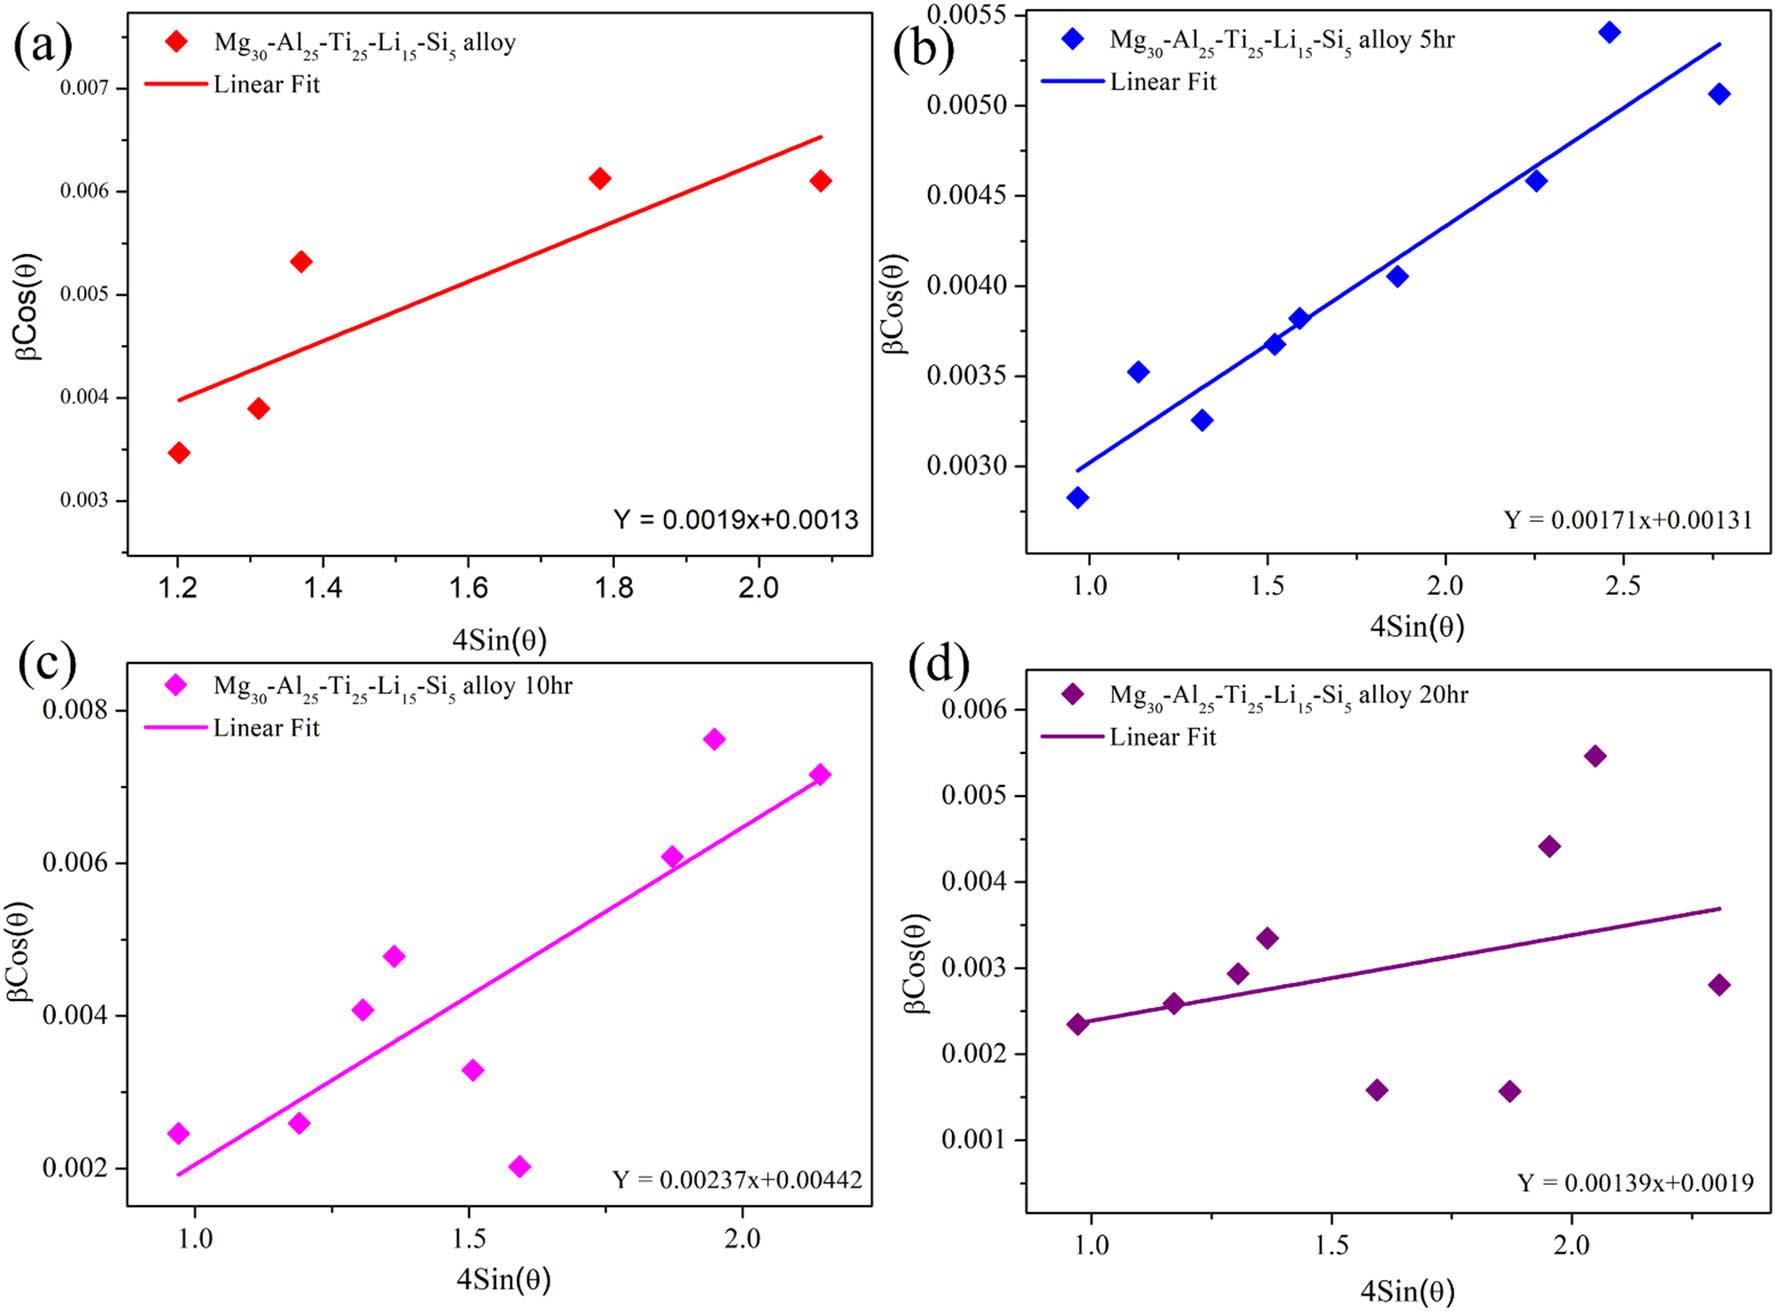
W-H UDM: (a) Mg30-Al25-Ti25-Li15-Si5 (0 h), (b) Mg30-Al25-Ti25-Li15-Si5 (5 h), (c) Mg30-Al25-Ti25-Li15-Si5 (10 h), and (d) Mg30-Al25-Ti25-Li15-Si5 (20 h).
The W-H USDM [25] was employed to evaluate the crystal size and lattice strain of Mg30-Al25-Ti25-Li15-Si5 LWHEAs by incorporating the effect of stress and modulus of elasticity into the analysis. Unlike isotropic models, the W-H USDM assumes anisotropic strain and expresses the relationship between peak broadening and stress using the modified equation (4) [37]:
The modulus of elasticity (
The linear fit of the plot between

W-H USDM: (a) Mg30-Al25-Ti25-Li15-Si5 (0 h), (b) Mg30-Al25-Ti25-Li15-Si5 (5 h), (c) Mg30-Al25-Ti25-Li15-Si5 (10 h), and (d) Mg30-Al25-Ti25-Li15-Si5 (20 h).
The calculated strain values were 0.0004% (0 h), 0.0011% (5 h), 0.0032% (10 h), and 0.0043% (20 h), indicating a progressive increase in lattice strain with milling time. This increase reflects the accumulation of defects and dislocations, which enhances the material’s grain boundary density and modifies its lattice spacing, and the same observations were reported elsewhere [36,39].
The SSP [27] method was utilized to estimate the crystal size and strain in Mg30-Al25-Ti25-Li15-Si LWHEA powders. The SSP approach combines both Gaussian and Lorentzian functions to separately evaluate the strain and crystal size. The Gaussian function accounts for crystal size estimation, while the Lorentzian function is used to assess the strain. The relationship between peak broadening and the microstructural parameters is described by equations (7)–(9) [37]:
In these equations,

SSP model: (a) Mg30-Al25-Ti25-Li15-Si5 (0 h), (b) Mg30-Al25-Ti25-Li15-Si5 (5 h), (c) Mg30-Al25-Ti25-Li15-Si5 (10 h), and (d) Mg30-Al25-Ti25-Li15-Si5 (20 h).
The structural evolution of Mg30-Al25-Ti25-Li15-Si5 LWHEA powders was analyzed using the X-ray peak broadening technique, focusing on parameters such as dislocation density, SFP, and excess free volume. Dislocation density (ρ) [30] was determined using equation (10) [37]:

Structural properties of Mg30-Al25-Ti25-Li15-Si5 (0, 5, 10, and 20 h) nanocomposite powders milled at different durations: (a) dislocation density, (b) excess free volume, (c) SFP, and (d) N–R parameter.
The excess free volume (δV) was estimated using equation (11):
The SFP (α) was calculated using equation (12) [31]:
The increase in α, as shown in Figure 11(c), indicates the generation of structural defects, primarily due to crystallographic misalignments caused by milling-induced deformation. Finally, the Nelson–Riley (N–R) parameter [32], depicted in Figure 11(d), reached its highest value of 4.164 Å for the 20 h milled sample, reflecting an 8.03% improvement compared to the pre-milled state. This increase signifies enhanced lattice refinement and improved structural uniformity, and the same observations have been reported elsewhere [33,35,39]. These findings collectively highlight the significant influence of milling time on the microstructural and mechanical behavior of the Mg30-Al25-Ti25-Li15-Si5 alloy powders.
The HRTEM analysis of Mg30-Al25-Ti25-Li15-Si5 LWHEA powders for varying milling durations (0, 5, 10, and 20 h) reveals significant microstructural evolution, as shown in Figure 12. The bright field image (BFI) of the 0 h sample (Figure 12a1) exhibits particle sizes in the range of 50–60 nm, as confirmed by measurements using Image J software. For the milled samples (Figure 12(a2–a4)), the crystal sizes decreased progressively with milling duration: approximately 35–40 nm for 5 h (Figure 12b2), 25–30 nm for 10 h (Figure 11b3), and 18–24 nm for 20 h (Figure 12b4). Additionally, a minor fraction of particles within the range of 5–15 nm was observed, indicating enhanced refinement with prolonged milling. The SAED patterns (Figure 12(c1–c4)) demonstrate the transition from incomplete ring structures in the 0 h sample to well-defined continuous rings in the 20 h milled sample, confirming the transition of the material into a nanocrystalline state. The refinement in the microstructure and the development of a nanocrystalline phase are consistent with increased mechanical energy input during extended milling [34]. The HRTEM-EDS mapping of the 20 h sample (Figure 13) confirms the uniform distribution of Mg, Al, Ti, and Si across the sample, supporting the effective alloying and homogeneity achieved during the milling process. The HRTEM EDS analysis of the 20 h sample (Figure 13) further validates the homogeneity of the elemental distribution for Mg, Al, Ti, and Si within the matrix. Notably, Li was not detected in the TEM results, which may be due to its low atomic number and weak electron scattering ability, making its identification challenging using this technique [2].

HRTEM analysis of MAed LWHEA powders for different milled duration times: (a1–a4) BFI, (b1–b4) DFI, and (c1–c4) SAED.
HRTEM – elemental mapping and EDS analyses of the Mg30-Al25-Ti25-Li15-Si5 (20 h) LWHEA powder samples.
The HR-TEM lattice fringe analysis of the Mg30-Al25-Ti25-Li15-Si5 LWHEA powders for varying milling durations (0, 5, 10, and 20 h) is presented in Figure 14. The lattice fringes corresponding to the (200) plane were distinctly observed for all samples, with noticeable variations in the d-spacing values as the milling duration increased [37]. For the 0 h sample (Figure 14(a)), several d-spacing values were observed (3.59784, 4.10538, 3.6906, 0.19233, 0.19733 nm), indicating the non-milling/no structural refinement of the Mg30-Al25-Ti25-Li15-Si5 alloy in its initial state. After 5 h of milling (Figure 14(b)), four different d-spacing values were observed (0.21591, 0.15173, 0.26973, and 0.20579 nm), indicating that the initial lattice distortion due to increasing milling time led to import mechanical energy input into LWHEA powders. As the milling duration increased to 10 h (Figure 14(c)), two almost similar d-spacing values were observed (0.21591 and 0.20579 nm), which were all lower compared to previous samples. This reduction suggests significant refinement in the crystal lattice and increased strain induced by the high-energy ball milling process. For the 20 h sample (Figure 14(d)), the two lowest and almost similar d-spacing values were noticed (0.20268 and 0.20112 nm), representing the smallest value among all samples. This continued reduction reflects a high degree of lattice compression and strain associated with prolonged MA and the nanocrystallization process [37].

HRTEM – lattice fringes of the Mg30-Al25-Ti25-Li15-Si5 LWHEA powder samples: (a) Mg30-Al25-Ti25-Li15-Si5 0 h, (b) Mg30-Al25-Ti25-Li15-Si5 – 5 h, (c) Mg30-Al25-Ti25-Li15-Si5 10 h, and (d) Mg30-Al25-Ti25-Li15-Si5 – 20 h lattice fringes correspond to (2 0 0).
The compaction behavior and relative density of Mg30-Al25-Ti25-Li15-Si5 LWHEA powders were analyzed for varying milling durations (0, 5, 10, and 20 h) under cold and hot compaction conditions, as shown in Figure 15 and Table 8. The compaction process was studied across three stages: particle rearrangement, elastic deformation, and plastic deformation. Both cold compaction (room temperature, RT) and hot compaction (275 and 550°C) demonstrated significant improvements in the relative density with increased compaction pressure, temperature, and milling time. During cold compaction, the relative density increased progressively with the milling time due to particle size refinement and enhanced particle rearrangement [41] facilitated by the reduction in the average particle size from 50 to 60 nm (0 h sample) to 18–24 nm (20 h sample). For the particle rearrangement stage at 20 MPa, the relative density of the 20 h milled sample (52.33%) was 8% lower than the 0 h sample (56.81%), reflecting the initial difficulty in packing finer particles. However, at the plastic deformation stage (150 MPa), the relative density of the 20 h sample (79.55%) improved by 6% compared to the 0 h sample (75.09%), demonstrating the densification advantage of smaller particles under high compaction pressures [41,42].

Compaction behavior of Mg30-Al25-Ti25-Li15-Si5 LWHEAs milled for different times (0, 5, 15, and 20 h) showing the behavior at various stages: (a) cold compaction at RT; (b) hot compaction at 275°C; and (c) hot compaction at 550°C.
Variation in relative density in different stages during compaction (both cold and hot compaction) as a function of compaction pressure and temperature for Mg30-Al25-Ti25-Li15-Si5 LWHEAs milled for different times (0, 5, 15, and 20 h).
| Sample | T (°C) | P (MPa) | Compaction stages | RD (%) | Sample | T (°C) | P (MPa) | Compaction stages | RD (%) |
|---|---|---|---|---|---|---|---|---|---|
| L1-0 h | RT | 20 | Particle rearrangement stage | 56.81 | L1-5 h | RT | 20 | Particle rearrangement stage | 55.85 |
| 30 | 61.55 | 30 | 60.43 | ||||||
| 40 | 65.56 | 40 | 64.30 | ||||||
| 50 | 68.97 | 50 | 67.57 | ||||||
| 60 | Elastic deformation stage | 71.95 | 60 | Elastic deformation stage | 70.42 | ||||
| 70 | 74.71 | 70 | 73.07 | ||||||
| 80 | 77.15 | 80 | 75.40 | ||||||
| 90 | 79.55 | 90 | 77.69 | ||||||
| 100 | 81.70 | 100 | 79.74 | ||||||
| 125 | Plastic deformation stage | 86.38 | 125 | Plastic deformation stage | 84.19 | ||||
| 150 | 90.38 | 150 | 87.98 | ||||||
| 175 | 94.22 | 175 | 91.62 | ||||||
| 200 | 97.40 | 200 | 94.63 | ||||||
| 275 | 20 | Particle rearrangement stage | 61.26 | 275 | 20 | Particle rearrangement stage | 60.43 | ||
| 30 | 65.34 | 30 | 64.39 | ||||||
| 40 | 68.67 | 40 | 67.62 | ||||||
| 50 | 71.68 | 50 | 70.54 | ||||||
| 60 | Elastic deformation stage | 74.34 | 60 | Elastic deformation stage | 73.11 | ||||
| 70 | 76.80 | 70 | 75.49 | ||||||
| 80 | 78.83 | 80 | 77.45 | ||||||
| 90 | 80.85 | 90 | 79.40 | ||||||
| 100 | 82.66 | 100 | 81.15 | ||||||
| 125 | Plastic deformation stage | 87.05 | 125 | Plastic deformation stage | 85.38 | ||||
| 150 | 91.17 | 150 | 89.33 | ||||||
| 175 | 94.90 | 175 | 92.91 | ||||||
| 200 | 98.36 | 200 | 96.22 | ||||||
| 550 | 20 | Particle rearrangement stage | 69.04 | 550 | 20 | Particle rearrangement stage | 68.47 | ||
| 30 | 72.42 | 30 | 71.80 | ||||||
| 40 | 75.13 | 40 | 74.46 | ||||||
| 50 | 77.51 | 50 | 76.79 | ||||||
| 60 | Elastic deformation stage | 79.73 | 60 | Elastic deformation stage | 78.98 | ||||
| 70 | 81.79 | 70 | 81.00 | ||||||
| 80 | 83.56 | 80 | 82.72 | ||||||
| 90 | 85.26 | 90 | 84.51 | ||||||
| 100 | 86.93 | 100 | 86.03 | ||||||
| 125 | Plastic deformation stage | 90.48 | 125 | Plastic deformation stage | 89.64 | ||||
| 150 | 93.82 | 150 | 92.77 | ||||||
| 175 | 96.82 | 175 | 95.71 | ||||||
| 200 | 99.67 | 200 | 98.48 | ||||||
| L1-10 h | RT | 20 | Particle Rearrangement stage | 54.22 | L1-20 h | RT | 20 | Particle Rearrangement stage | 52.33 |
| 30 | 58.62 | 30 | 56.33 | ||||||
| 40 | 62.25 | 40 | 59.67 | ||||||
| 50 | 65.31 | 50 | 62.48 | ||||||
| 60 | Elastic deformation stage | 67.97 | 60 | Elastic deformation stage | 64.92 | ||||
| 70 | 70.43 | 70 | 67.16 | ||||||
| 80 | 72.59 | 80 | 69.12 | ||||||
| 90 | 74.72 | 90 | 71.04 | ||||||
| 100 | 76.61 | 100 | 72.75 | ||||||
| 125 | Plastic deformation stage | 80.71 | 125 | Plastic deformation stage | 76.44 | ||||
| 150 | 84.19 | 150 | 79.55 | ||||||
| 175 | 87.52 | 175 | 82.51 | ||||||
| 200 | 90.25 | 200 | 84.94 | ||||||
| 275 | 20 | Particle rearrangement stage | 59.40 | L1-20 h | 275 | 20 | Particle rearrangement stage | 57.80 | |
| 30 | 63.22 | 30 | 61.41 | ||||||
| 40 | 66.34 | 40 | 64.35 | ||||||
| 50 | 69.14 | 50 | 66.98 | ||||||
| 60 | Elastic deformation stage | 71.61 | 60 | Elastic deformation stage | 69.29 | ||||
| 70 | 73.89 | 70 | 71.43 | ||||||
| 80 | 75.77 | 80 | 73.18 | ||||||
| 90 | 77.64 | 90 | 74.92 | ||||||
| 100 | 79.30 | 100 | 76.47 | ||||||
| 125 | Plastic deformation stage | 83.34 | 125 | Plastic deformation stage | 80.22 | ||||
| 150 | 87.11 | 150 | 83.70 | ||||||
| 175 | 90.50 | 175 | 86.83 | ||||||
| 200 | 93.64 | 200 | 89.72 | ||||||
| 550 | 20 | Particle rearrangement stage | 69.97 | L1-20 h | 550 | 20 | Particle rearrangement stage | 68.88 | |
| 30 | 72.89 | 30 | 71.71 | ||||||
| 40 | 75.29 | 40 | 74.03 | ||||||
| 50 | 77.39 | 50 | 76.06 | ||||||
| 60 | Elastic deformation stage | 79.33 | 60 | Elastic deformation stage | 77.94 | ||||
| 70 | 80.97 | 70 | 79.52 | ||||||
| 80 | 82.58 | 80 | 81.07 | ||||||
| 90 | 84.06 | 90 | 82.50 | ||||||
| 100 | 85.47 | 100 | 83.85 | ||||||
| 125 | Plastic deformation stage | 88.66 | 125 | Plastic deformation stage | 86.92 | ||||
| 150 | 91.46 | 150 | 89.61 | ||||||
| 175 | 94.06 | 175 | 92.10 | ||||||
| 200 | 96.48 | 200 | 94.42 |
Hot compaction at 275°C showed further enhancement in densification due to thermally activated processes such as diffusion and plastic flow. At 150 MPa, in the plastic deformation stage, the 20 h sample achieved a relative density of 83.70%, a 4% increase compared to its cold-compacted counterpart. Similarly, the 0 h sample exhibited a relative density of 91.17% under the same conditions, underscoring the contribution of temperature to reducing residual porosity. Hot compaction at 550°C led to the most significant density improvements. At 200 MPa, in the plastic deformation stage, the relative density of the 20 h sample reached 94.42%, a 12.5% improvement compared to the cold-compacted sample. This substantial enhancement is attributed to the increased mobility of atoms and improved grain boundary diffusion at elevated temperatures, facilitating the elimination of voids and achieving near-full densification. For the 0 h sample, the relative density peaked at 99.67%, reflecting a 4.5% improvement over hot compaction at 275°C, further emphasizing the role of temperature in enhancing particle bonding and reducing defects. The results demonstrate that extended milling times improve densification behavior due to finer particle sizes and higher surface energy, enhancing cold welding and deformation during compaction. Additionally, increasing compaction temperature and pressure synergistically aids in achieving higher relative densities by promoting diffusion and plastic flow. These observations were also reported by Toozandehjani et al. [41] and Sivasankaran et al. [42]. These findings highlight the critical interplay of milling duration, temperature, and pressure in optimizing the compaction and densification of Mg30-Al25-Ti25-Li15-Si5 LWHEA powders.
In this study, we successfully synthesized Mg30-Al25-Ti25-Li15-Si5 LWHEAs via MA, providing a comprehensive understanding of their phase formation, crystal structure examination using various models, microstructural evolution, and compaction behavior. The following conclusions were drawn:
-
XRD analysis revealed the formation of intermetallic phases such as Mg2Si and Al12Mg17, along with nanocrystalline and amorphous structures.
-
Prolonged milling times (up to 20 h) promoted enhanced diffusion, leading to uniform elemental distribution, increased lattice strain, and significant grain refinement.
-
Peak broadening models (Scherrer, W-H UDM, W-H USDM, and SSP) effectively characterized the crystal size and lattice strain, with Williamson–Hall models demonstrating enhanced accuracy by incorporating stress and strain.
-
The particle size reduced from an average of 50–60 nm (0 h) to 18–24 nm (20 h), confirming nanocrystallization. TEM analyses supported these findings, with lattice compression and structural refinement evident in HRTEM and SAED patterns.
-
MA induced a progressive increase in dislocation density, SFP, and lattice distortions, improving the grain boundary density and contributing to enhanced mechanical properties.
-
Compaction studies demonstrated that increased milling time, compaction pressure, and temperature synergistically improved densification and relative density.
-
At 200 MPa and 550°C, the 20 h sample achieved a relative density of 94.42%, emphasizing the critical role of elevated temperatures in eliminating voids and achieving near-full densification.
-
The combination of low density, nanocrystalline structure, and enhanced mechanical integrity makes Mg30-Al25-Ti25-Li15-Si5 LWHEAs ideal for aerospace, automotive, and other lightweight structural applications.
-
In future work, we aim to investigate the effects of post-compaction sintering and thermal treatments on the phase stability and mechanical properties of the synthesized Mg30-Al25-Ti25-Li15-Si5 LWHEAs. Additionally, corrosion resistance and thermal stability studies under service-like environments will be conducted to assess the alloy’s practical applicability in the aerospace and automotive sectors.
-
Further exploration will include compositional tuning by incorporating other low-density elements and utilizing advanced consolidation techniques such as SPS to enhance densification and mechanical integrity.
The authors gratefully acknowledge Qassim University, represented by the Deanship of Scientific Research, on the financial support for this research under the number 2023-SDG-1-BSRC35611 during the academic year 1445 AH/2023 AD.
This research was funded by Qassim University, represented by the Deanship of Scientific Research, under the number (2023-SDG-1-BSRC35611) during the academic year 1445 AH/2023 AD.
H.R.A.: Conceptualization, methodology, formal analysis, writing original manuscript, writing-review and editing. S.S.: Conceptualization, methodology, data curation, writing original manuscript, writing-review and editing. F.A.A.: Methodology, formal analysis, data curation, writing-review and editing.
The authors declare no conflict of interest.
The experimental datasets obtained from this research work and the analyzed results during the current study are available from the corresponding author upon reasonable request.