Figure 1
Figure 2
Figure 3
Figure 4
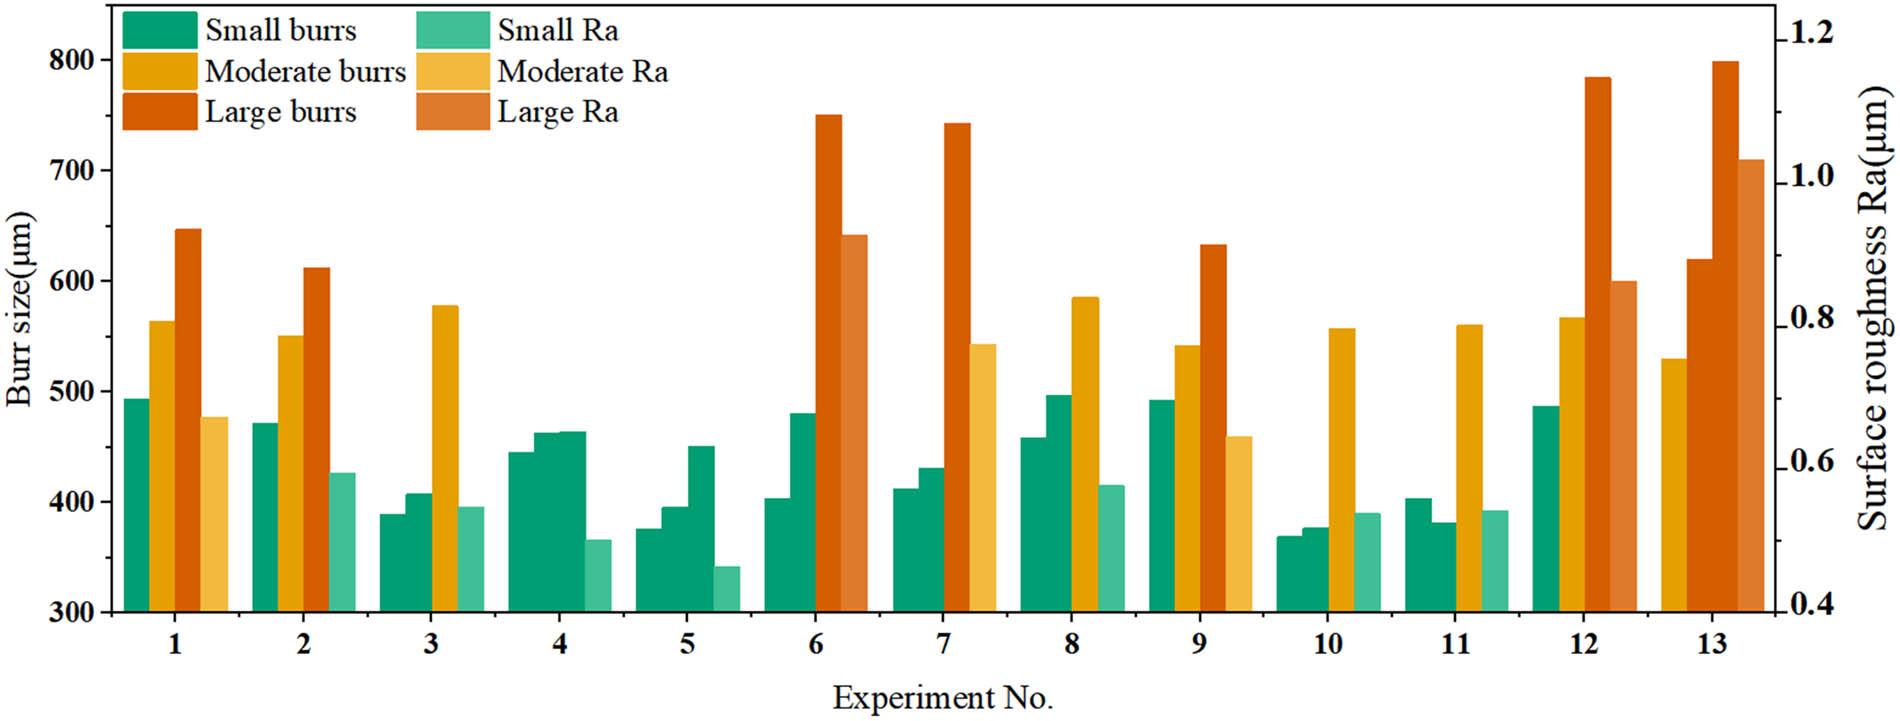
Figure 5
Figure 6
Figure 7
Figure 8
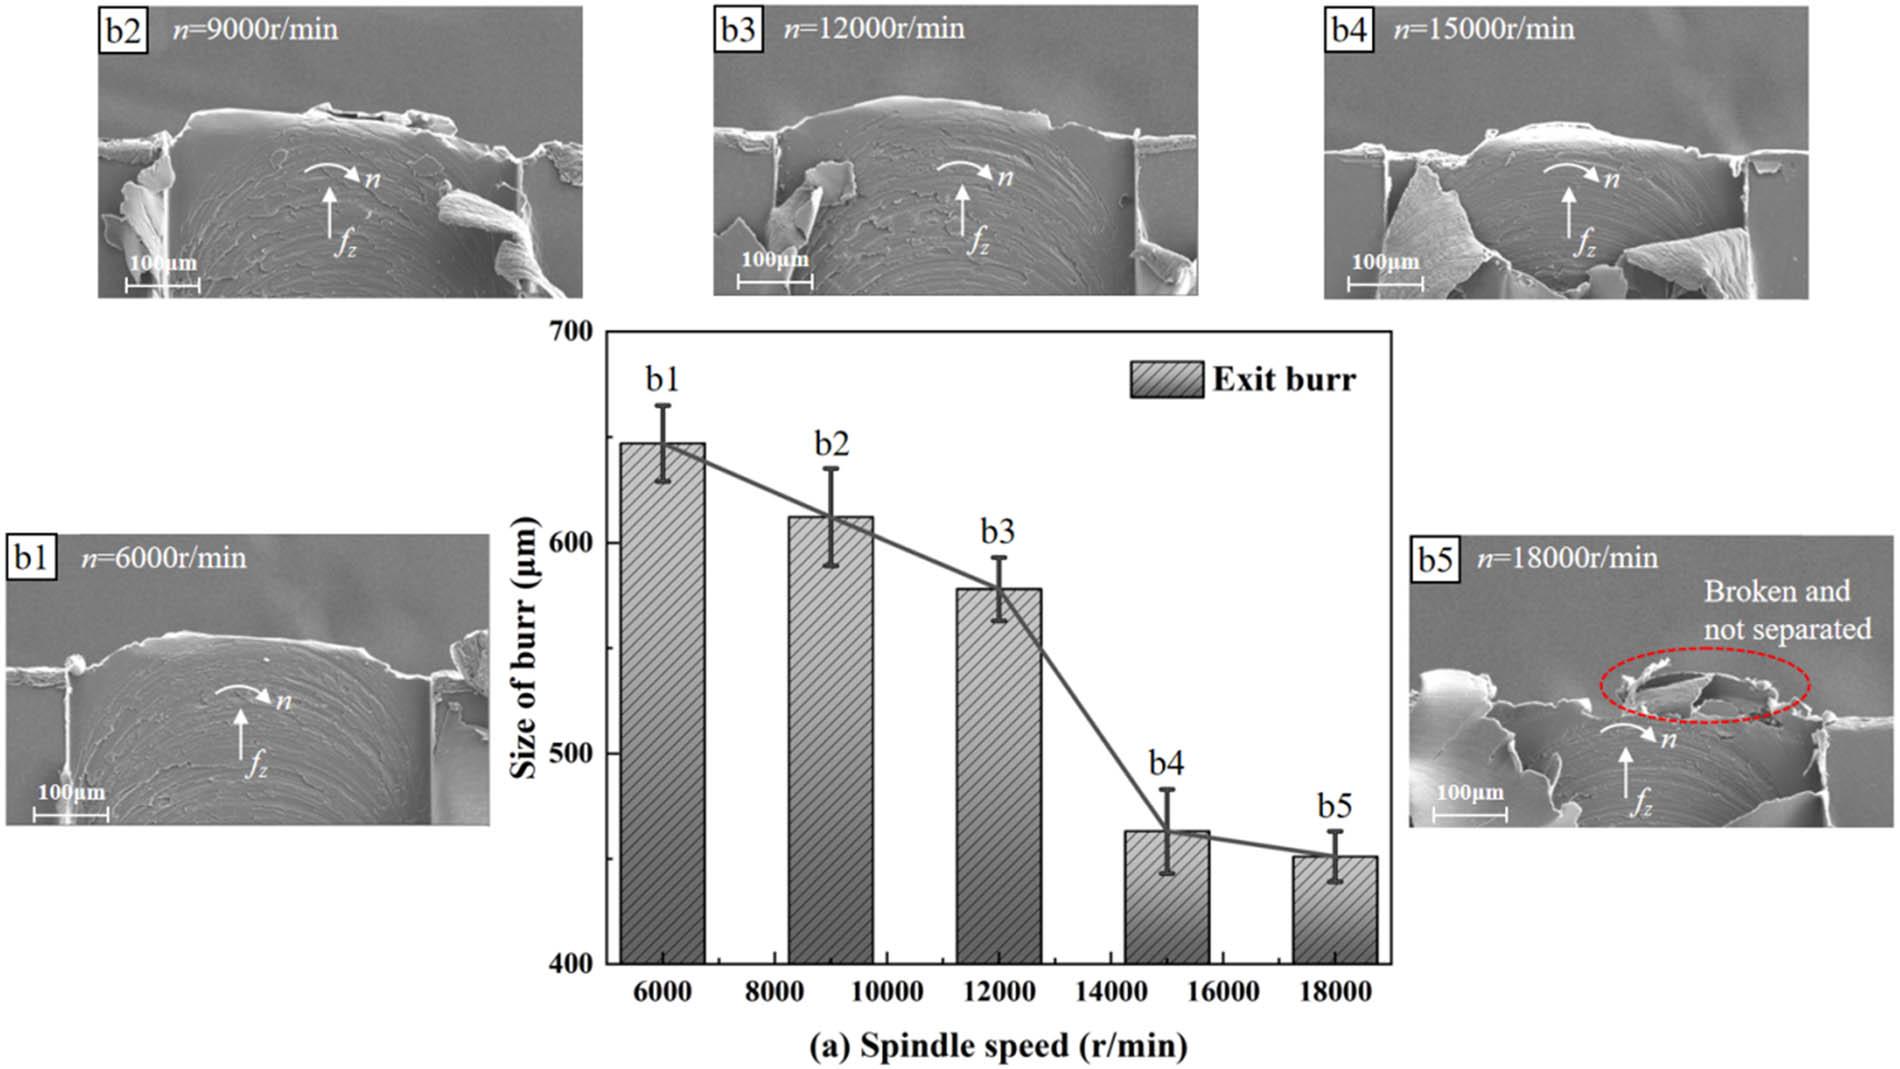
Figure 9
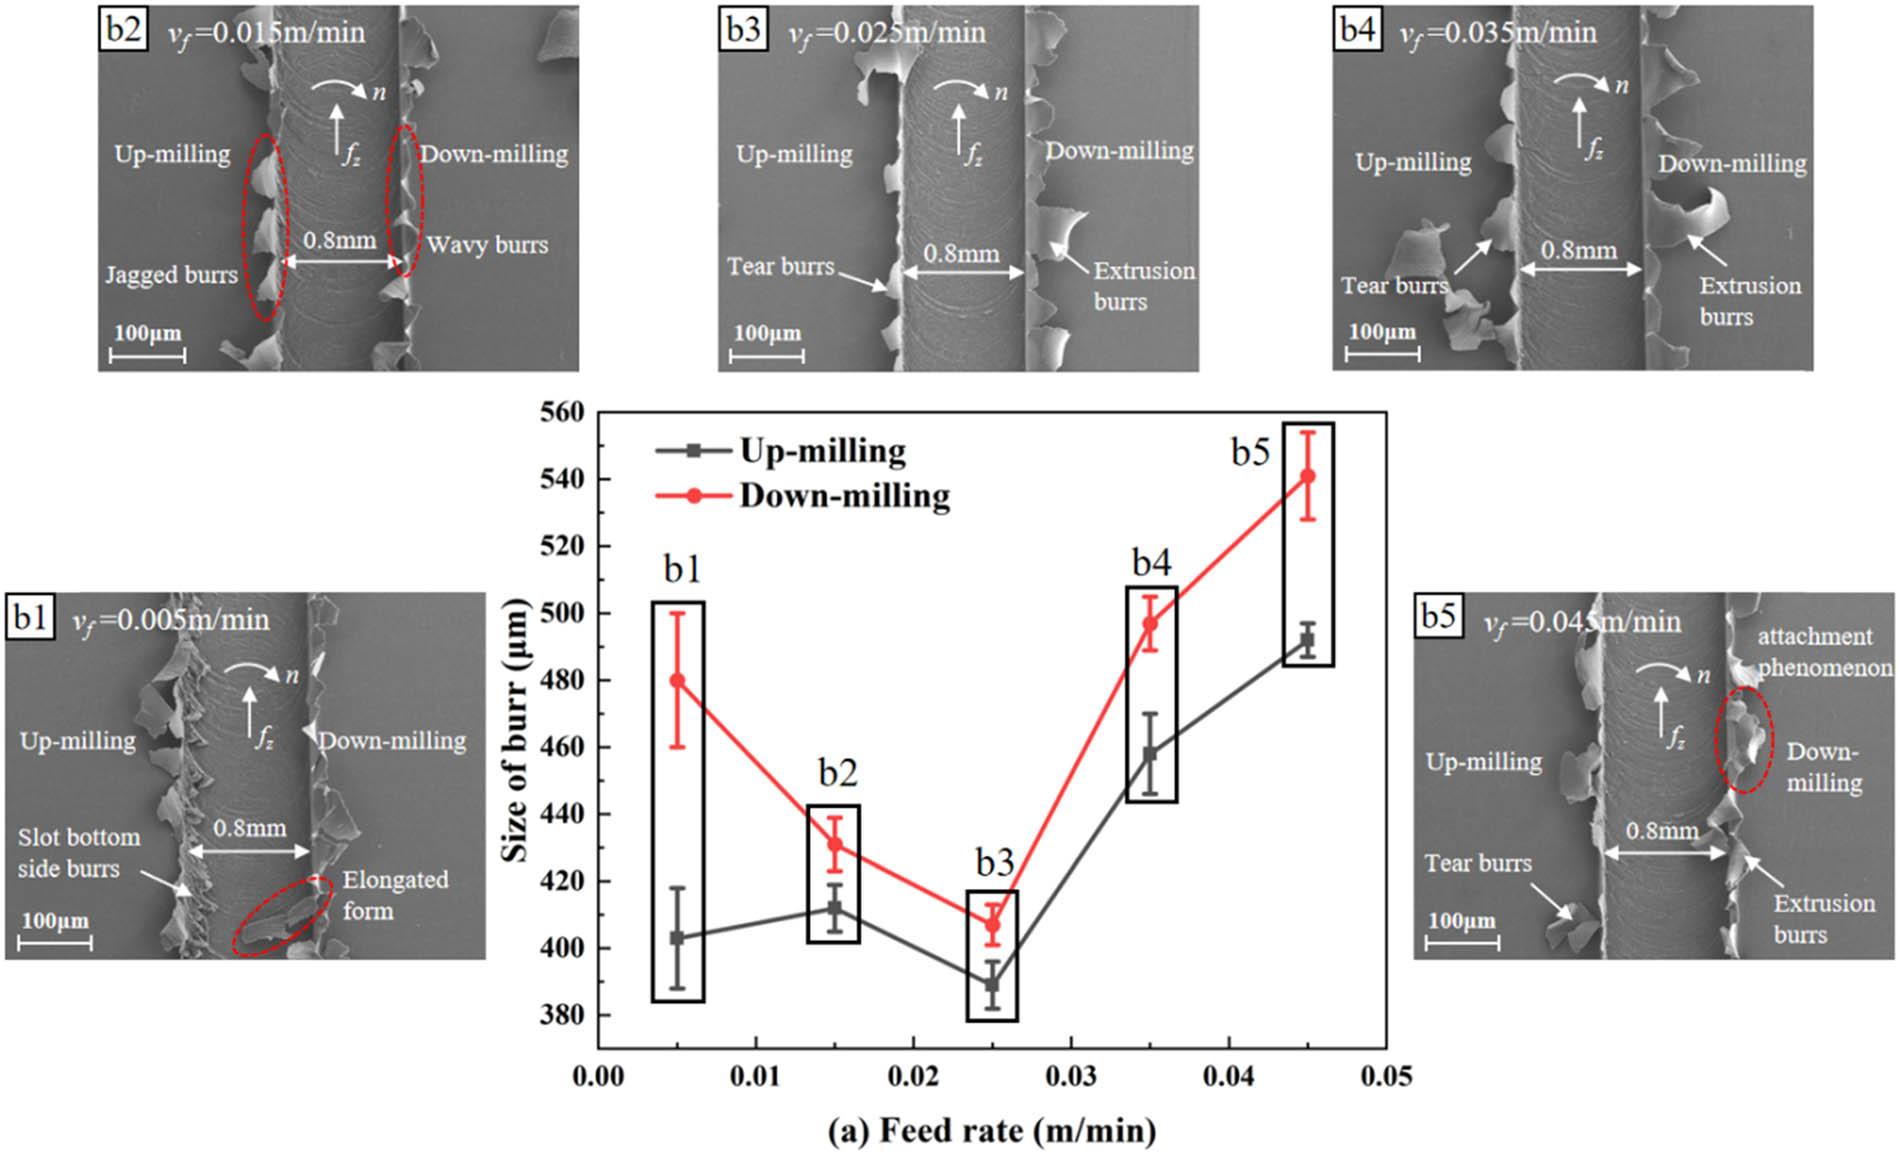
Figure 10
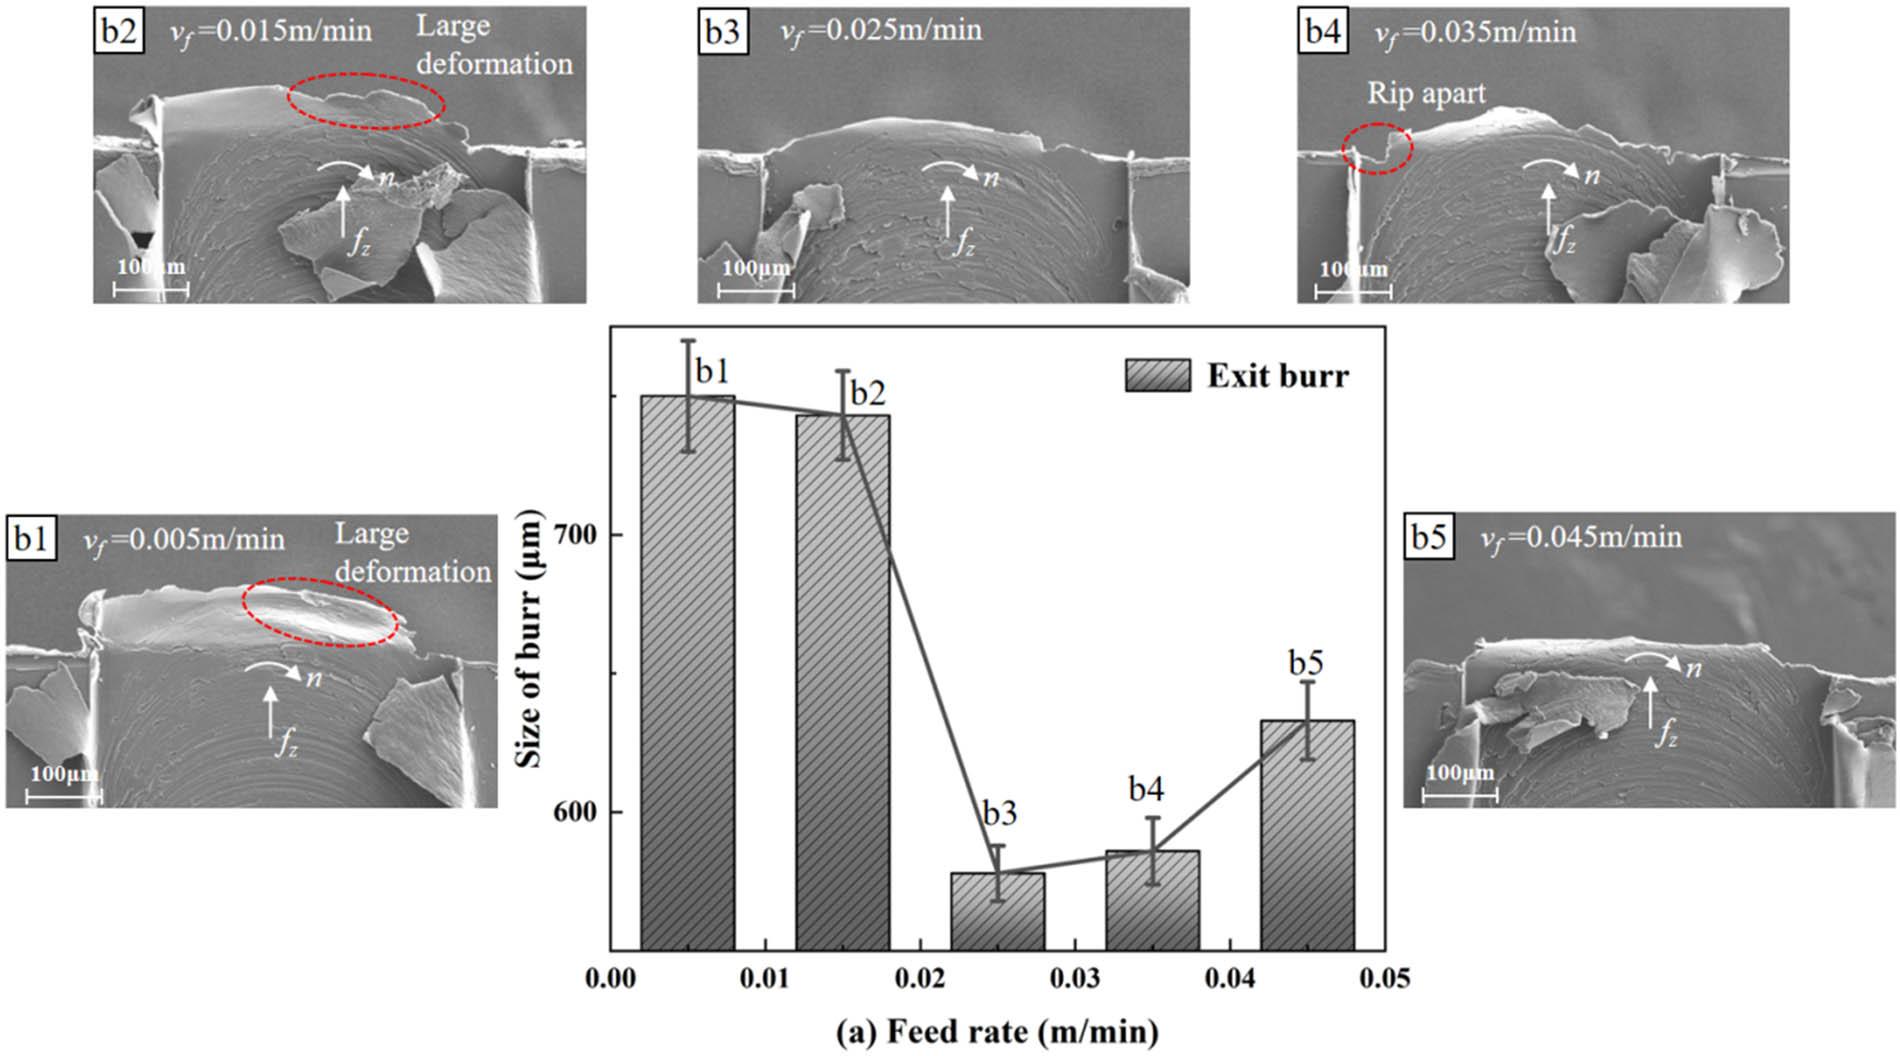
Figure 11
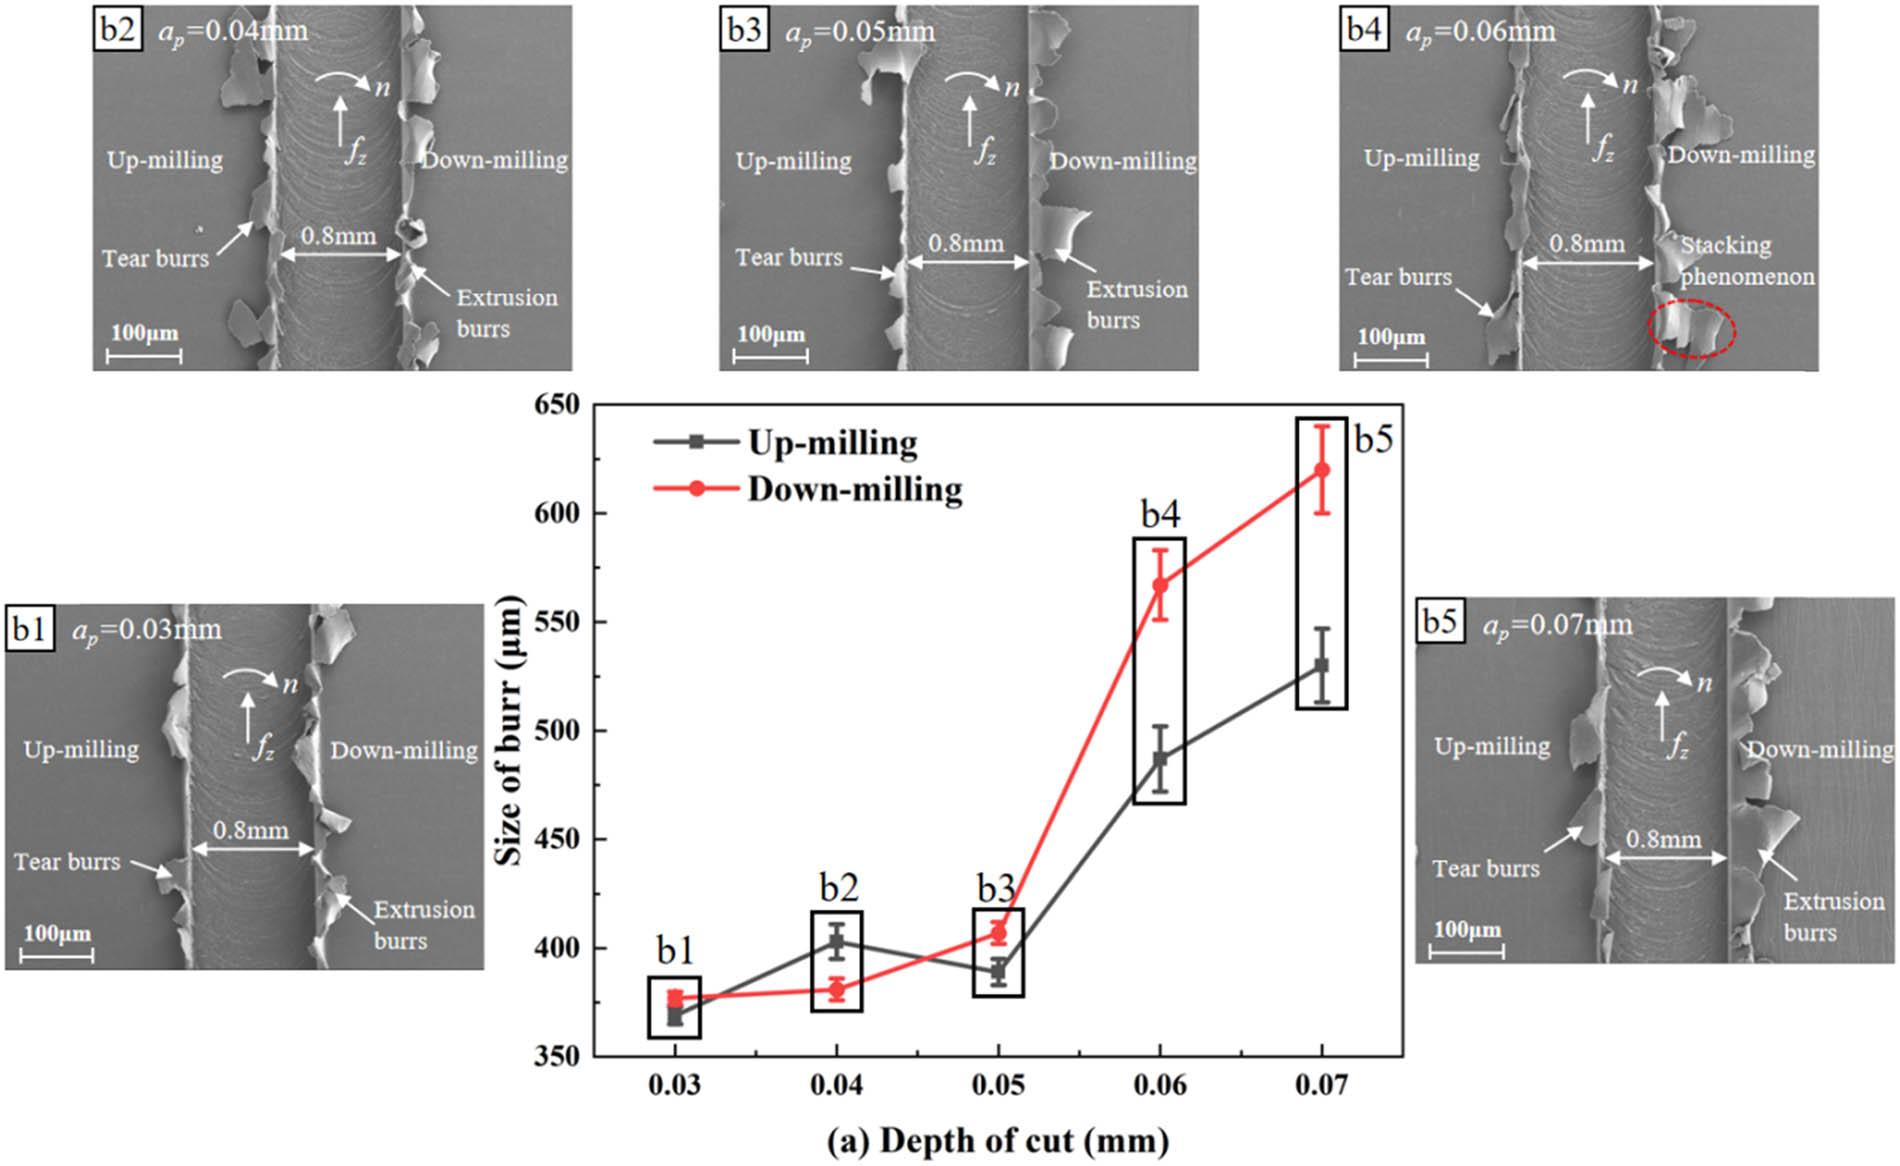
Figure 12
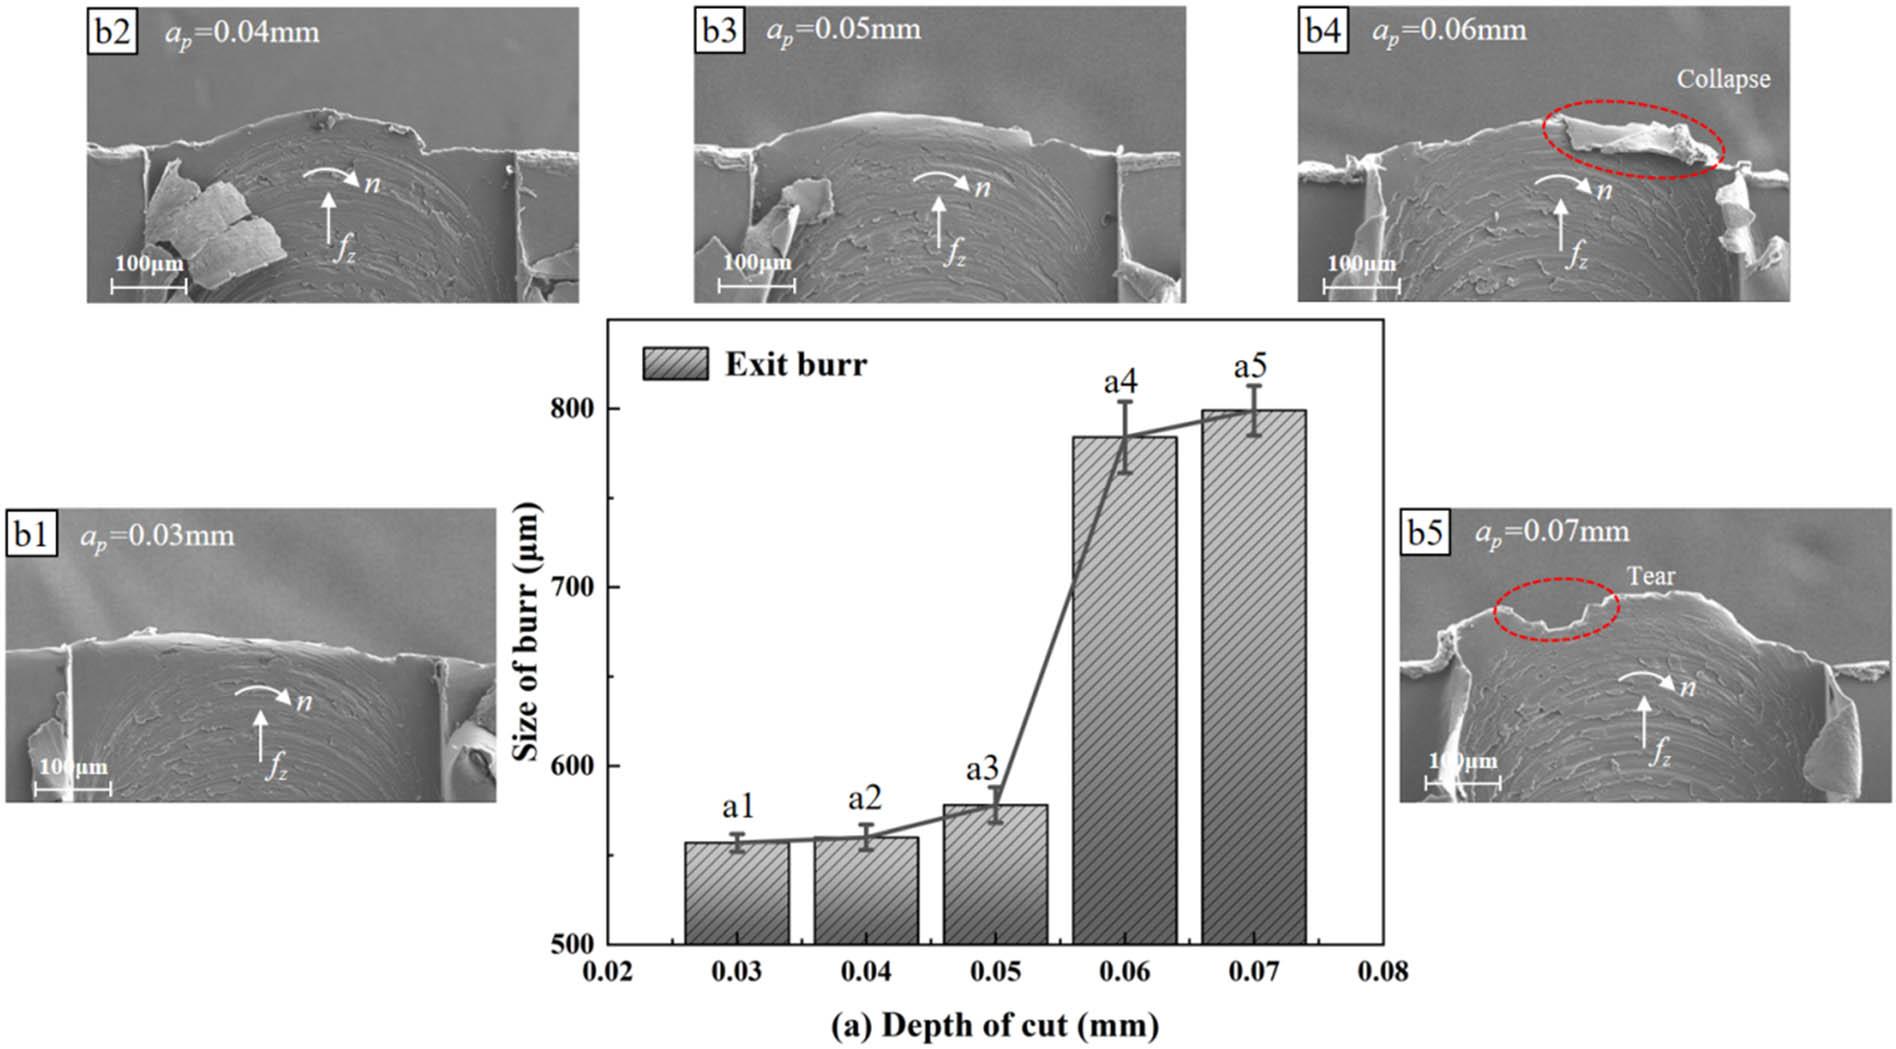
Figure 13
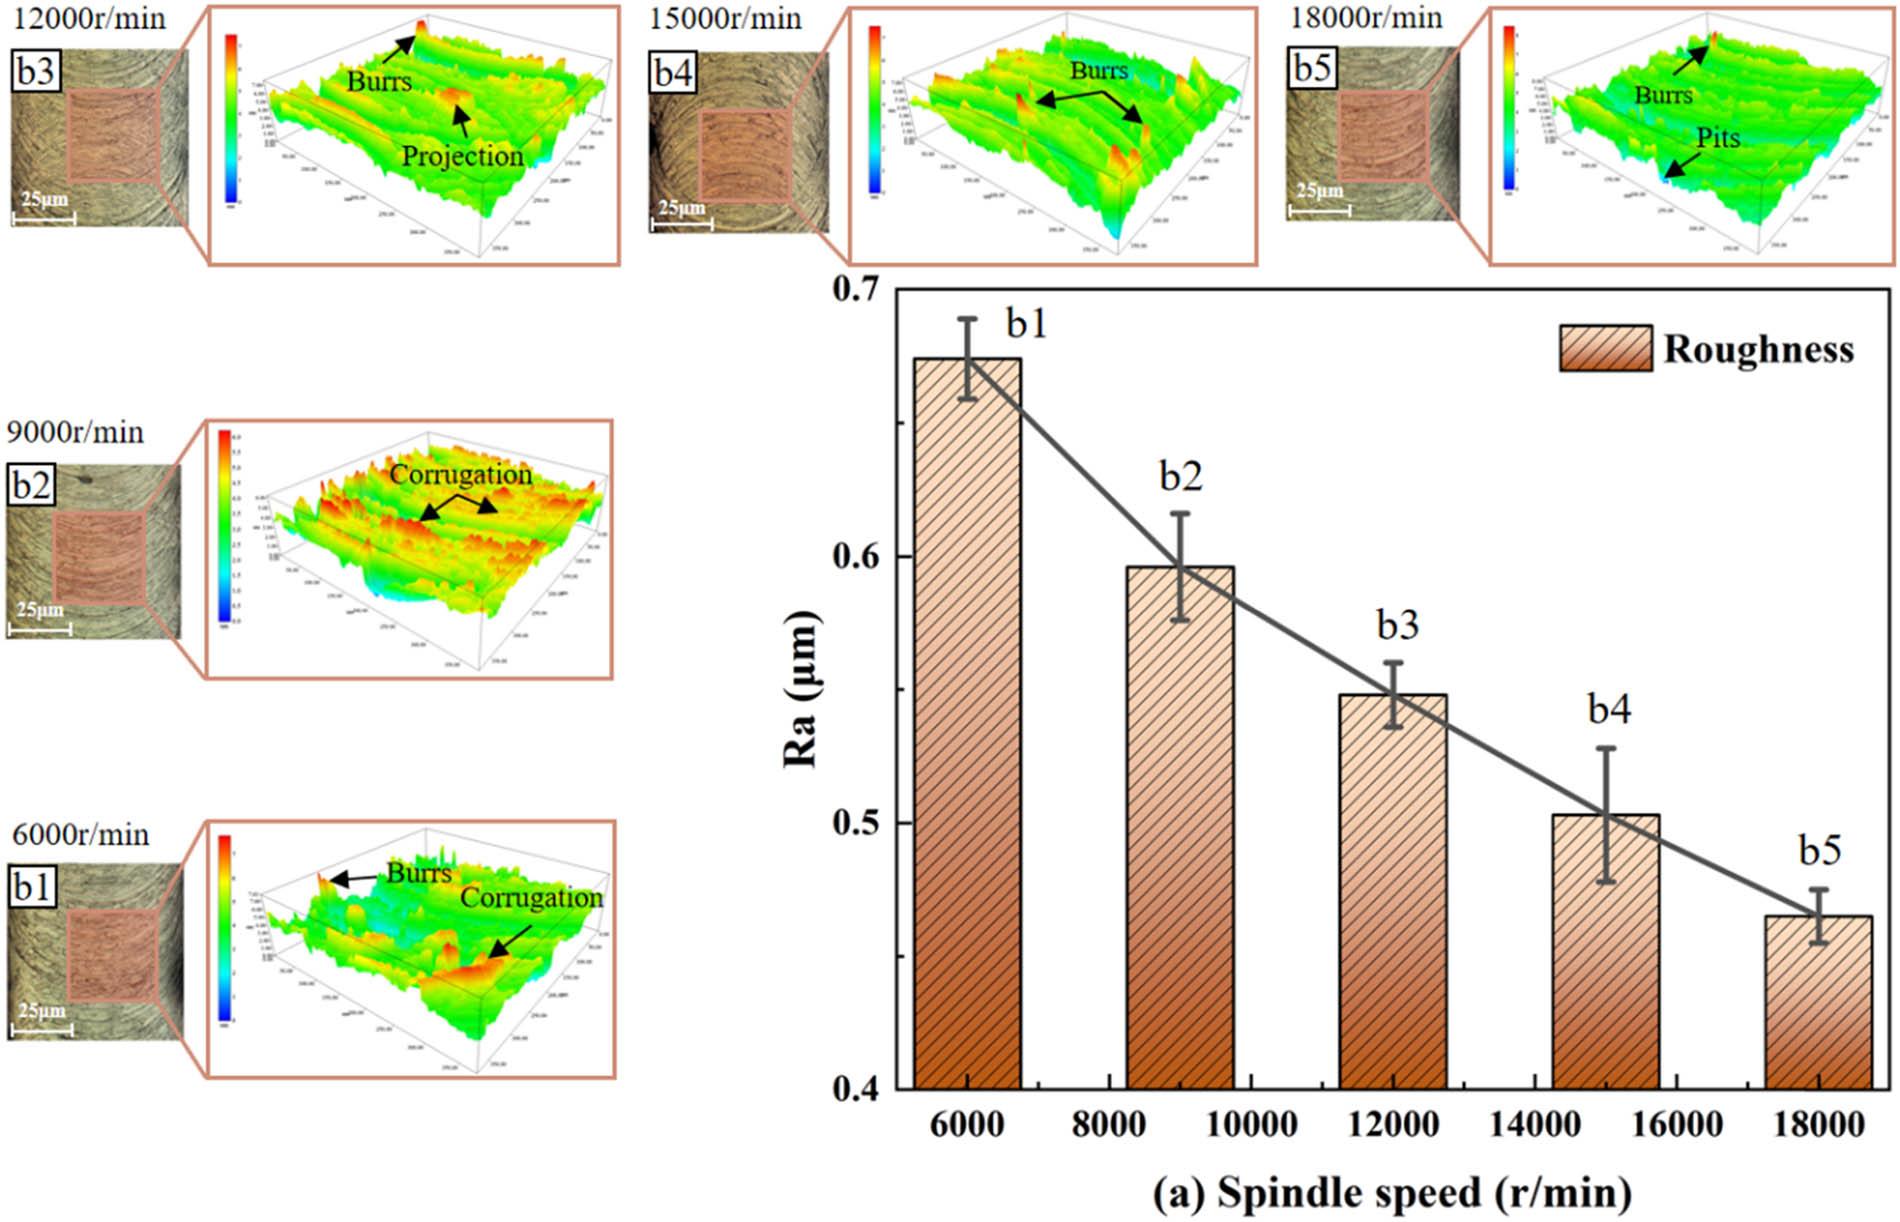
Figure 14
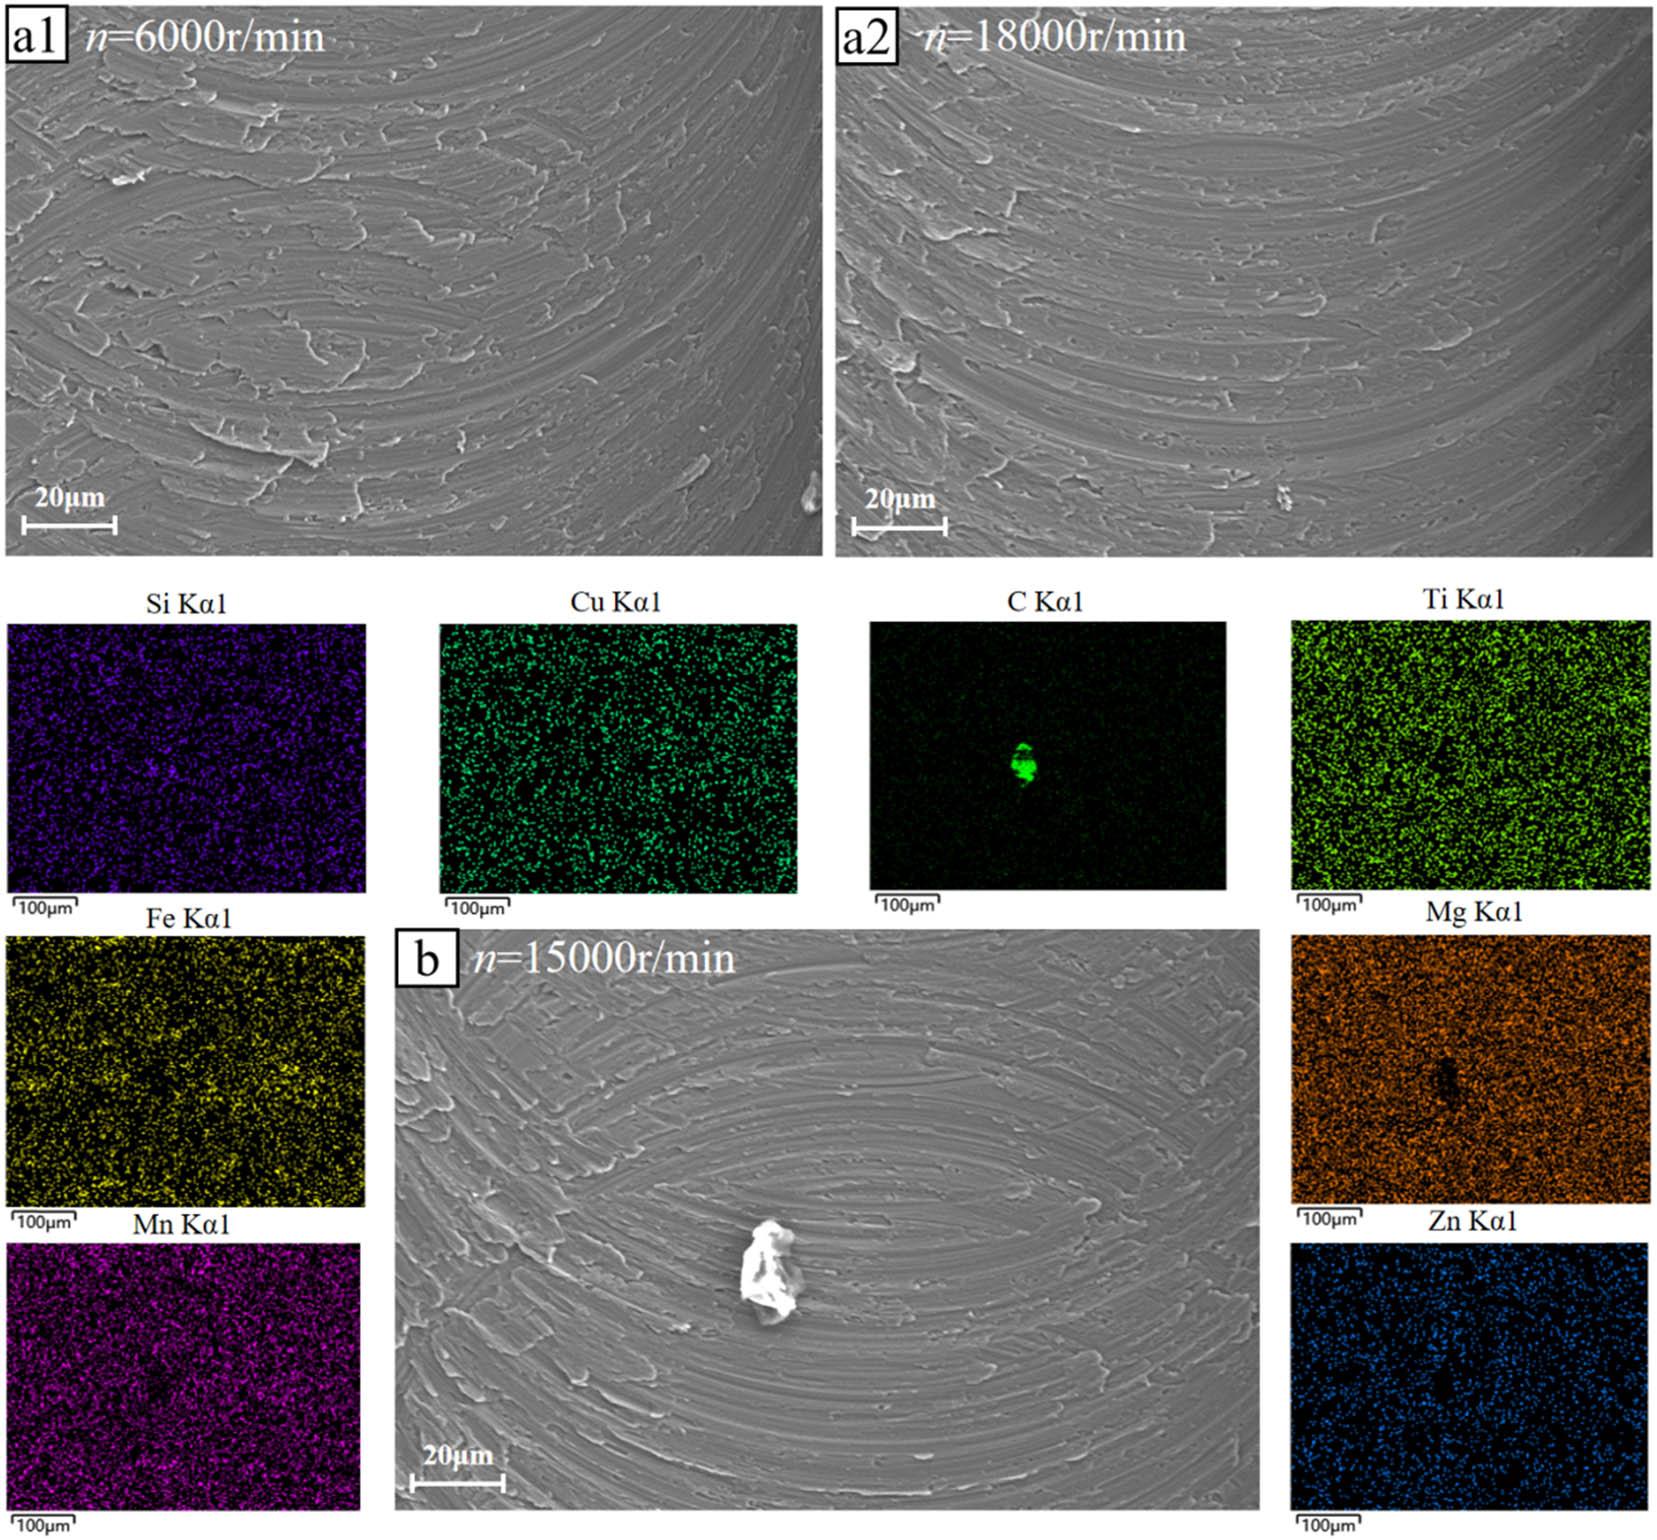
Figure 15
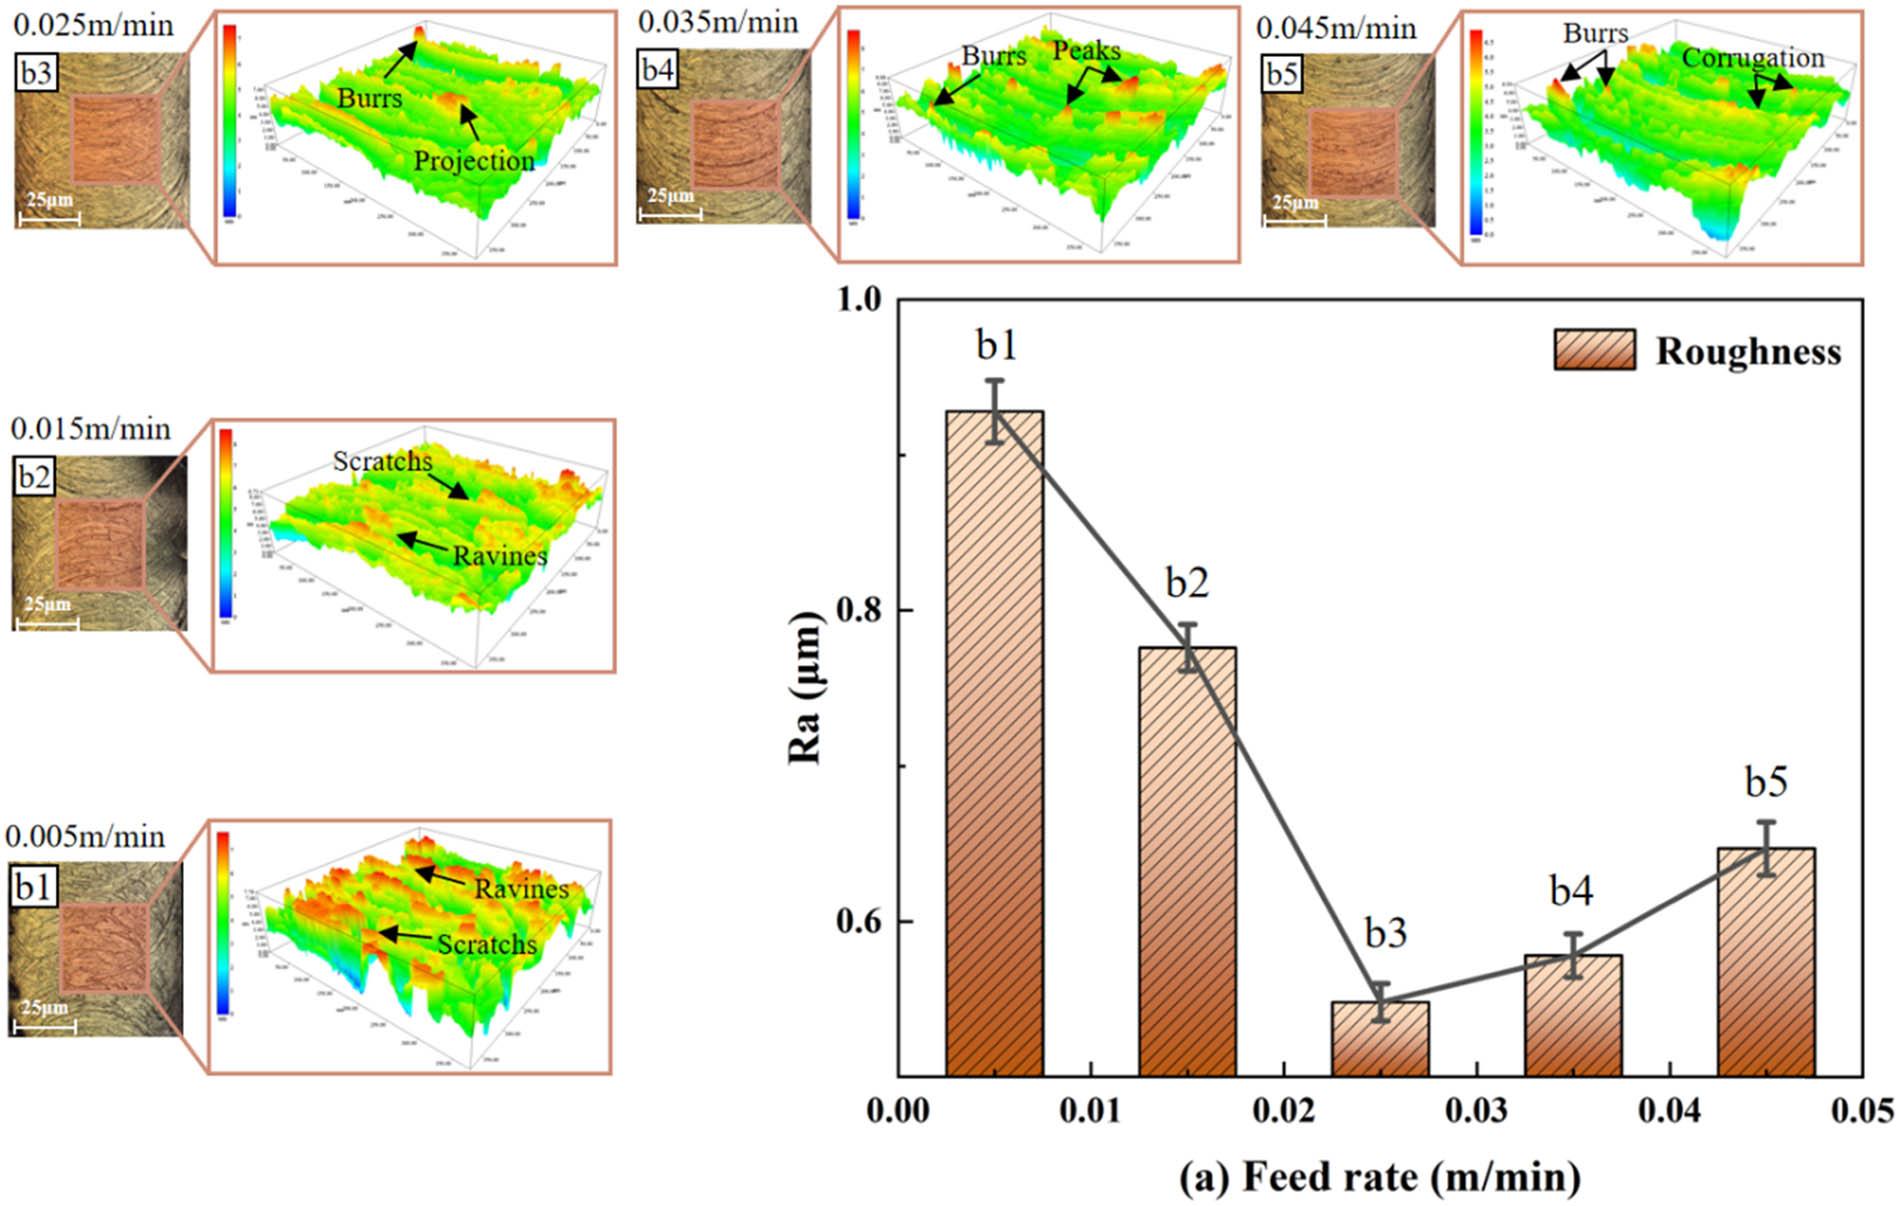
Figure 16
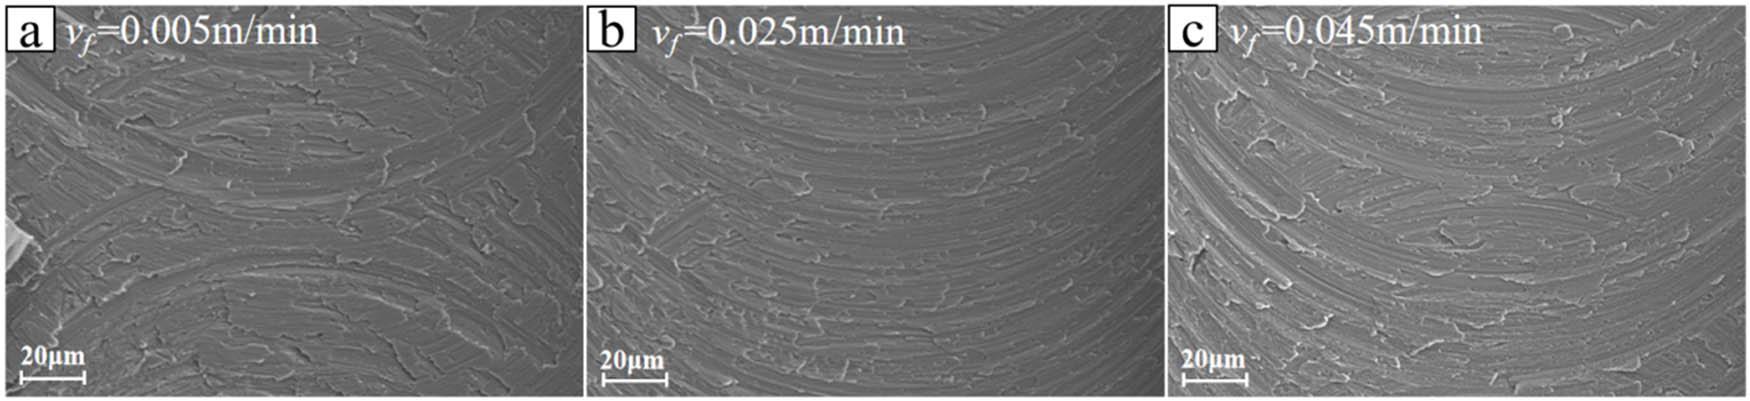
Figure 17
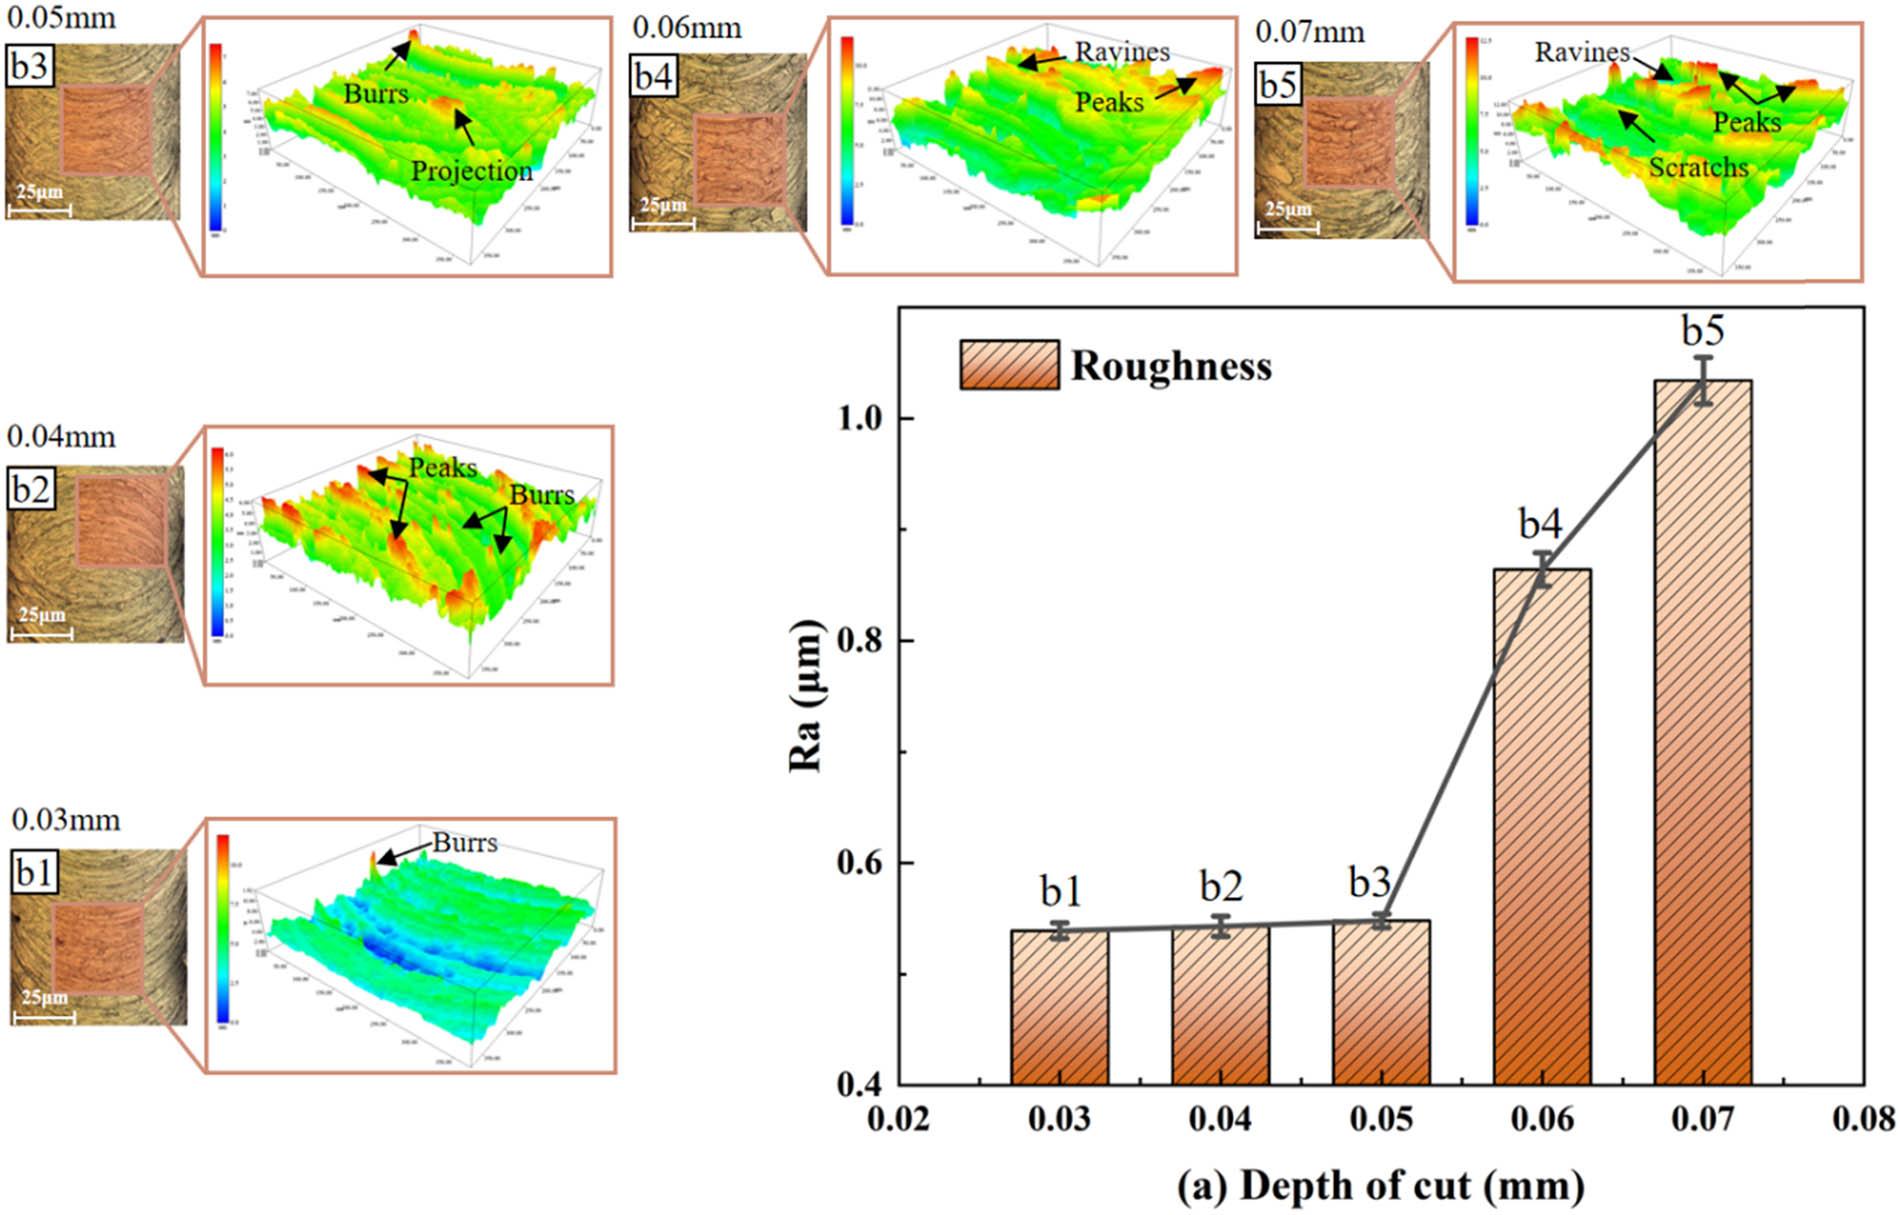
Figure 18
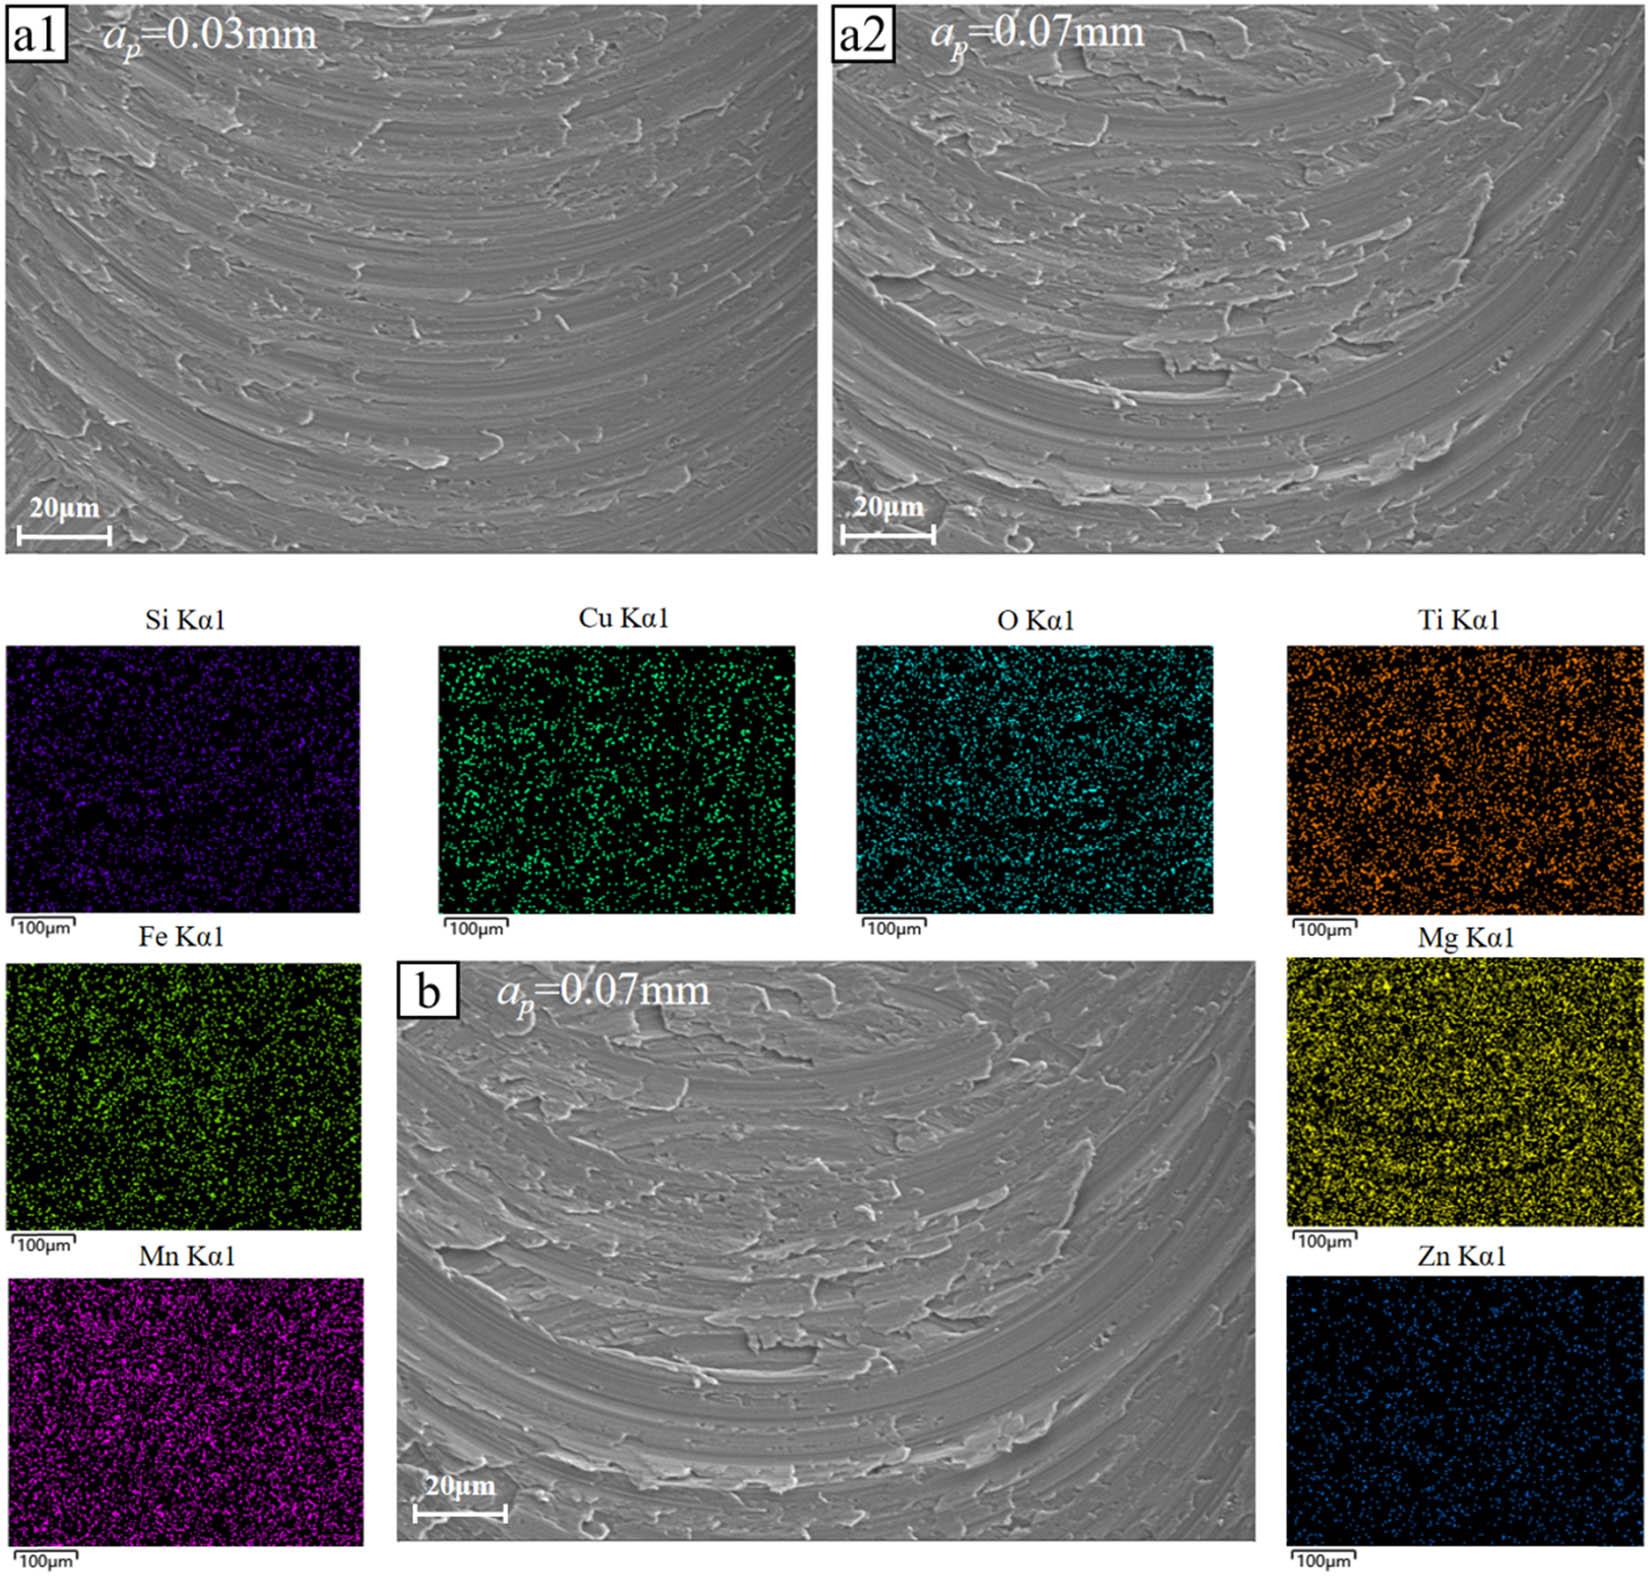
EDS mapping of each element content under depth of cut of 0_07 mm_
| Mn | Fe | Si | Cu | O | Ti | Mg | Zn |
|---|---|---|---|---|---|---|---|
| 1.04 | 0.36 | 0.16 | 0.12 | 0.56 | 0.03 | 0.03 | 0.04 |
Chemical elements of aluminum alloy LF21_
| Element | Si | Ti | Mn | Fe | Cu | Mg |
|---|---|---|---|---|---|---|
| Mass% | 0.60 | 0.1–0.2 | 1.0–1.6 | 0.7 | 0.2 | 0.05 |
Burr size and surface roughness R a measurement results_
| No. | N | v f | a p | Up-burr | Down-burr | Exit-burr | R a |
|---|---|---|---|---|---|---|---|
| (rpm) | (m/min) | (mm) | (μm) | (μm) | (μm) | (μm) | |
| 1 | 6,000 | 0.025 | 0.05 | 493.53 | 564.59 | 647.52 | 0.674 |
| 2 | 9,000 | 0.025 | 0.05 | 472.23 | 551.03 | 612.36 | 0.596 |
| 3 | 12,000 | 0.025 | 0.05 | 389.49 | 407.67 | 578.03 | 0.548 |
| 4 | 15,000 | 0.025 | 0.05 | 445.98 | 463.06 | 463.63 | 0.503 |
| 5 | 18,000 | 0.025 | 0.05 | 376.26 | 395.82 | 451.09 | 0.465 |
| 6 | 12,000 | 0.005 | 0.05 | 403.11 | 480.93 | 750.97 | 0.928 |
| 7 | 12,000 | 0.015 | 0.05 | 412.59 | 431.24 | 743.25 | 0.776 |
| 8 | 12,000 | 0.035 | 0.05 | 458.5 | 497.46 | 586.07 | 0.578 |
| 9 | 12,000 | 0.045 | 0.05 | 492.8 | 541.67 | 633.44 | 0.647 |
| 10 | 12,000 | 0.025 | 0.03 | 369.27 | 377.19 | 557.59 | 0.539 |
| 11 | 12,000 | 0.025 | 0.04 | 403.26 | 381.24 | 560.45 | 0.543 |
| 12 | 12,000 | 0.025 | 0.06 | 487.43 | 567.35 | 784.57 | 0.864 |
| 13 | 12,000 | 0.025 | 0.07 | 530.22 | 620.38 | 799.52 | 1.034 |
Workpiece material parameters_
| Density (kg/m3) | Yield strength (MPa) | Tensile strength (MPa) | Elastic modulus (MPa) | Poisson’s ratio (μ) |
|---|---|---|---|---|
| 2,740 | 42 | 97 | 6.86 × 10⁴ | 0.25 |
Values of influencing factors_
| No. | Invariant parameters | Variable parameters |
|---|---|---|
| 1 | v f = 0.025 m/min, a p = 0.05 mm | n (1,000 rpm) = 6, 9, 12, 15, 18 |
| 2 | n = 12,000 rpm, a p = 0.05 mm | v f (m/min) = 0.005, 0.015, 0.025, 0.035, 0.045 |
| 3 | n = 12,000 rpm, v f = 0.025 m/mim | a p (mm) = 0.03, 0.04, 0.05, 0.06, 0.07 |
Simulation measurement results of burr size_
| Burr type | Sim. width (w/μm) | Sim. length (l/μm) | Sim. burr Size (L/μm) | Meas. burr Size (L/μm) | Error (w%) |
|---|---|---|---|---|---|
| Up-burr | 243.51 | 388.59 | 458.58 | 493.53 | 7.1 |
| Down-burr | 328.61 | 399.13 | 517.01 | 564.59 | 8.4 |
| Exit burr | 145.69 | 789.35 | 802.68 | 750.97 | 6.9 |
EDS mapping of each element content under spindle speed of 15,000 rpm_
| Mn | Fe | Si | Cu | C | Ti | Mg | Zn |
|---|---|---|---|---|---|---|---|
| 1.13 | 0.39 | 0.16 | 0.06 | 8.41 | 0.04 | 0.03 | 0.11 |
Parameters of J-C constitutive model of red copper_
| A (MPa) | B (MPa) | n | m | C | T melt1 (℃) | T room (℃) |
|---|---|---|---|---|---|---|
| 34.4 | 114.2 | 0.2762 | 0.018 | 0.2062 | 643 | 20 |