
Figure 1
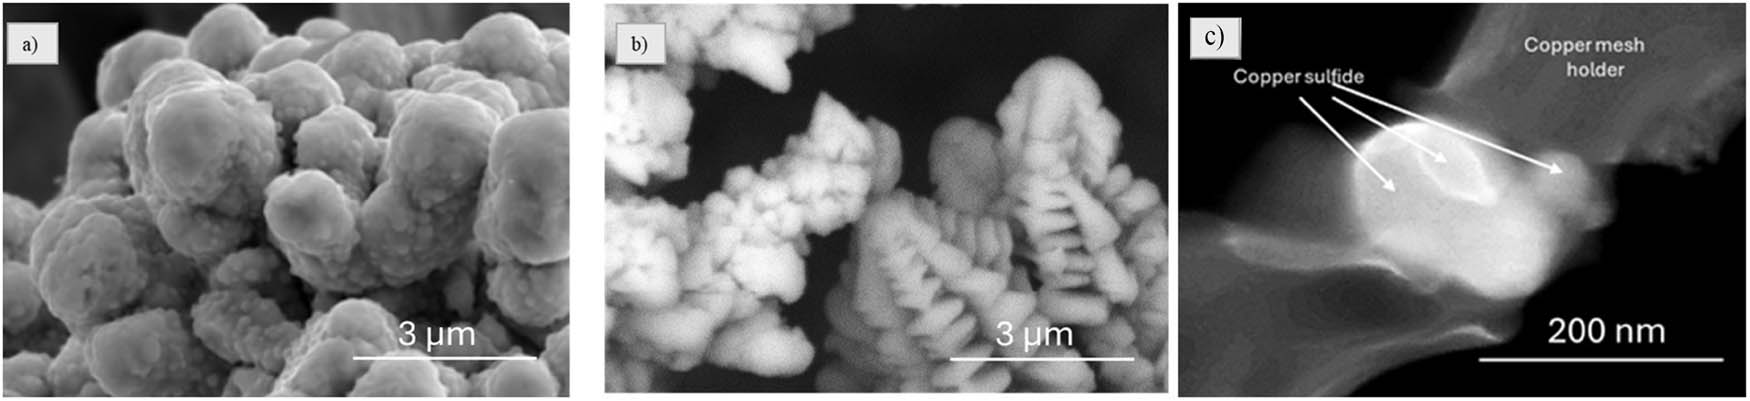
SEM images of copper (a), copper sulfide hierarchical structures (b), and copper sulfide nanostructures (c).
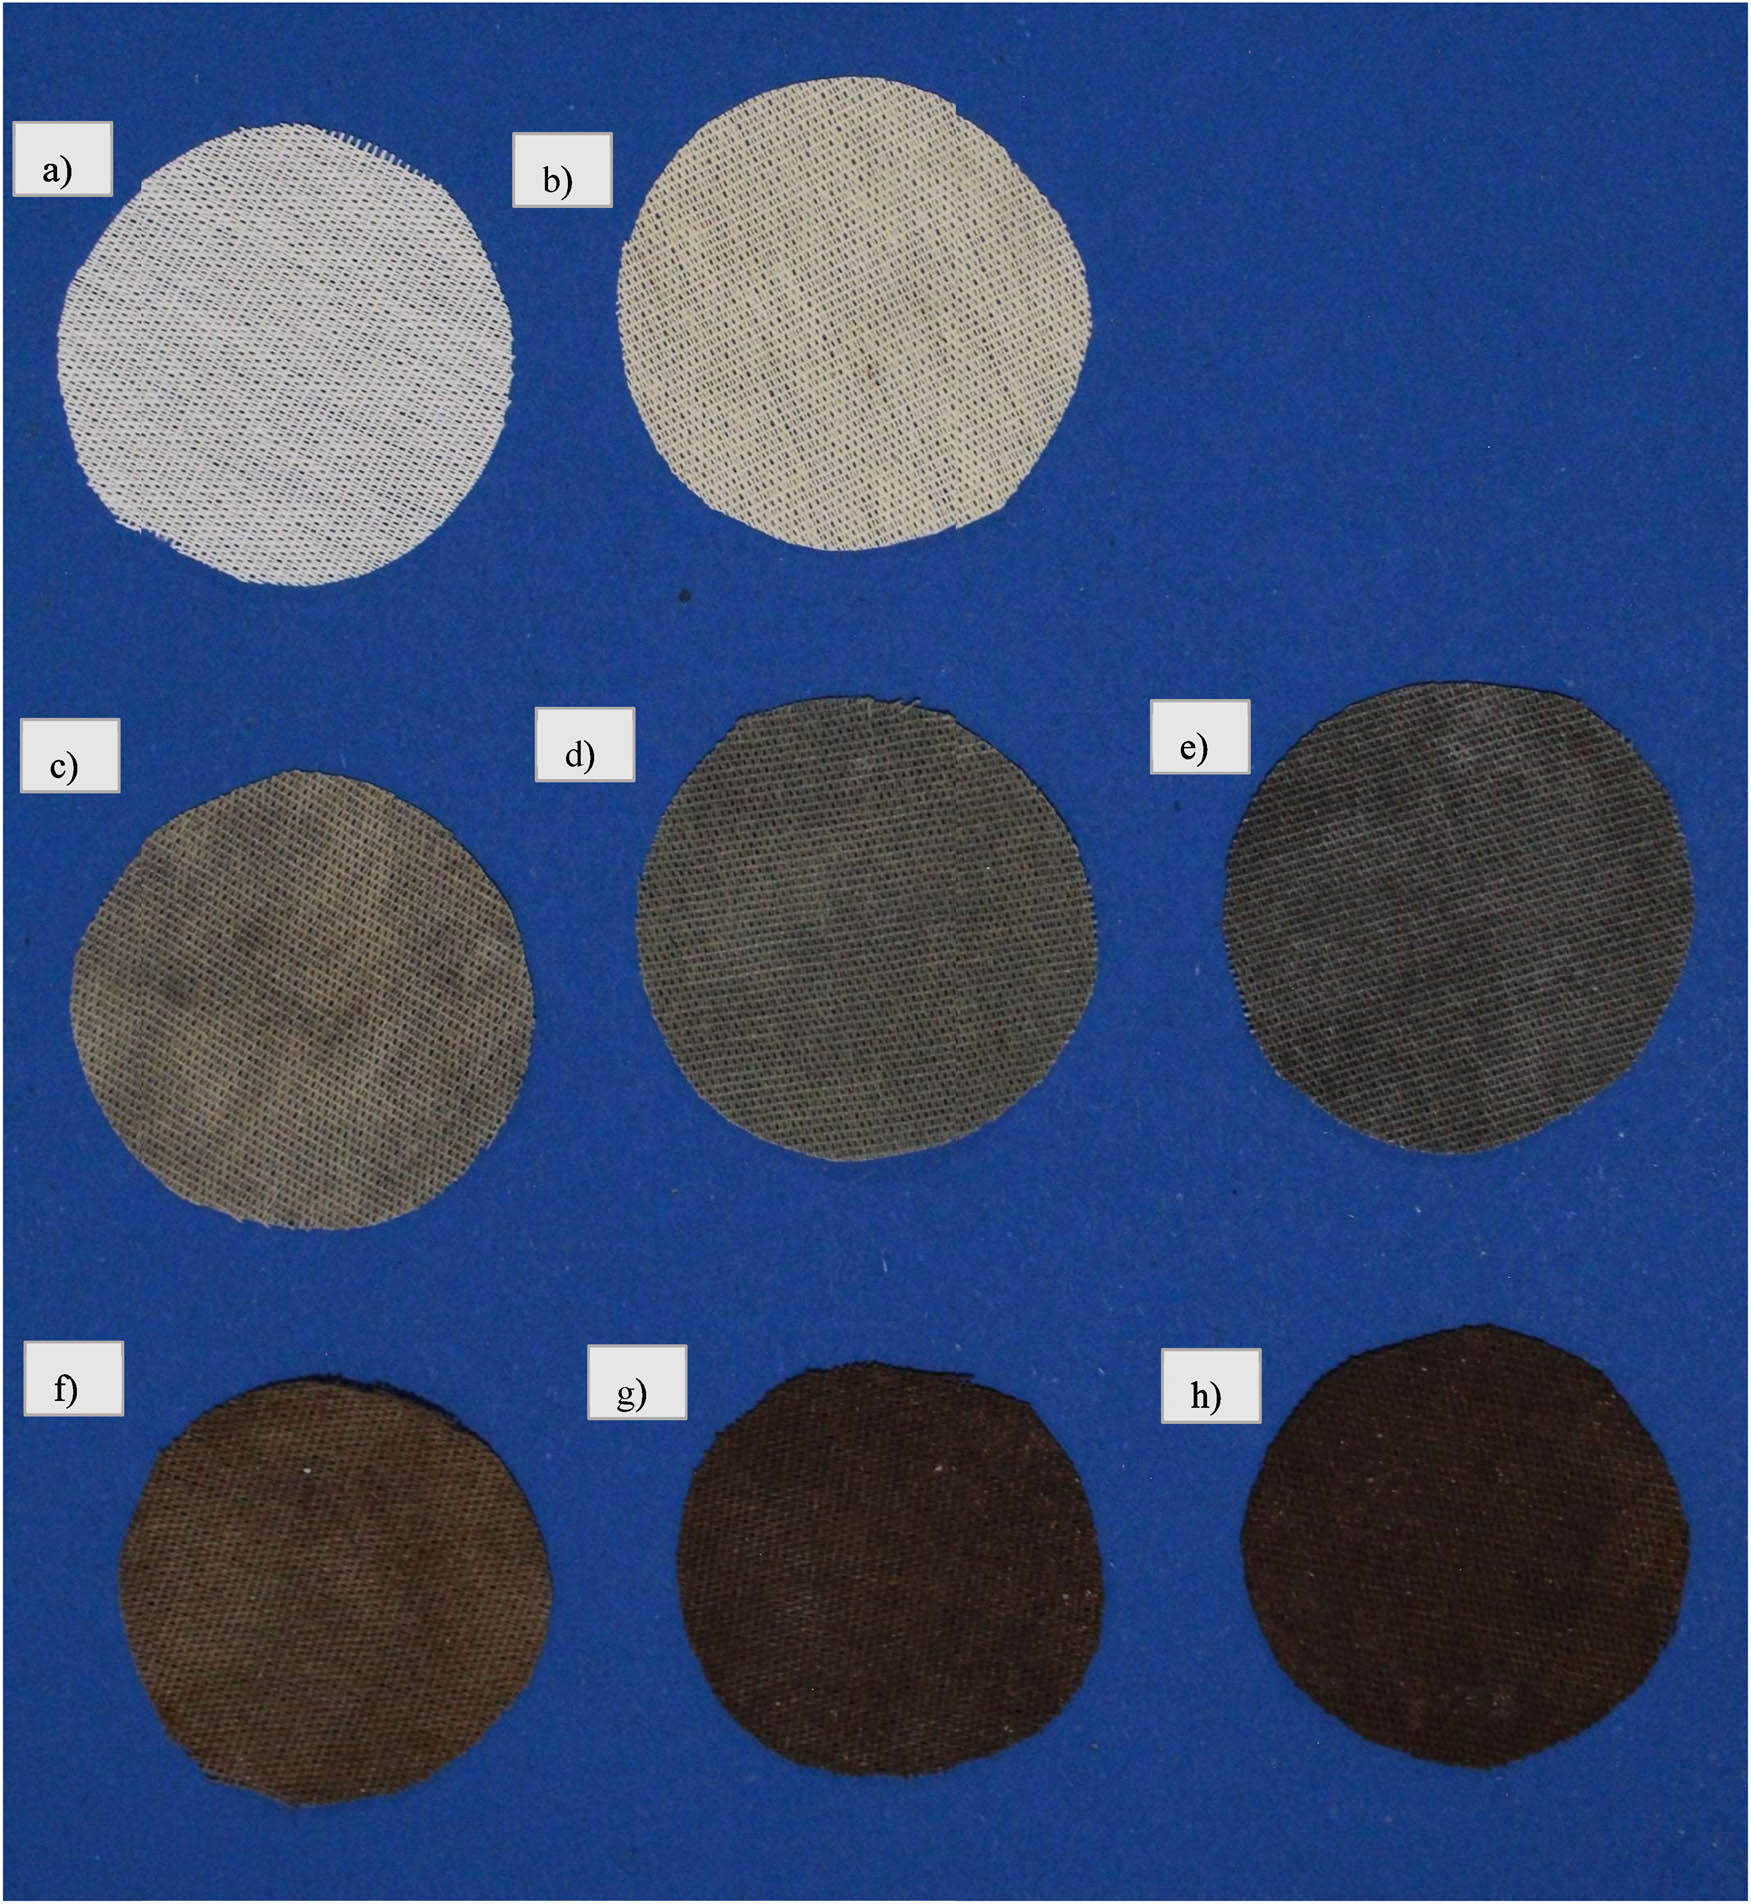
Figure 2
Photograph of membranes: (a) cotton, (b) cotton@PDMS, (c) hierarchical 1%, (d) hierarchical 2%, (e) hierarchical 4%, (f) nanostructures 1%, (g) nanostructures 2%, and (h) nanostructures 4%.
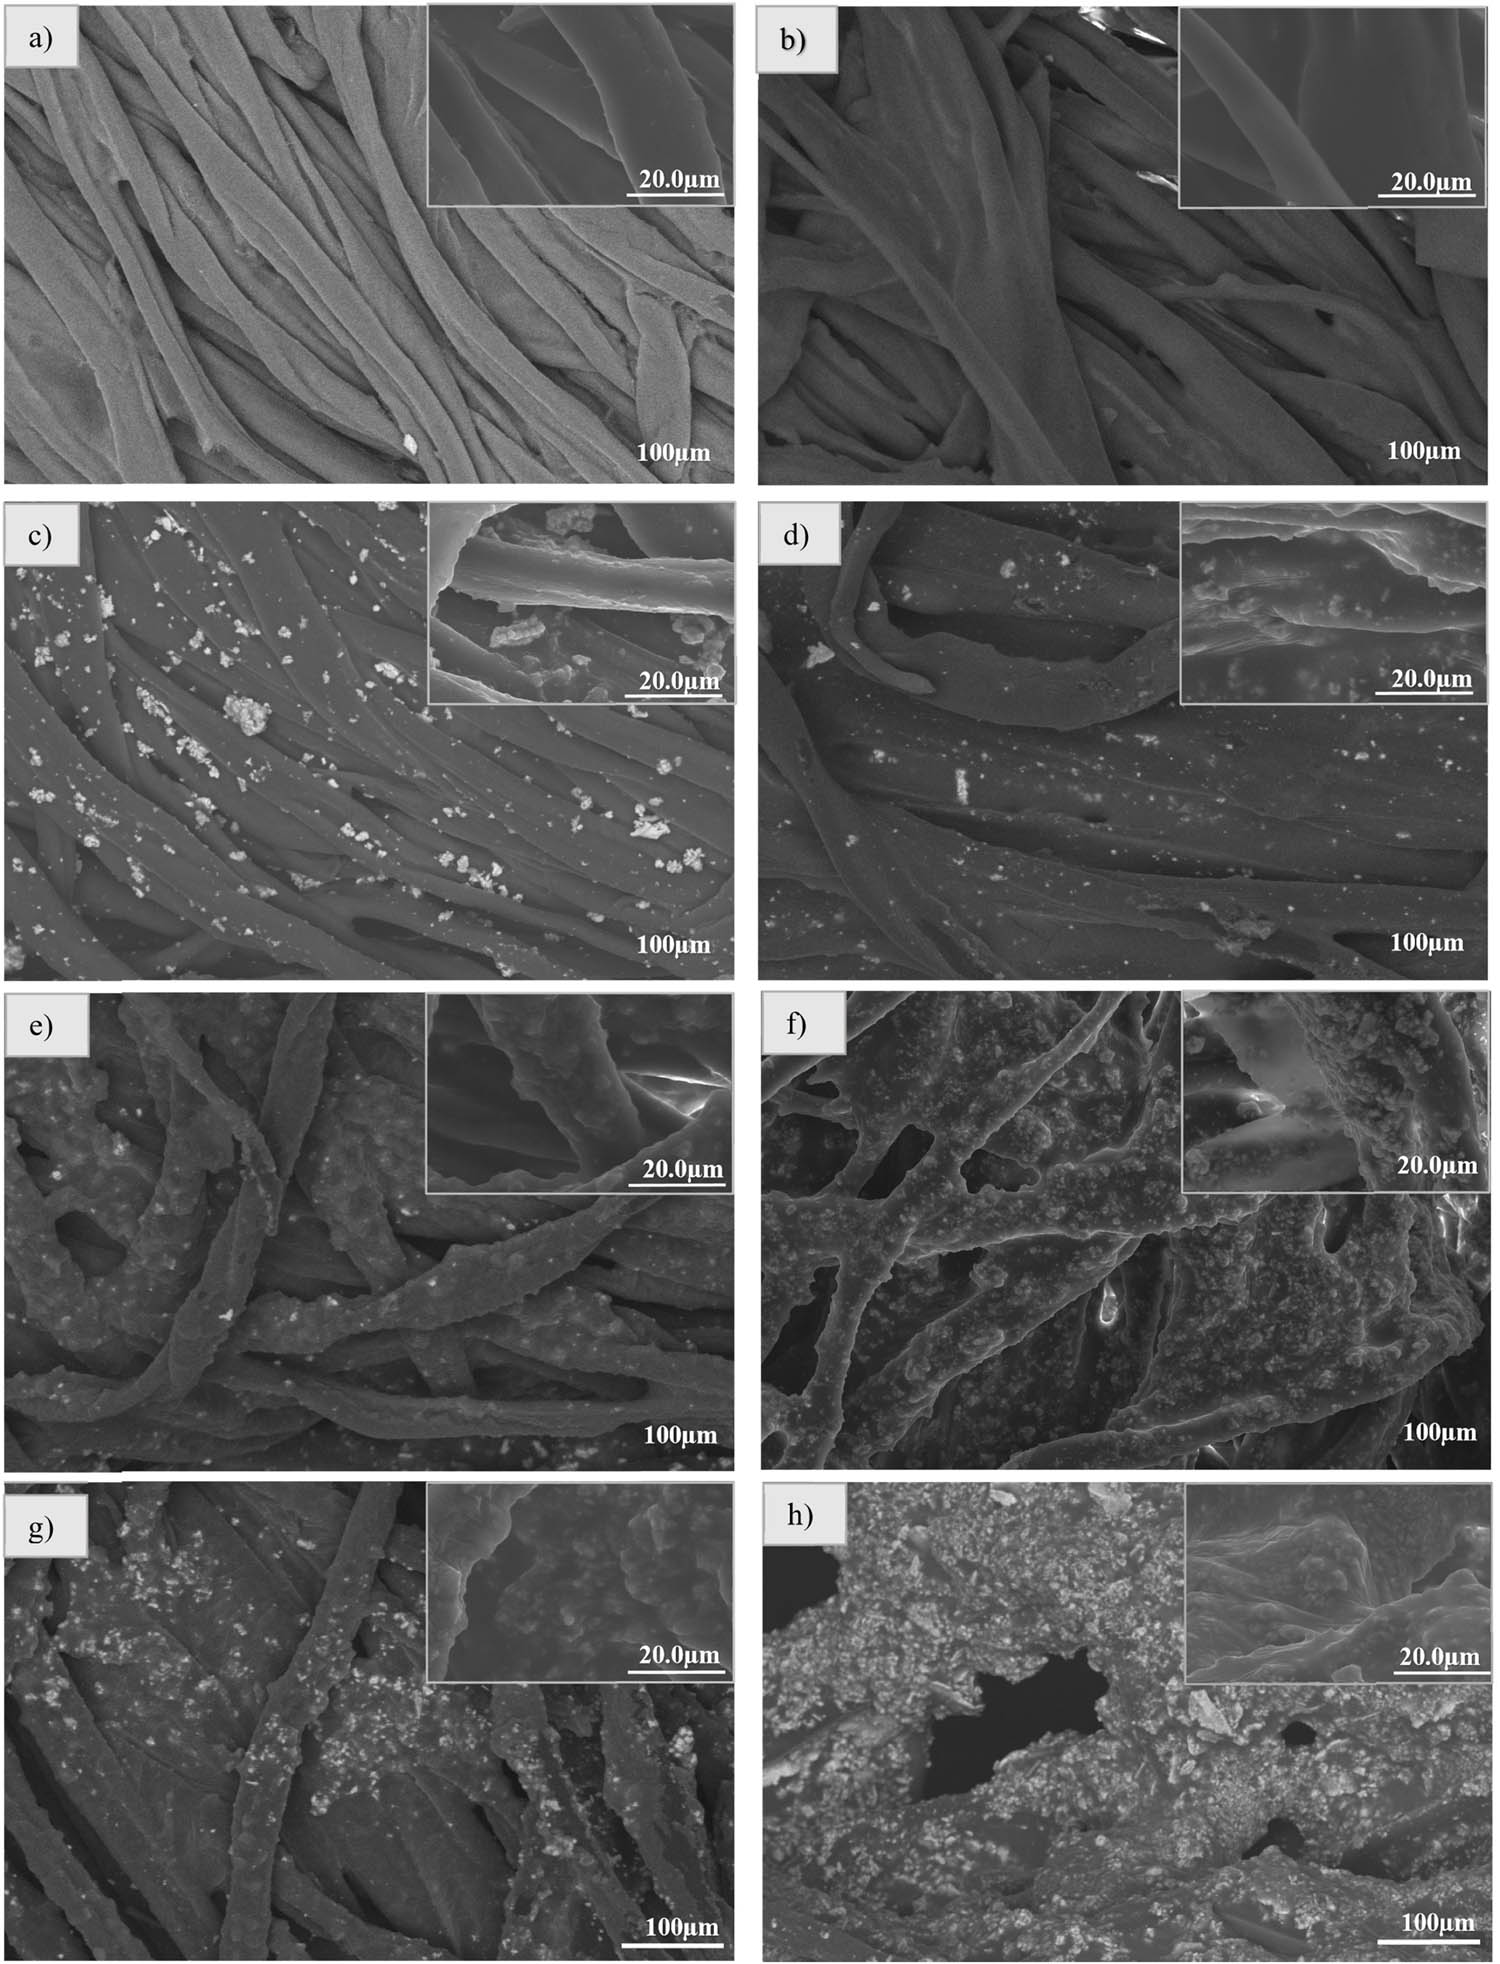
Figure 3
SEM images of membranes: (a) cotton, (b) cotton@PDMS, (c) hierarchical 1%, (d) nanostructures 1%, (e) hierarchical 2%, (f) nanostructures 2%, (g) hierarchical 4%, and (h) nanostructures 4%.
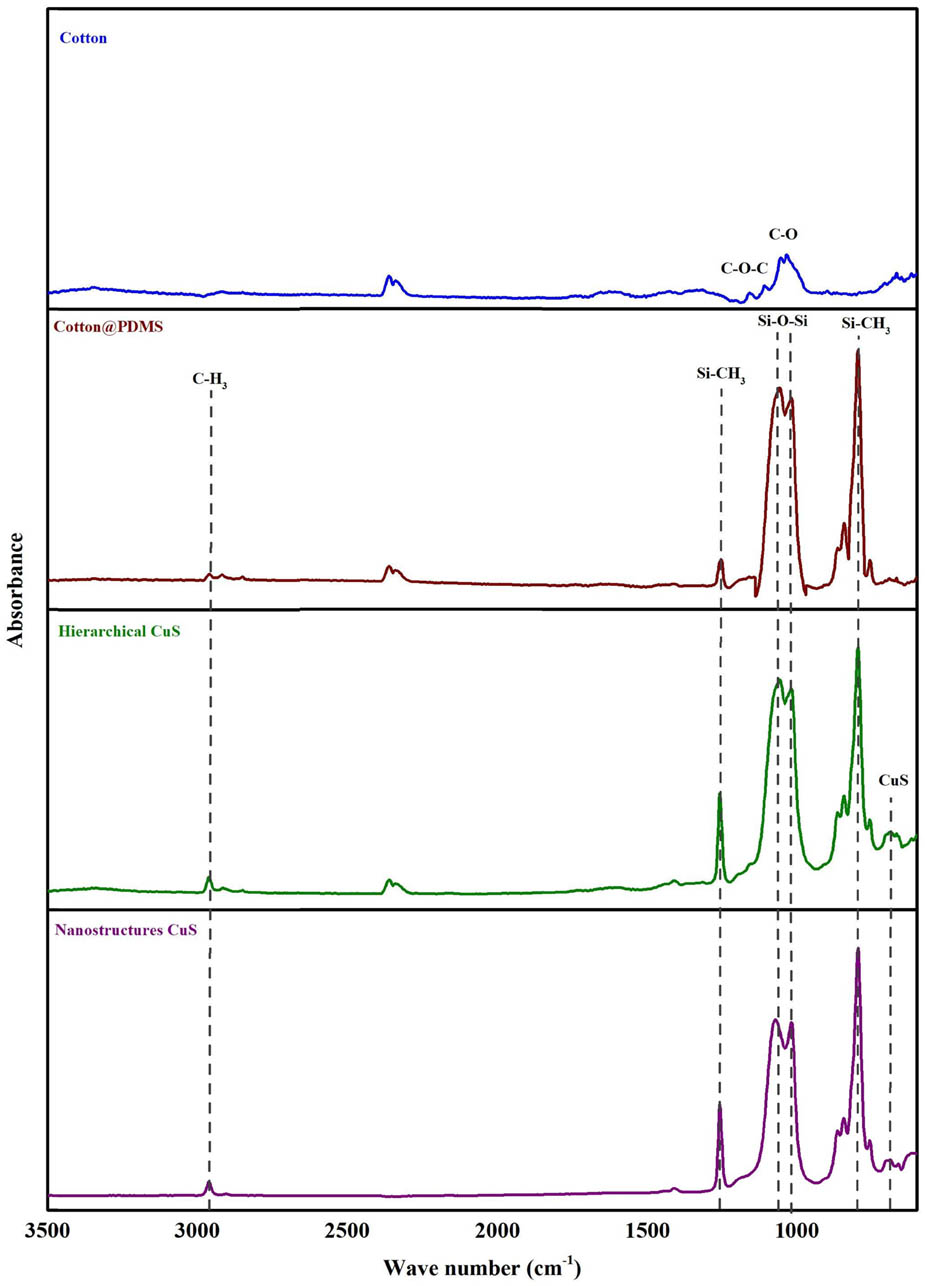
Figure 4
FTIR spectra of cotton, PDMS@Cotton, and PDMS@Cotton@Cu.
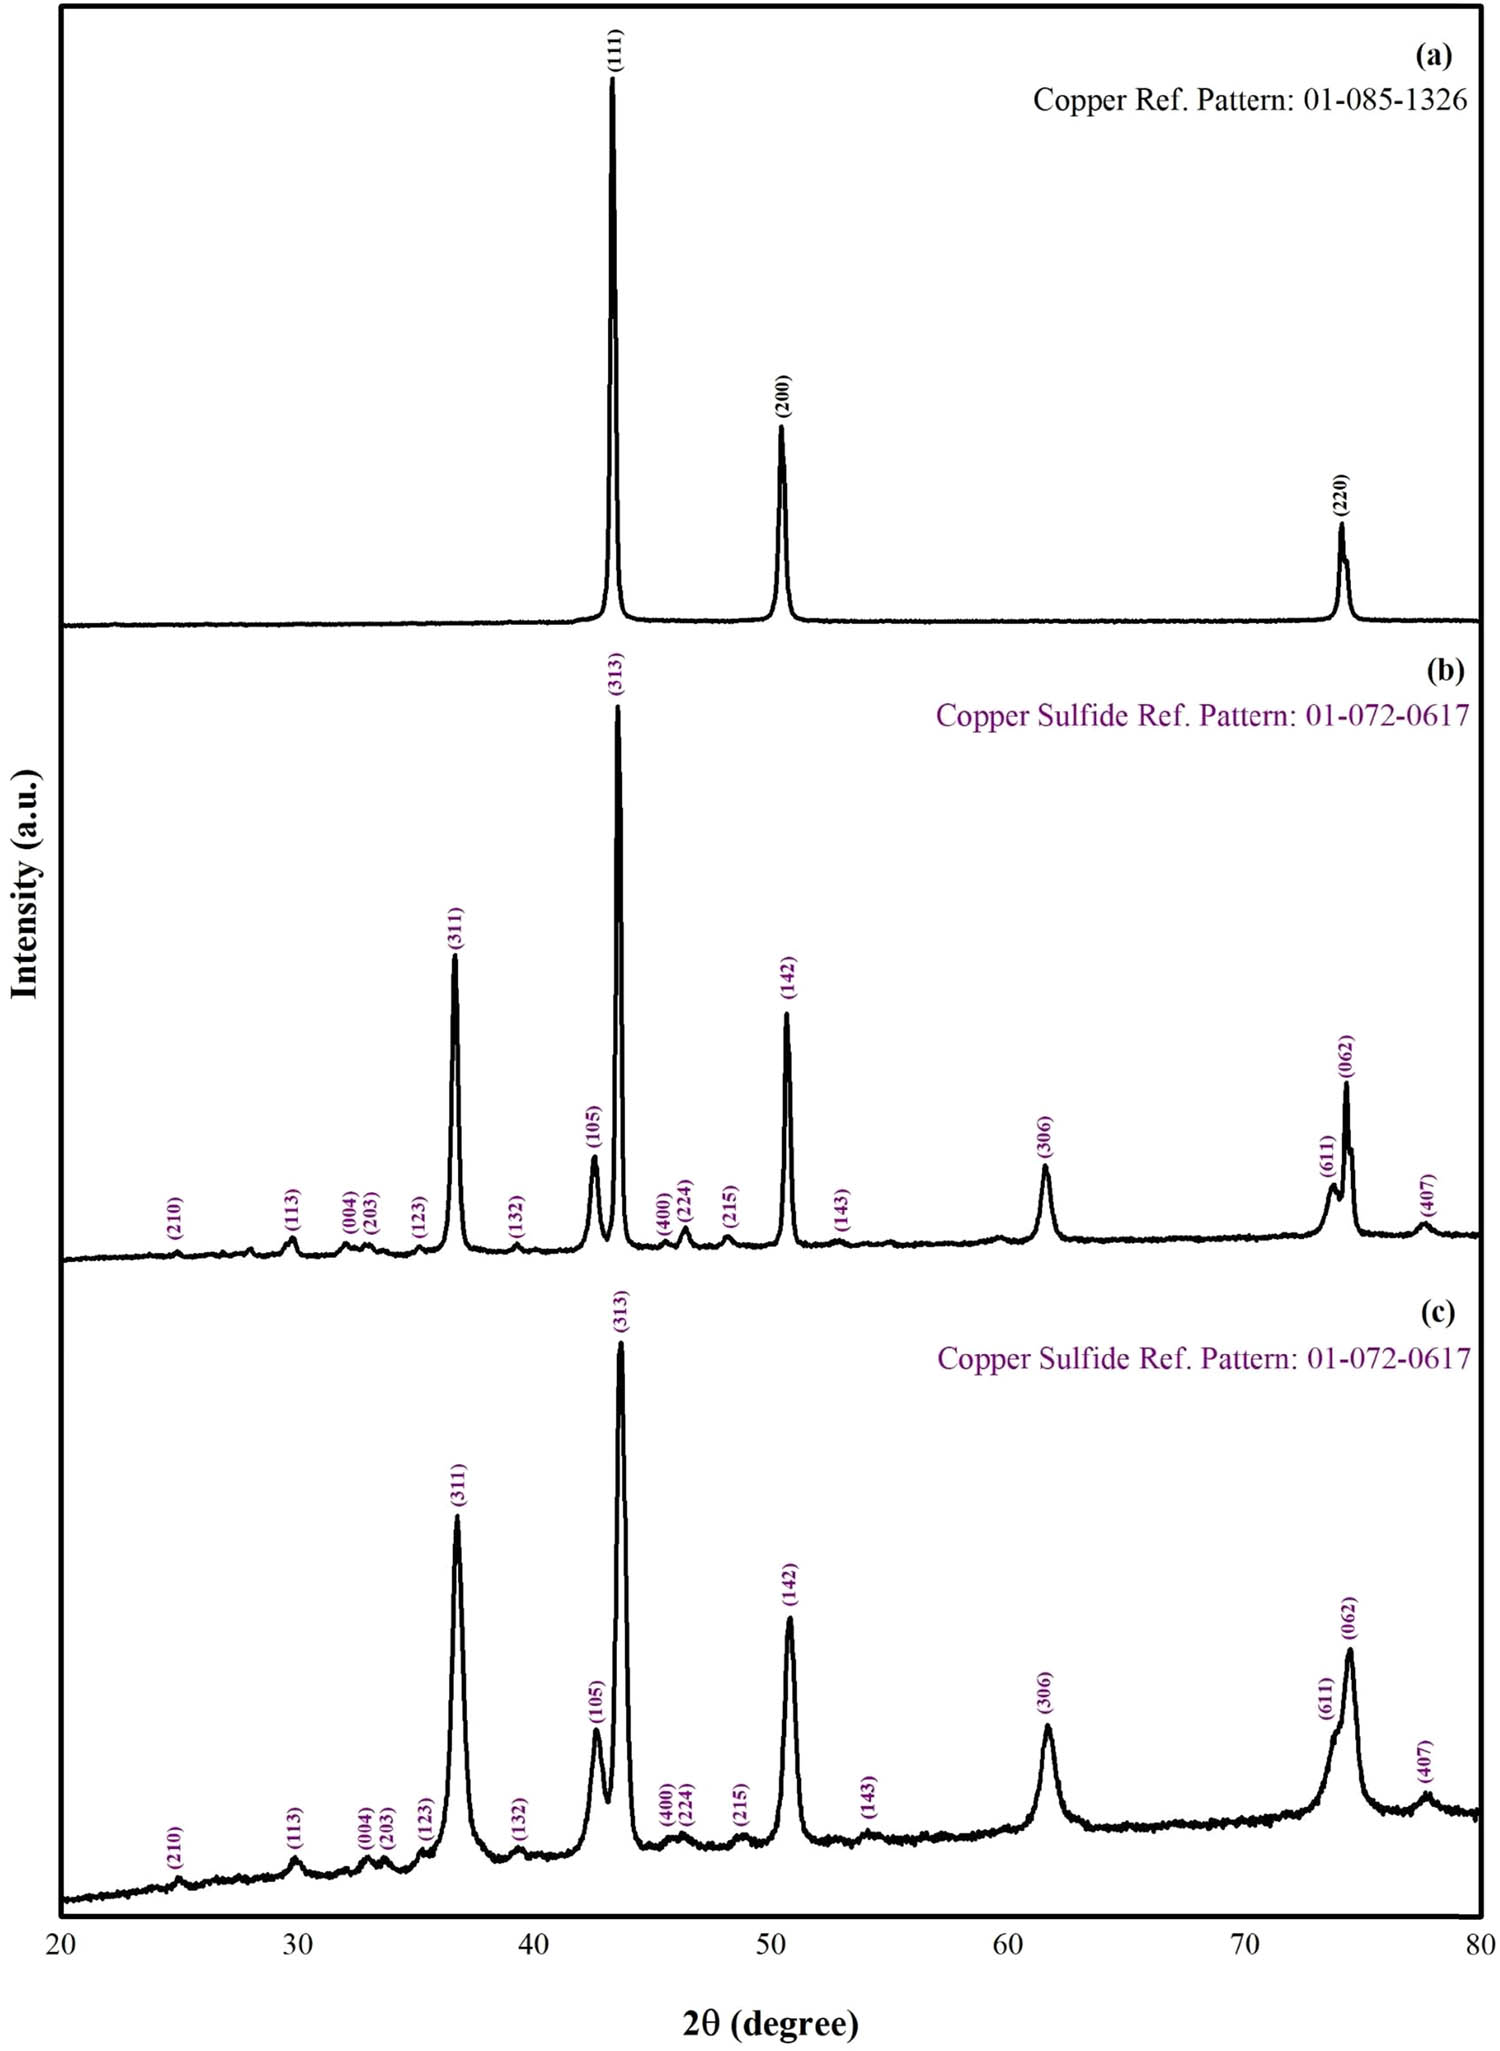
Figure 5
XRD characterization of (a) copper, (b) hierarchical CuS, and (c) CuS nanostructures.
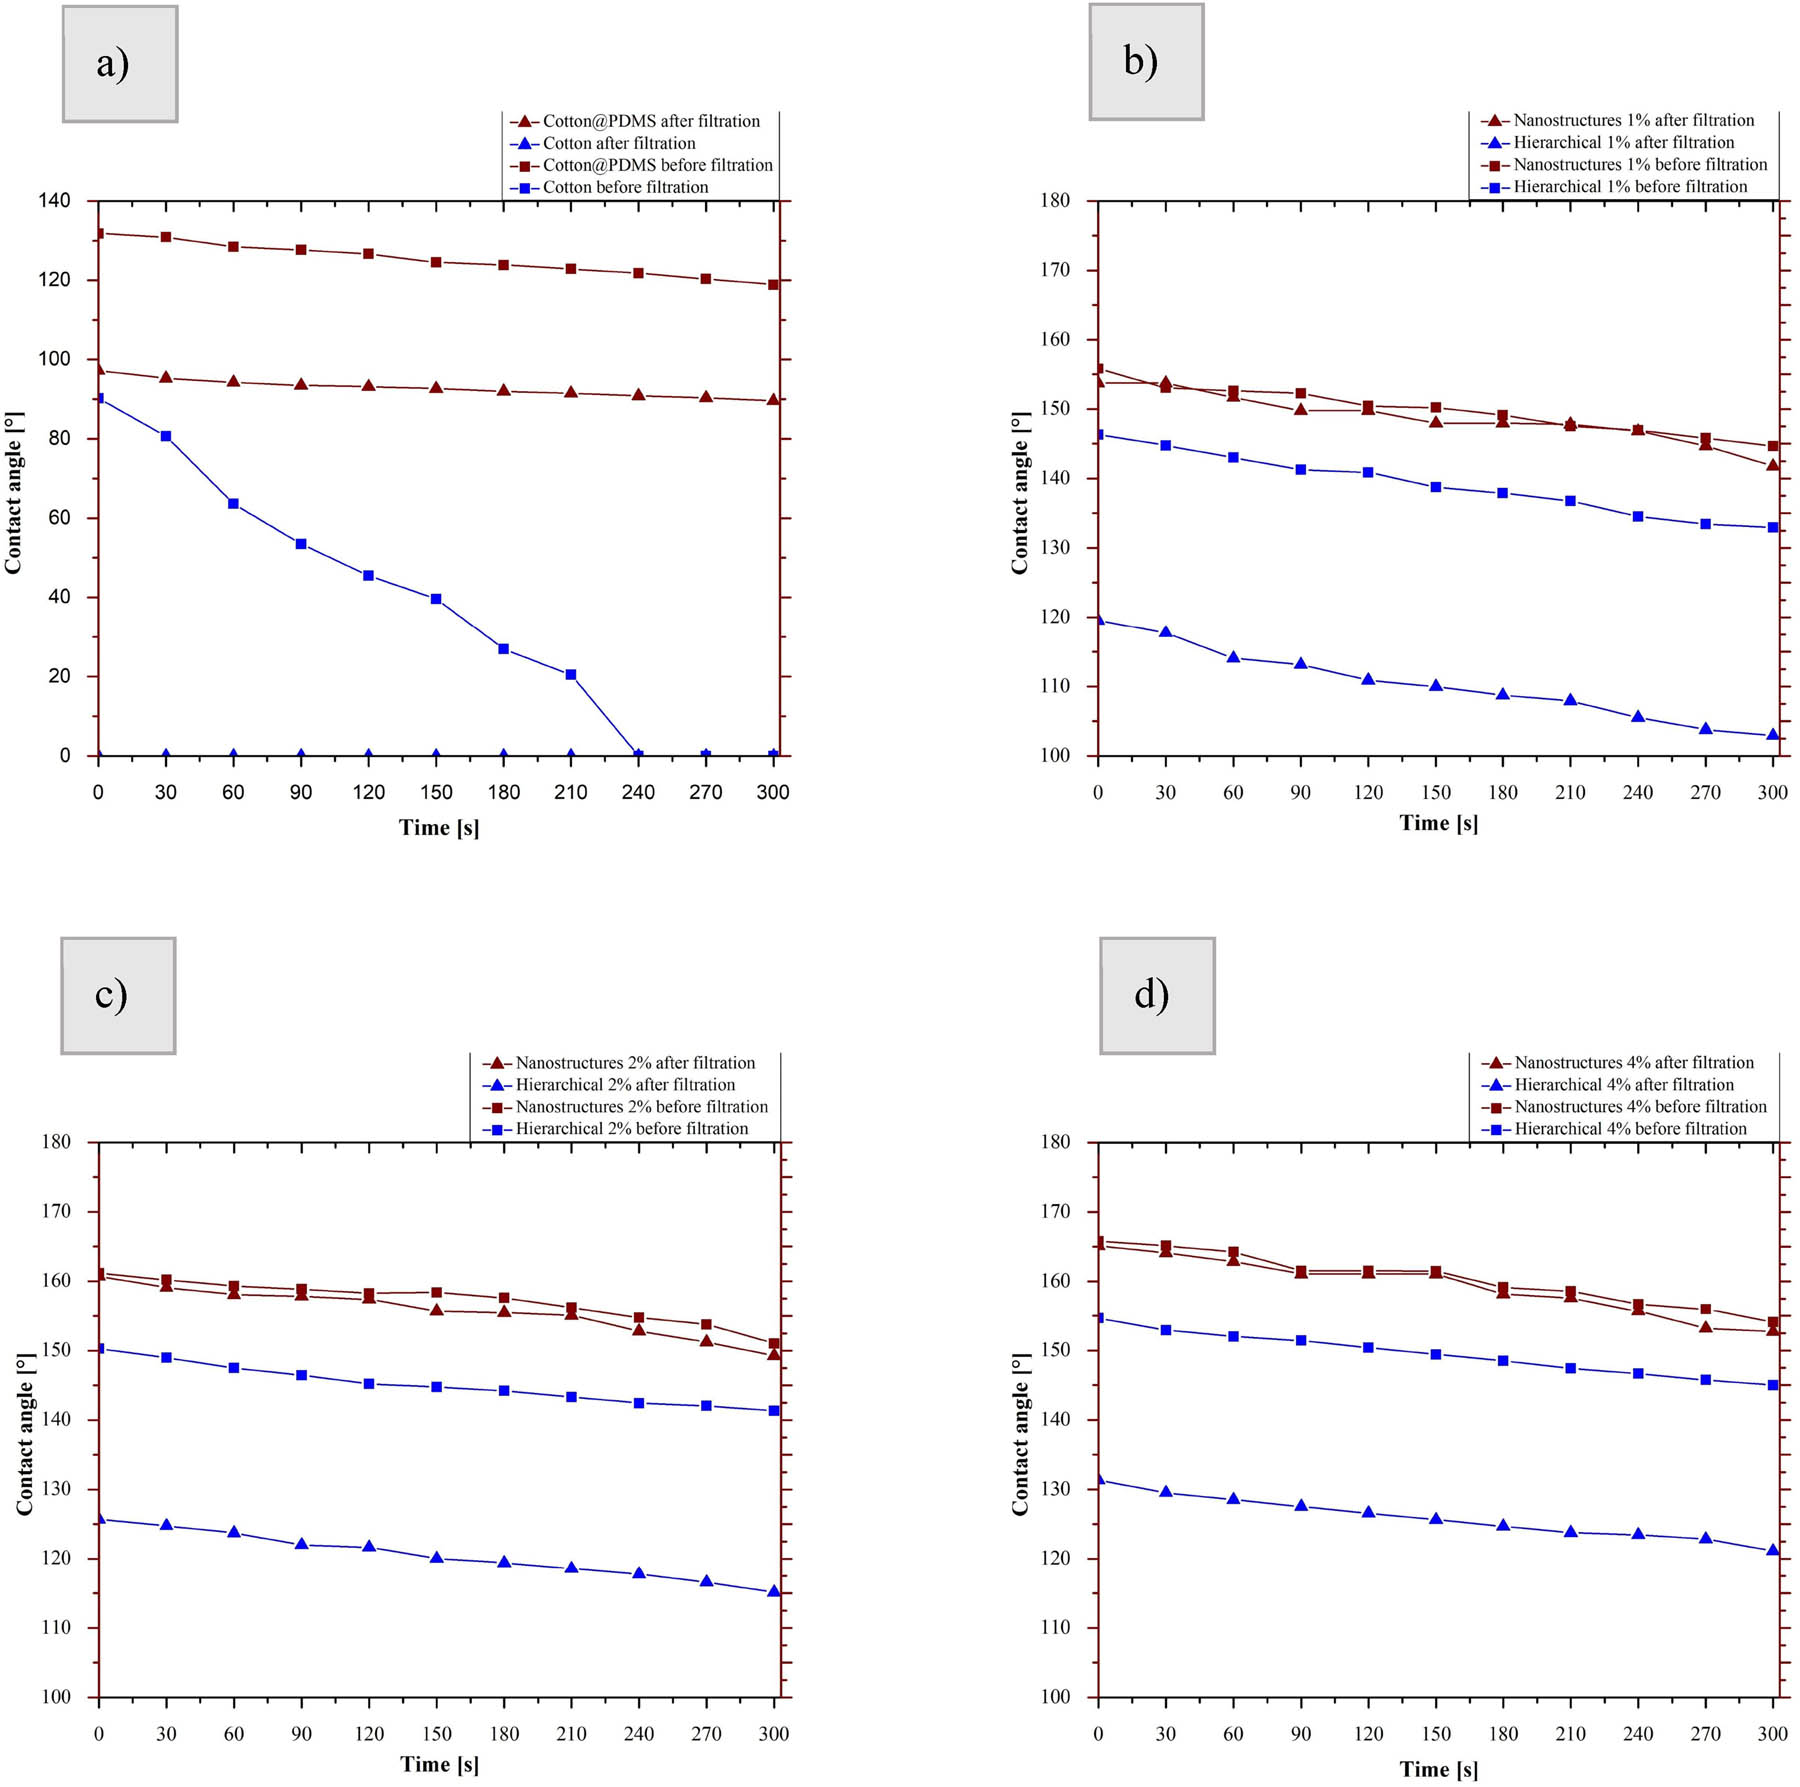
Figure 6
Comparison of the contact angle before and after filtration: (a) cotton and cotton@PDMS, (b) hierarchical membranes and nanostructures 1, (c) hierarchical membranes and nanostructures 2, and (d) hierarchical membranes and nanostructures 4.
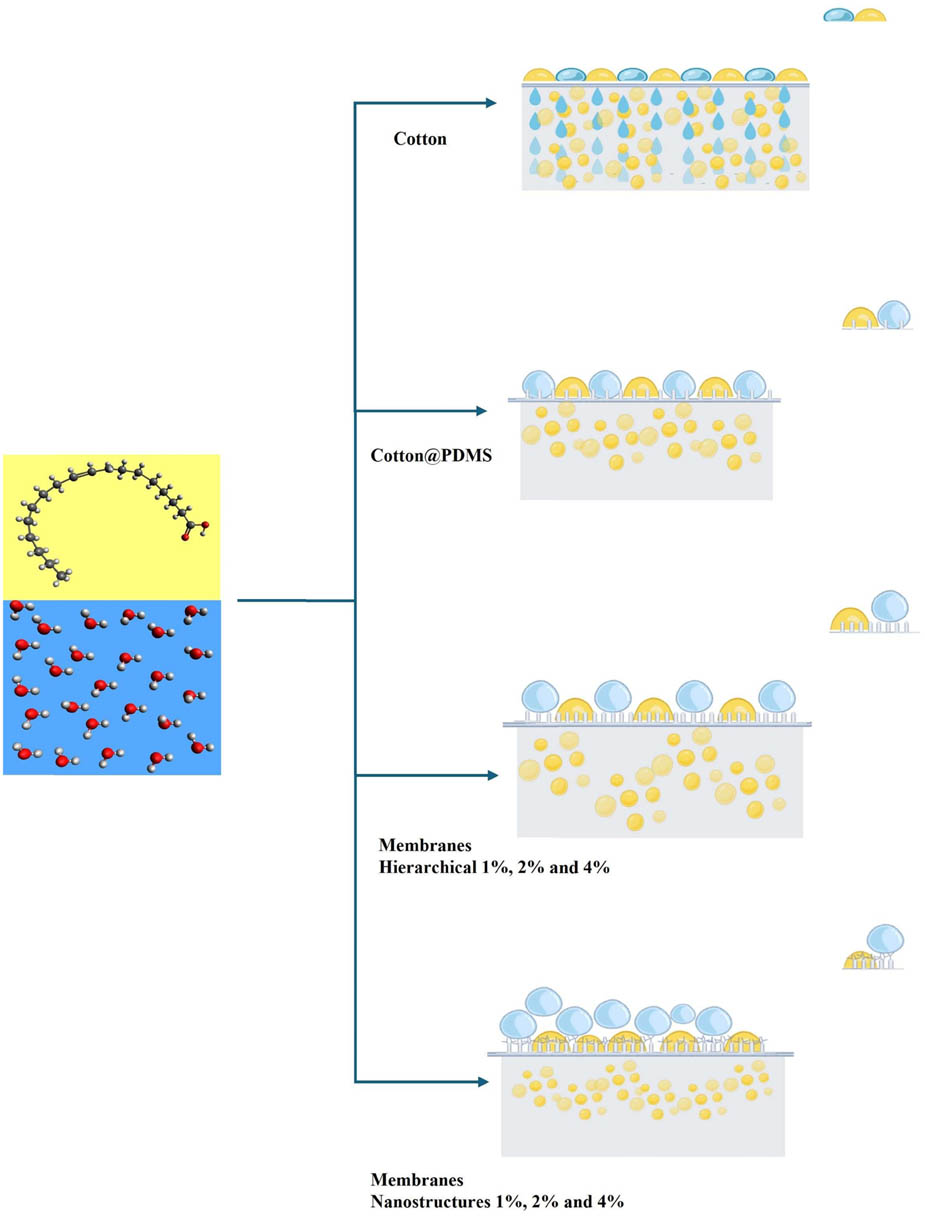
Figure 7
Schematic diagram of water and oil filtration behavior, cotton, cotton@PDMS, hierarchical membranes, and membrane nanostructures.
Table 1
Images of water droplets on membranes.
| 0 s | 300 s | |
|---|---|---|
| Cotton |

|

|
| Cotton@PDMS |

|

|
| Hierarchical 1 |

|

|
| Hierarchical 2 |

|

|
| Hierarchical 4 |

|

|
| Nanostructure 1 |

|

|
| Nanostructure 2 |

|

|
| Nanostructure 4 |

|

|
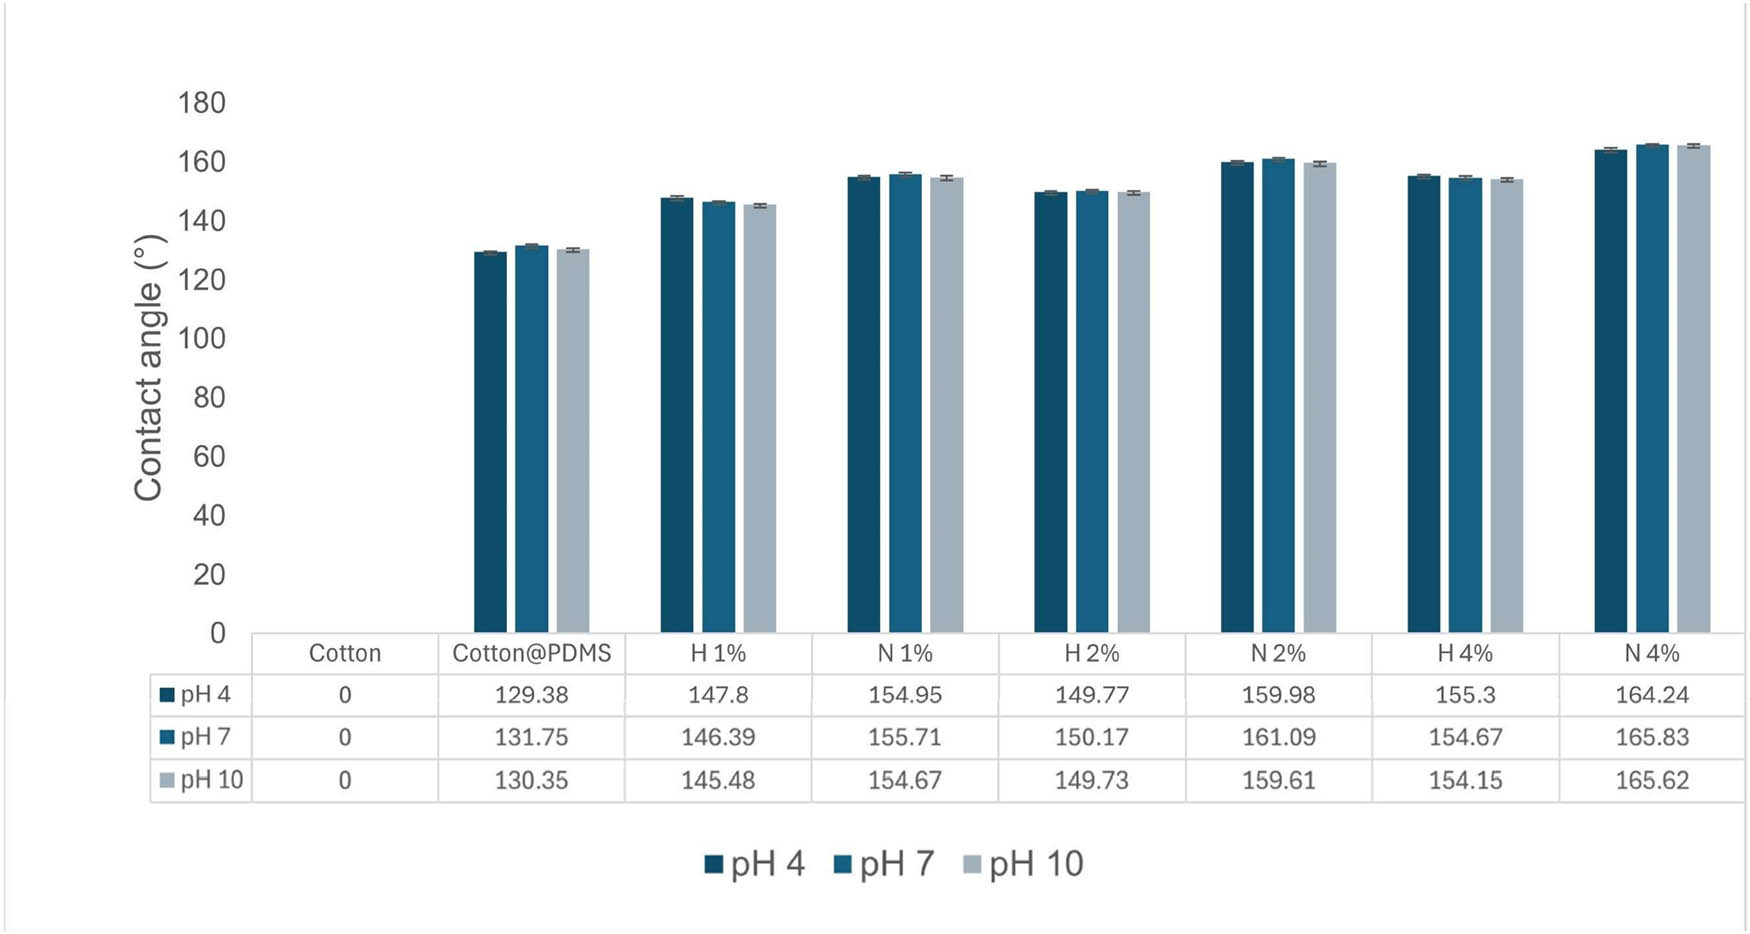
Figure 8
Contact angle measurements of membranes at varying pH and copper sulfide concentrations.
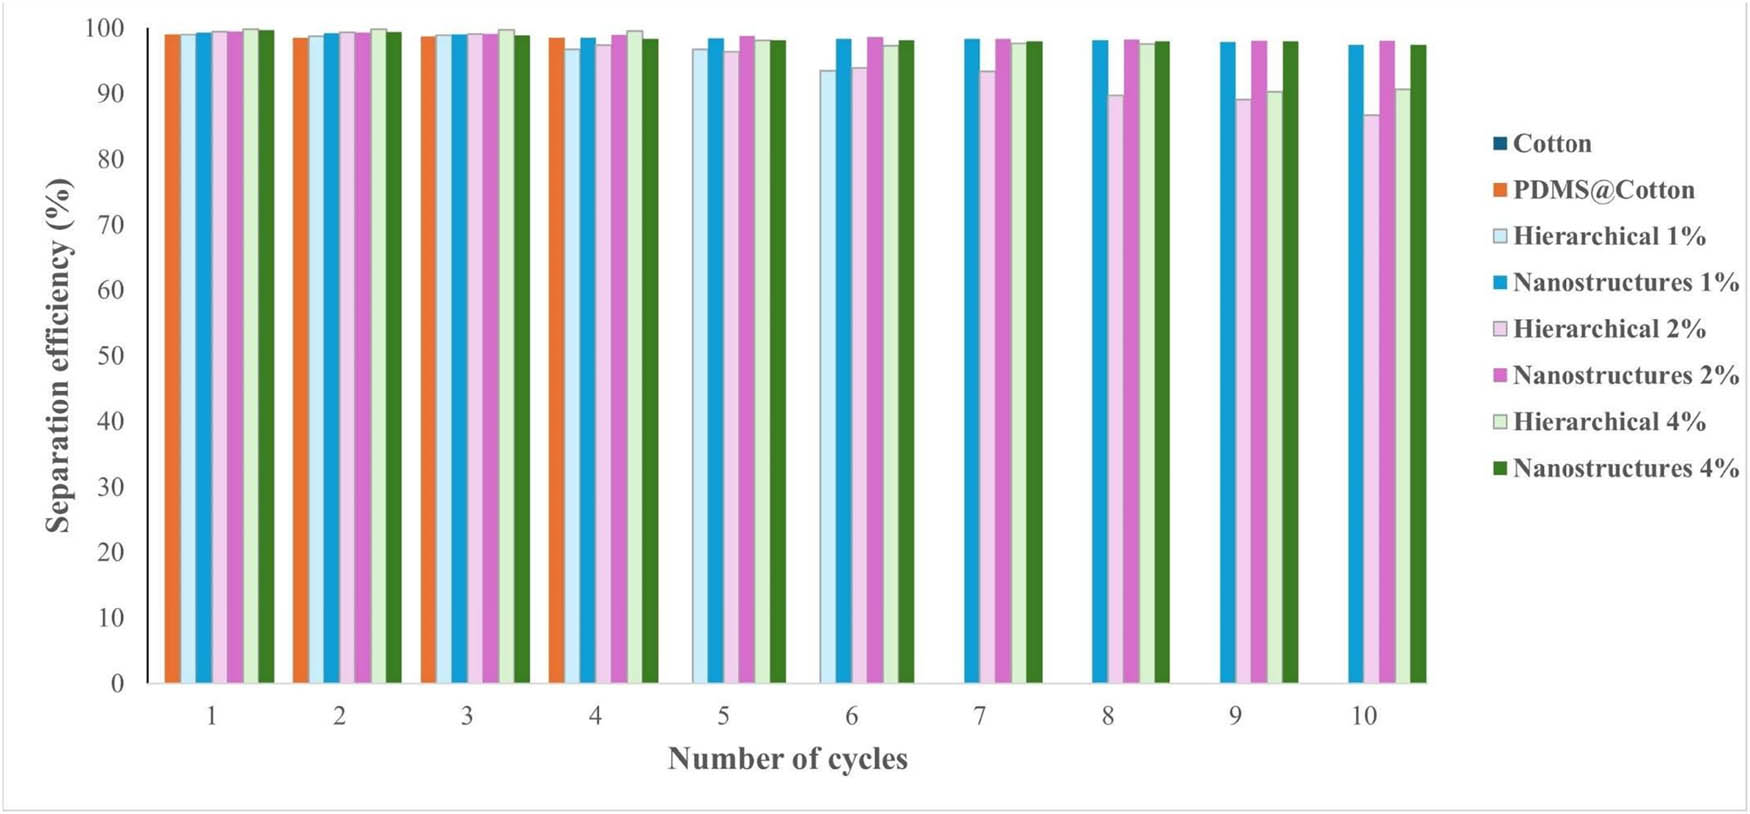
Figure 9
Separation efficiency.