Figure 1
Figure 2
Figure 3
Figure 4
Figure 5
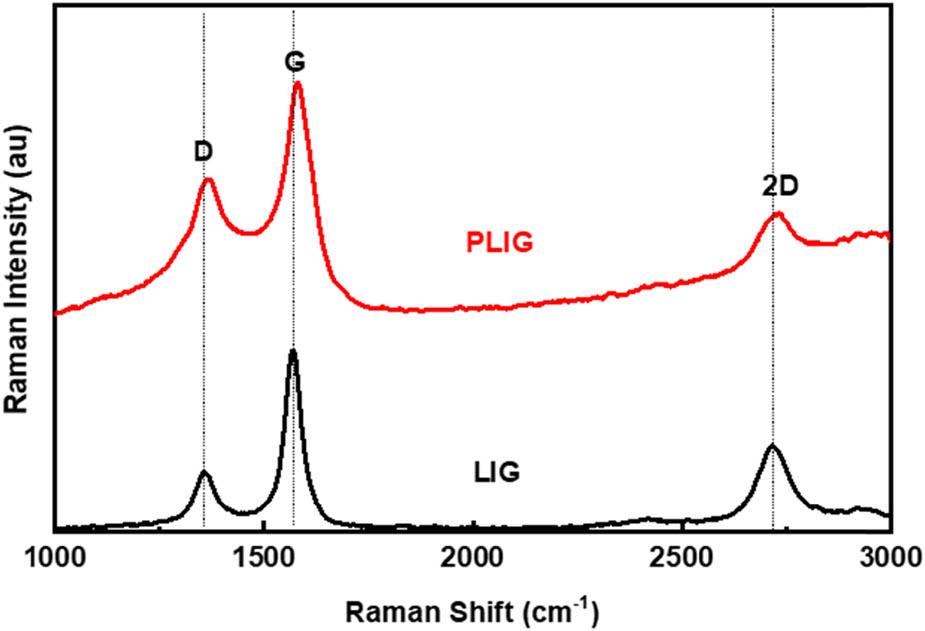
Figure 6
Figure 7
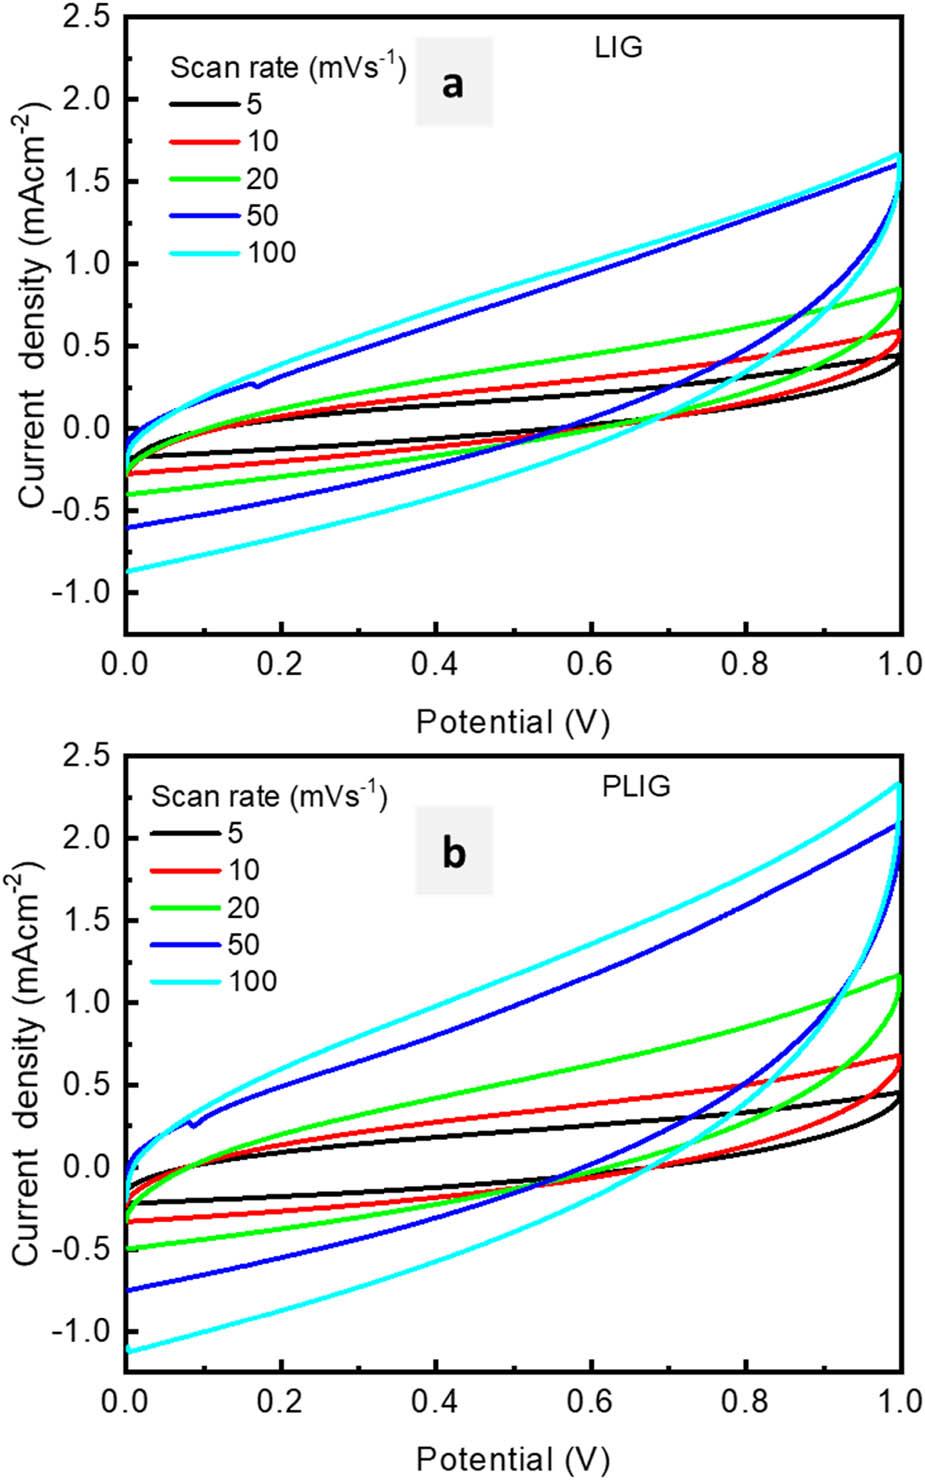
Figure 8
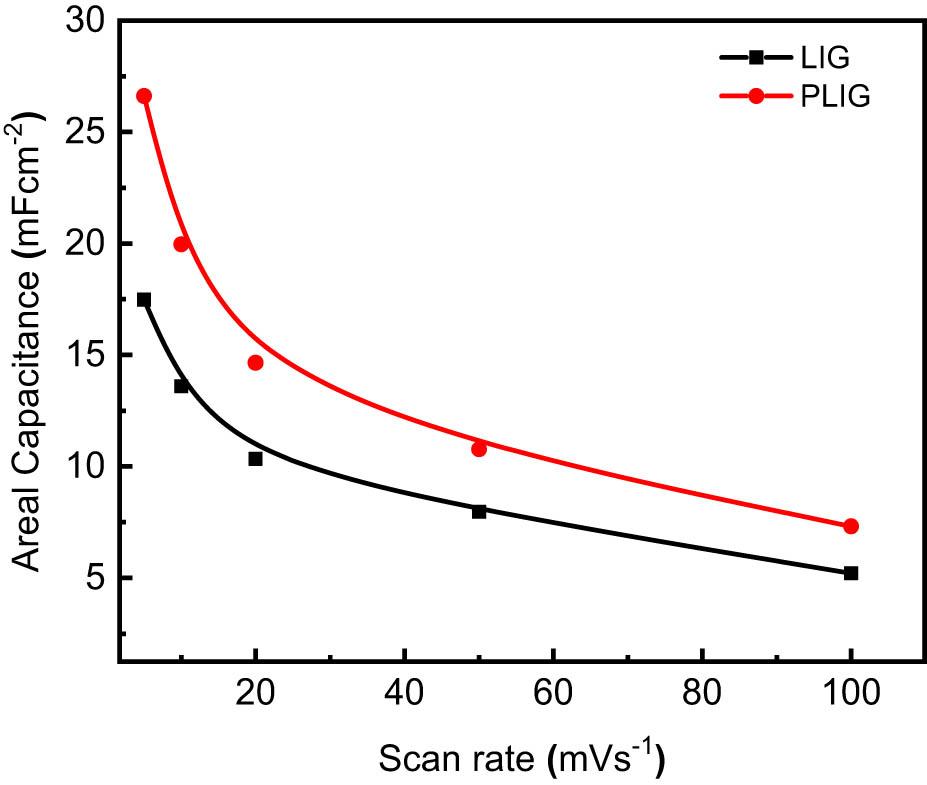
Figure 9
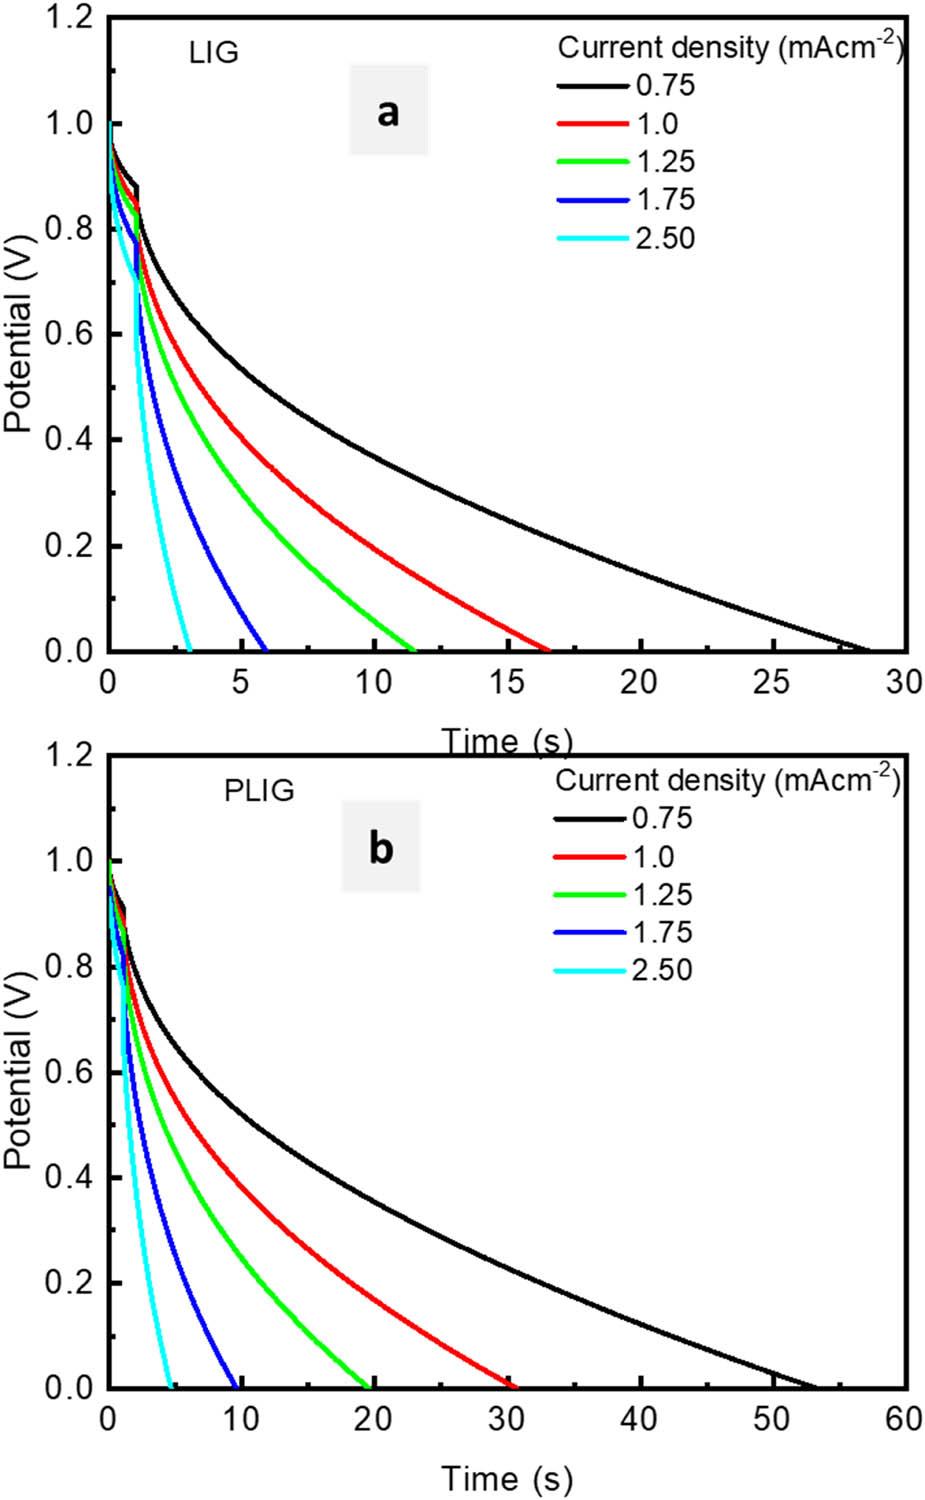
Figure 10
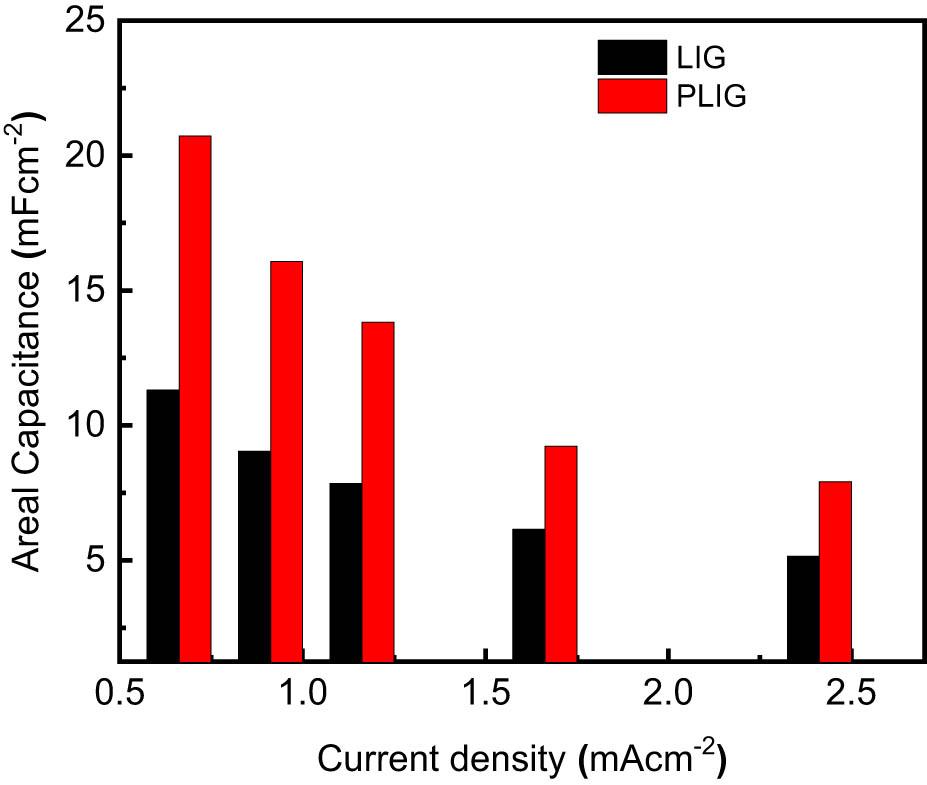
Figure 11
Raman parameters for bare graphene and K-doped graphene_
| Sample | FWHM (cm−1) | D band (cm−1) | G band (cm−1) | 2D band (cm−1) | I D/G | I 2D/G | ||
|---|---|---|---|---|---|---|---|---|
| D band | G band | 2D band | ||||||
| LIG | 65.2 | 46.2 | 117.1 | 1,357 | 1,567 | 2,720 | 0.28 | 0.42 |
| PLIG | 169.2 | 76.4 | 242.7 | 1,369 | 1,580 | 2,743 | 0.54 | 0.38 |
Comparison between supercapacitor electrodes made from laser-induced graphene_
| Electrode | Areal capacitance | Areal energy | Areal power | References |
|---|---|---|---|---|
| Graphene | 0.8 mF/cm2 at 10 mV/s | — | — | [32] |
| Graphene | 34 mF/cm2 at 0.1 mA/cm2 | 1.0 mWh/cm3 | 11 mW/cm3 | [33] |
| Graphene + MoS2 + MnS | 58.3 mF/m2 at 50 mA/cm2 | 7 µWh/cm2 | 49.9 µW/cm2 | [34] |
| NiO/Co3O4/graphene | 29.5 mF/cm2 at 0.05 mA/cm2 | — | — | [35] |
| Graphene | 6.1 mF/cm2 at 20 mV/s | 0.96 µWh/cm2 | 0.25 mW/cm2 | [36] |
| LIG | 11 mF/cm2 at 0.75 mA/cm2 | 1.5 µWh/cm2 | 186 µW/cm2 | Present work |
| PLIG | 21 mF/cm2 at 0.75 mA/cm2 | 2.8 µWh/cm2 |