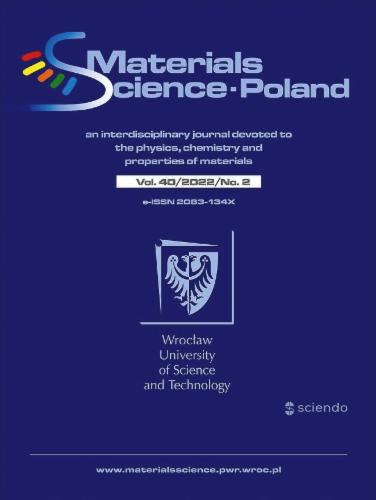
Figure 1
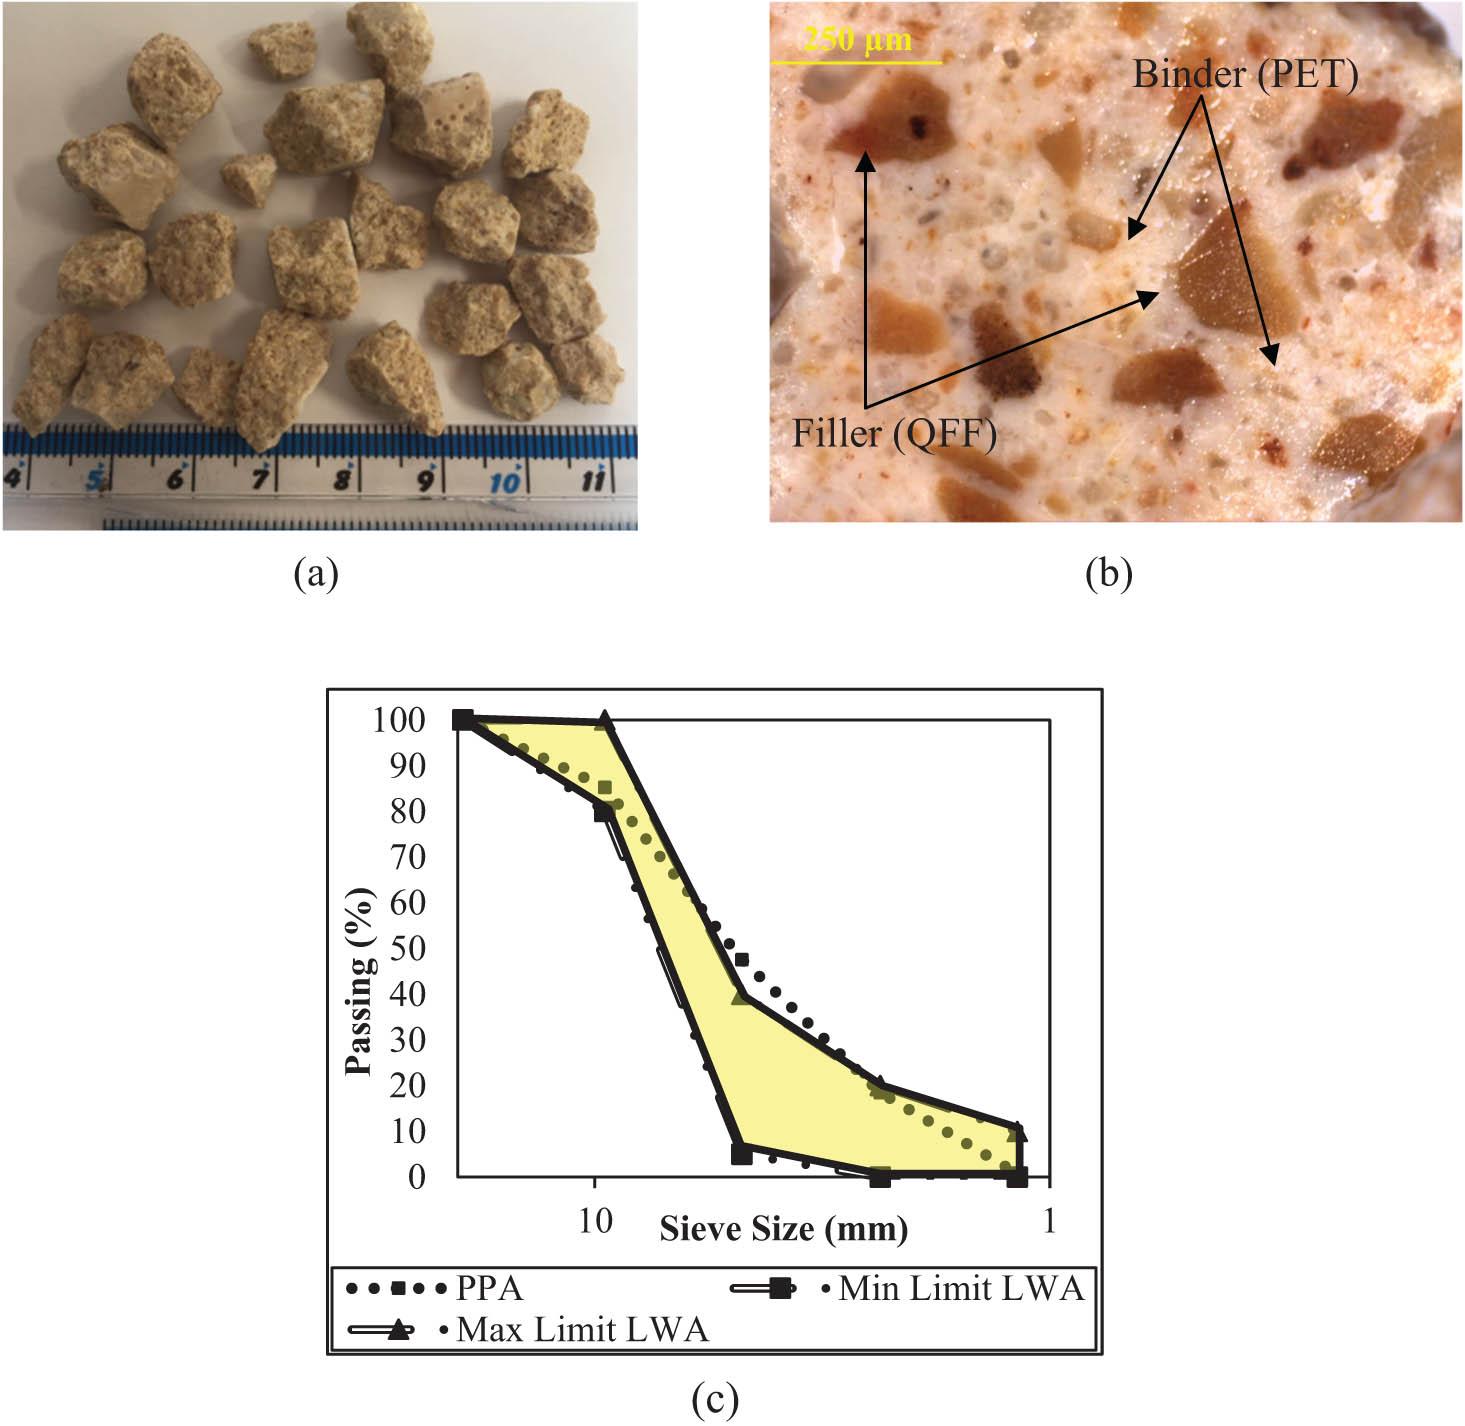
Figure 2
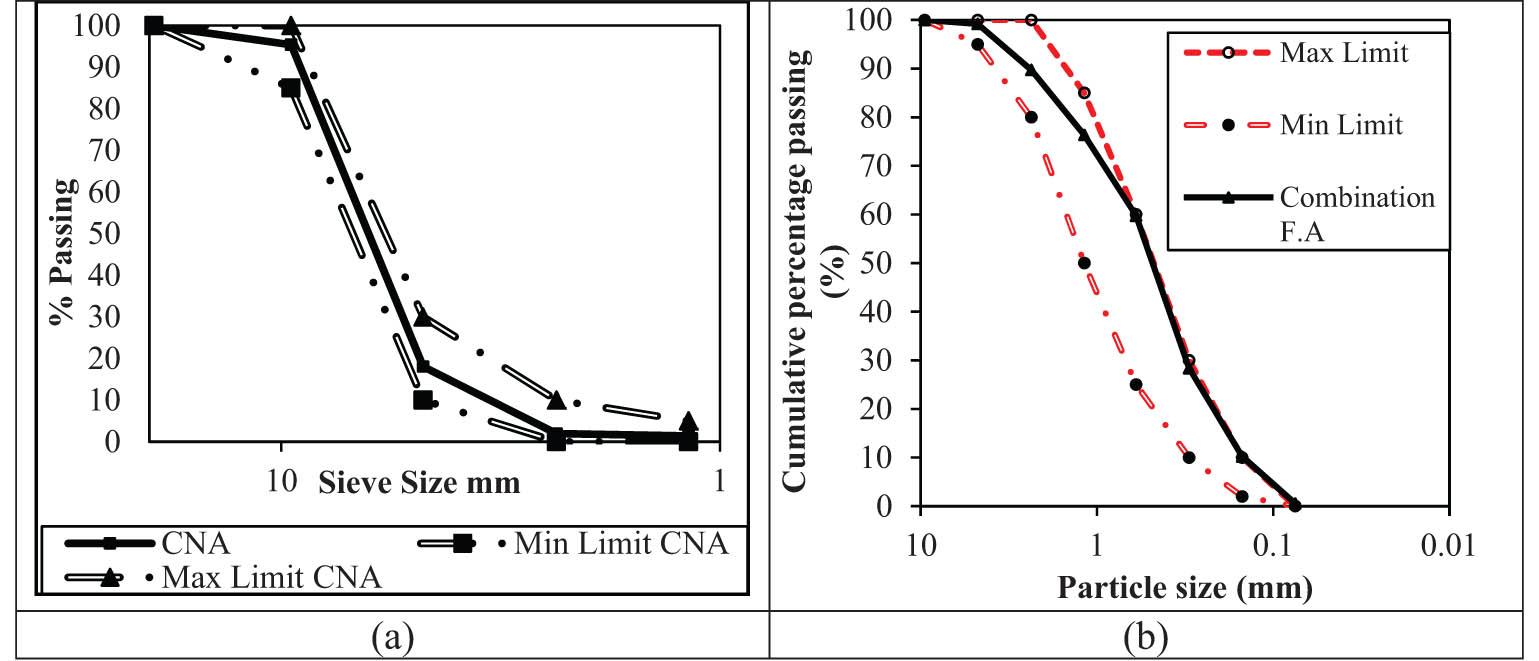
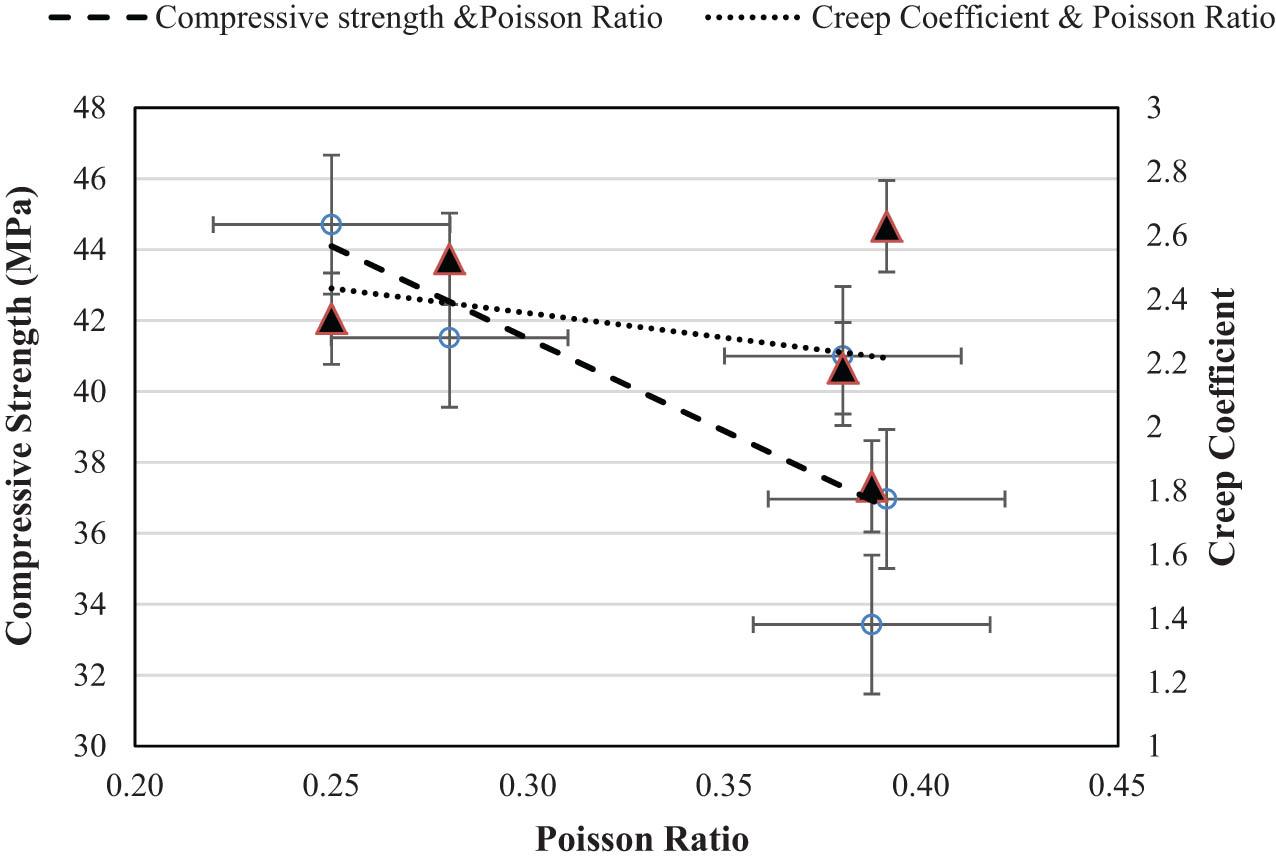
Figure 3
Figure 4
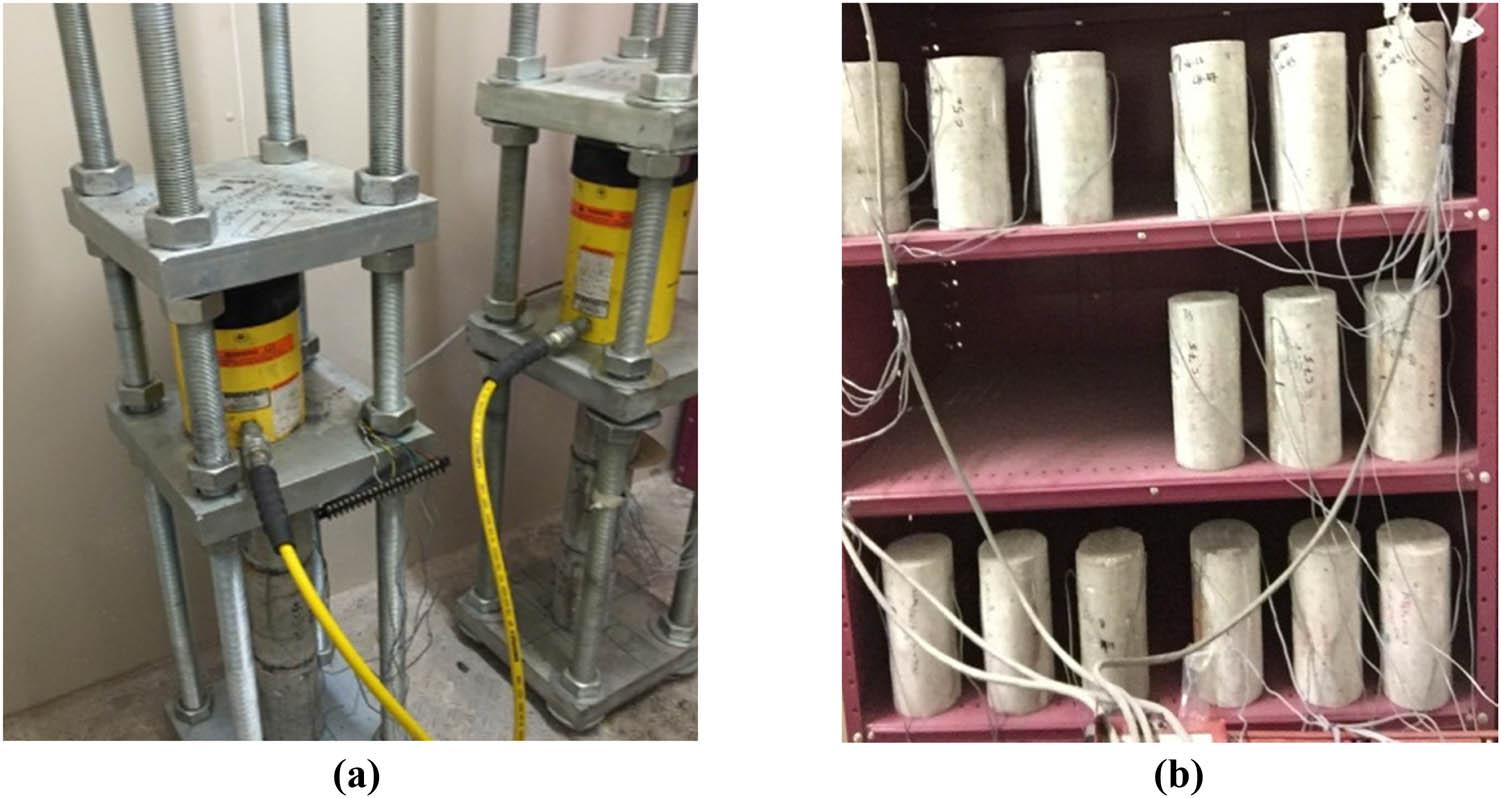
Figure 5
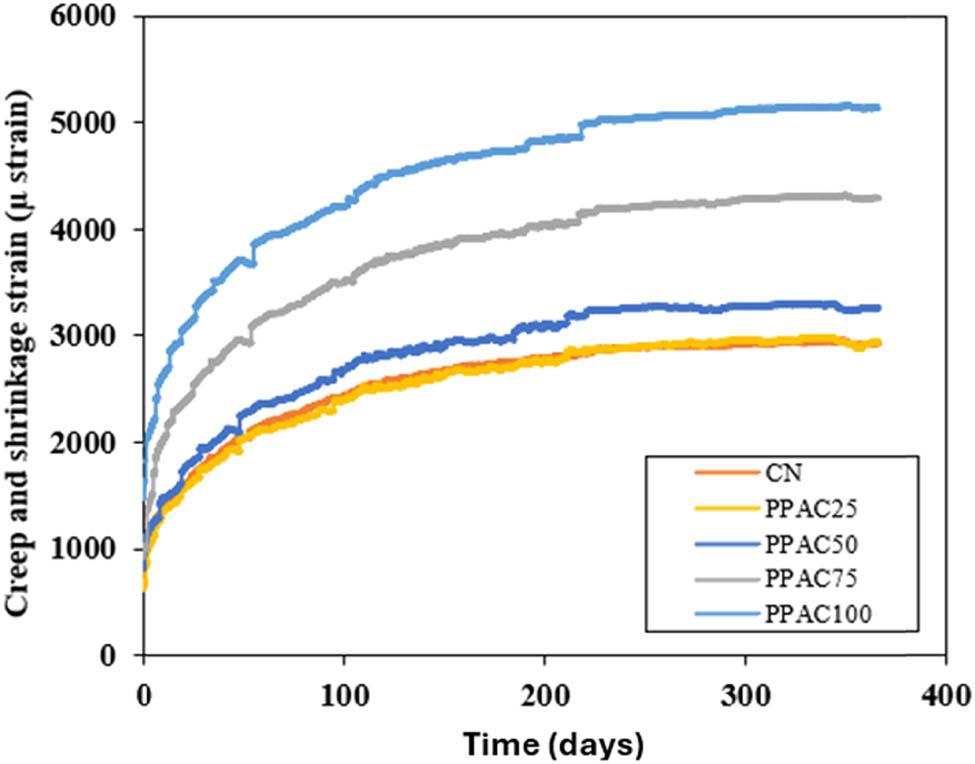
Figure 6
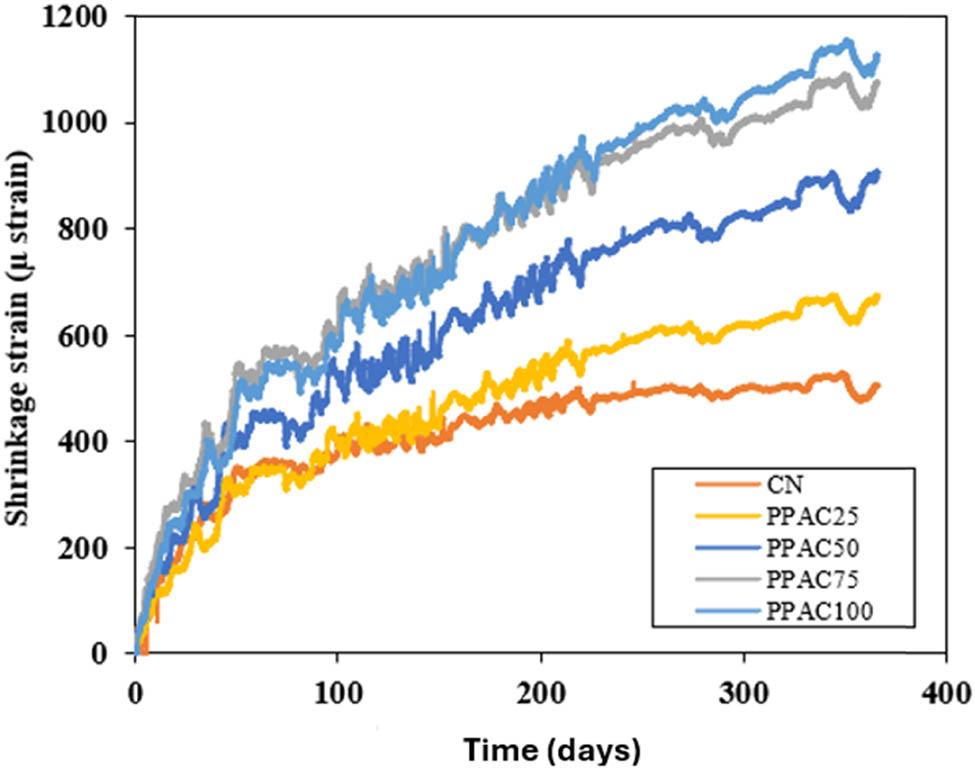
Figure 7
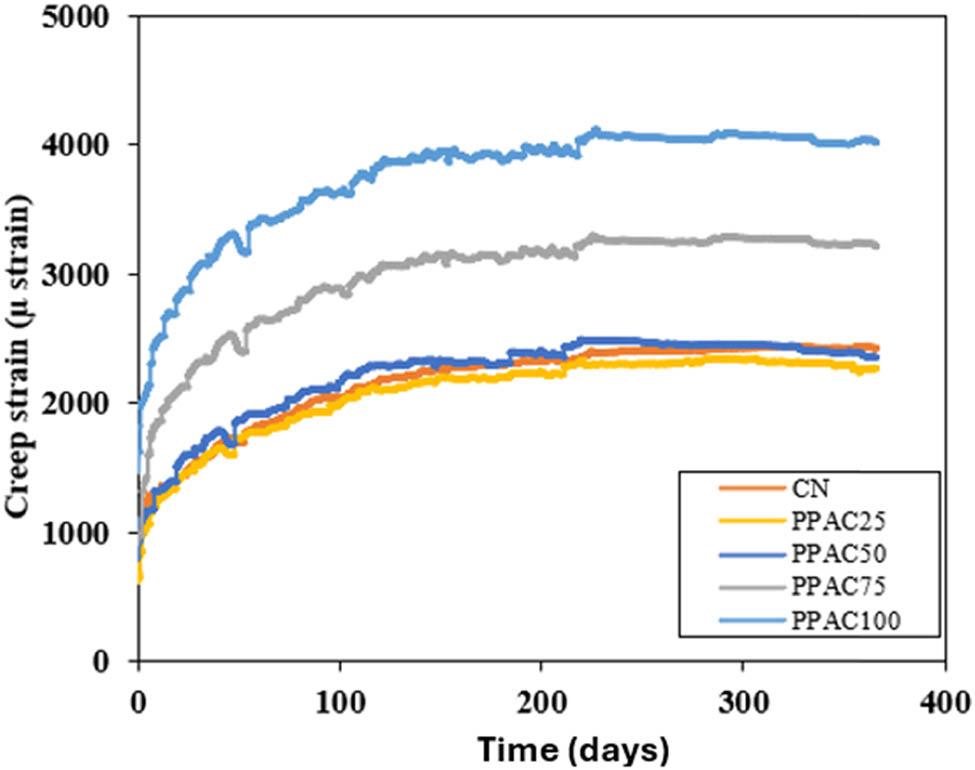
Figure 8
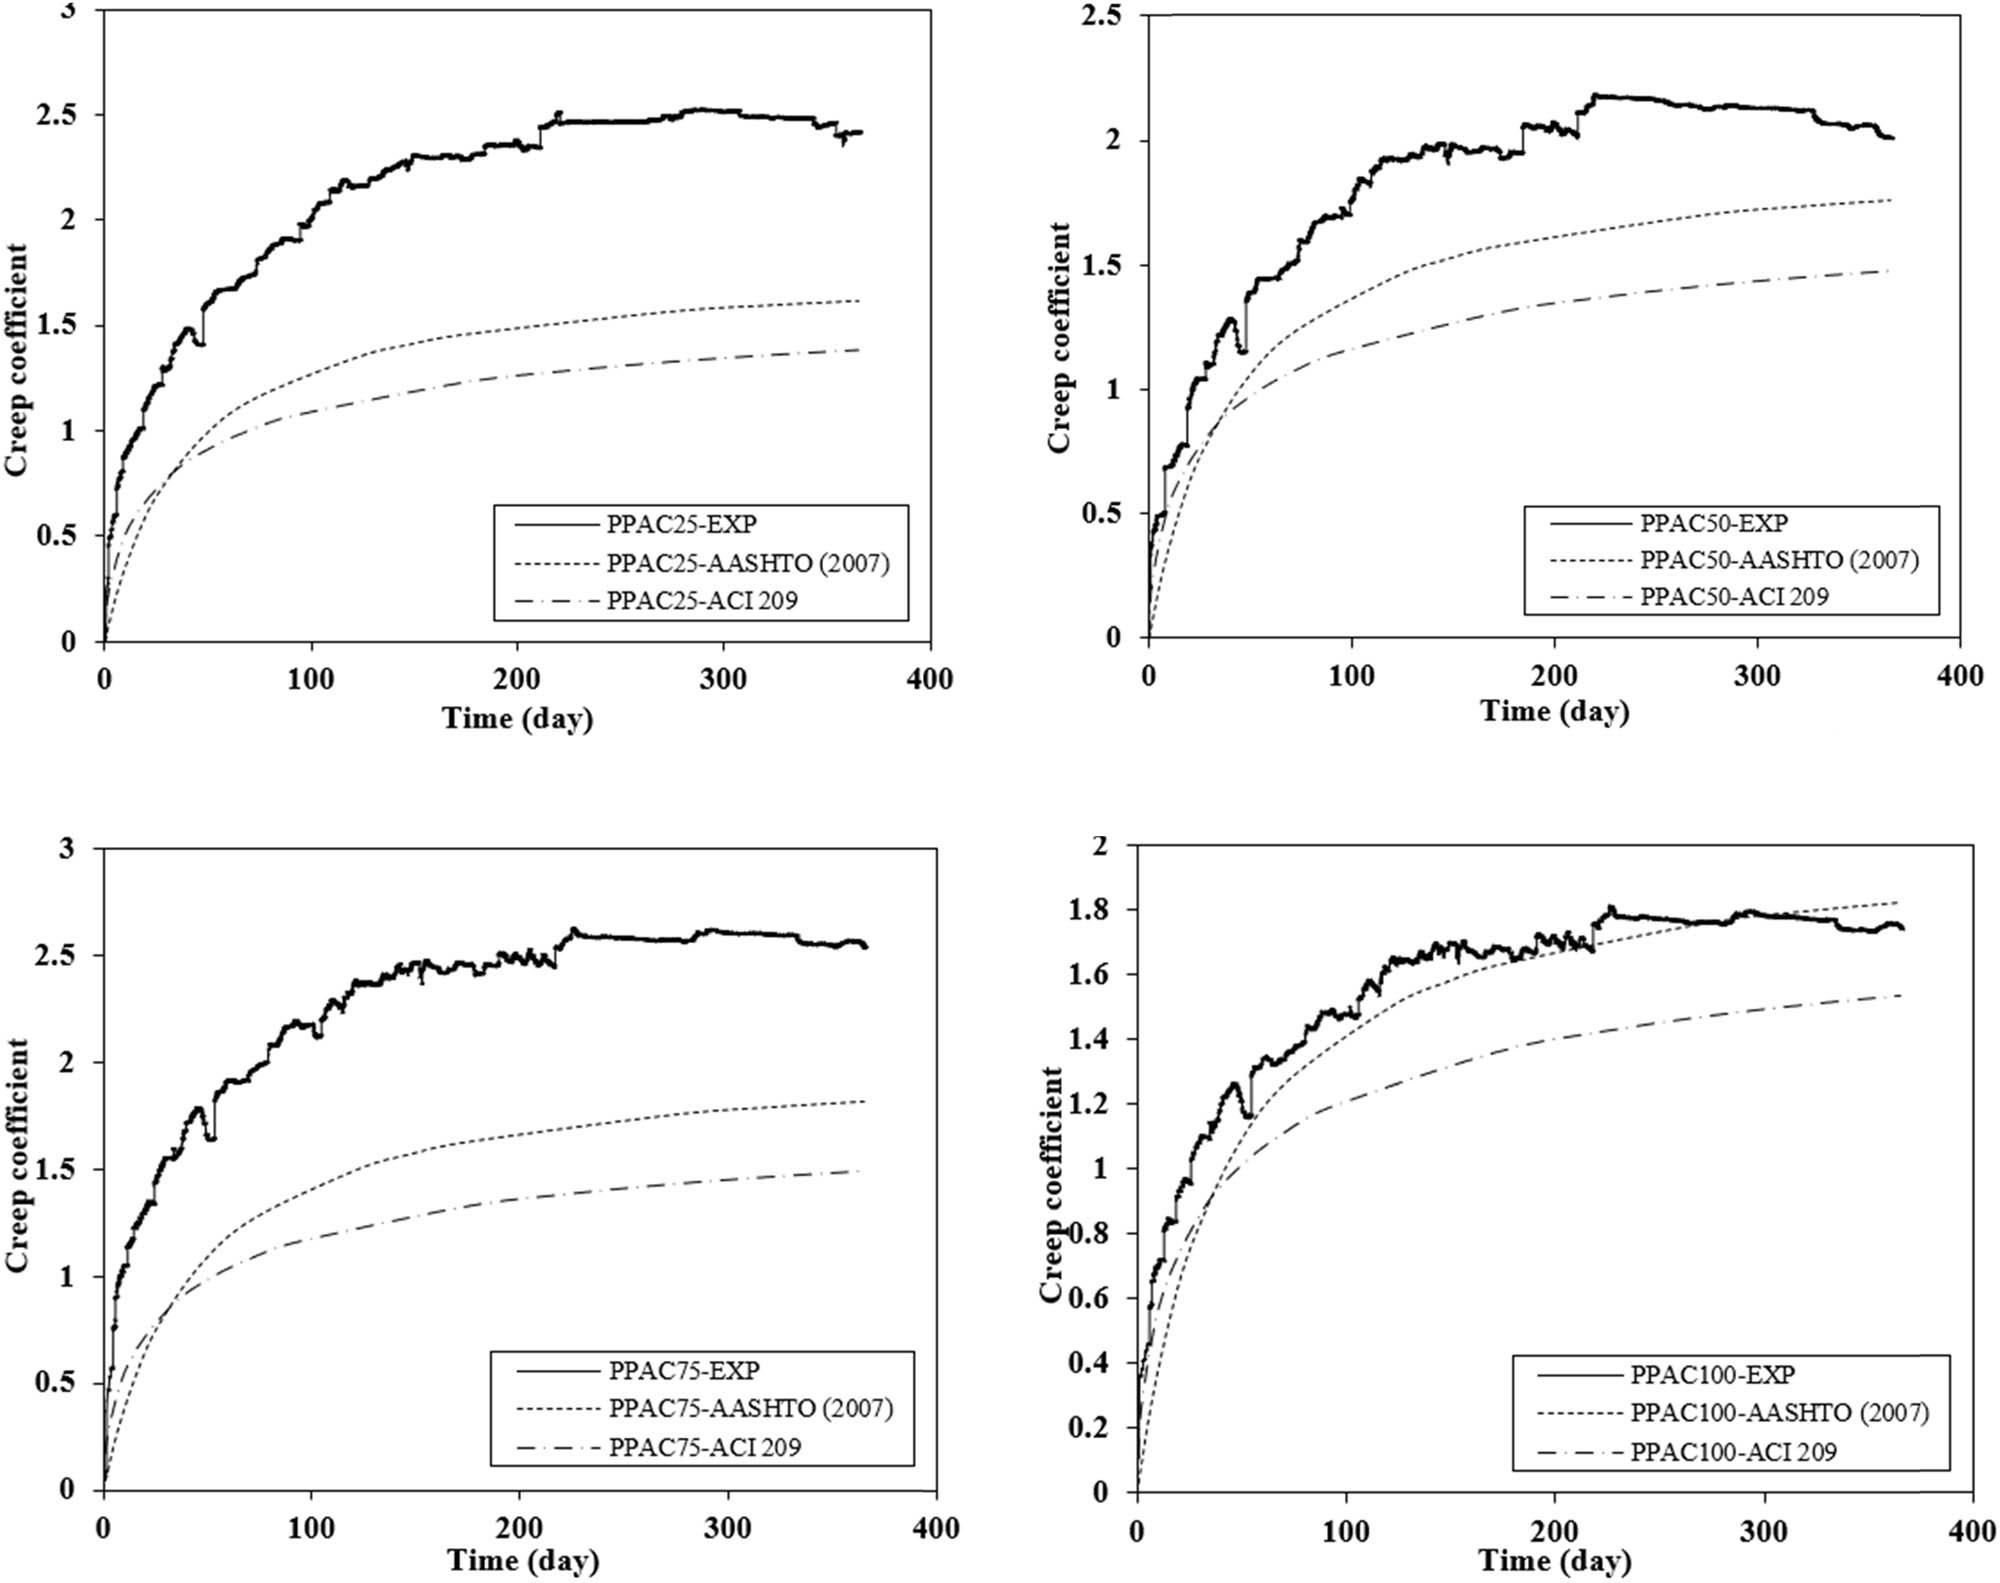
Figure 9
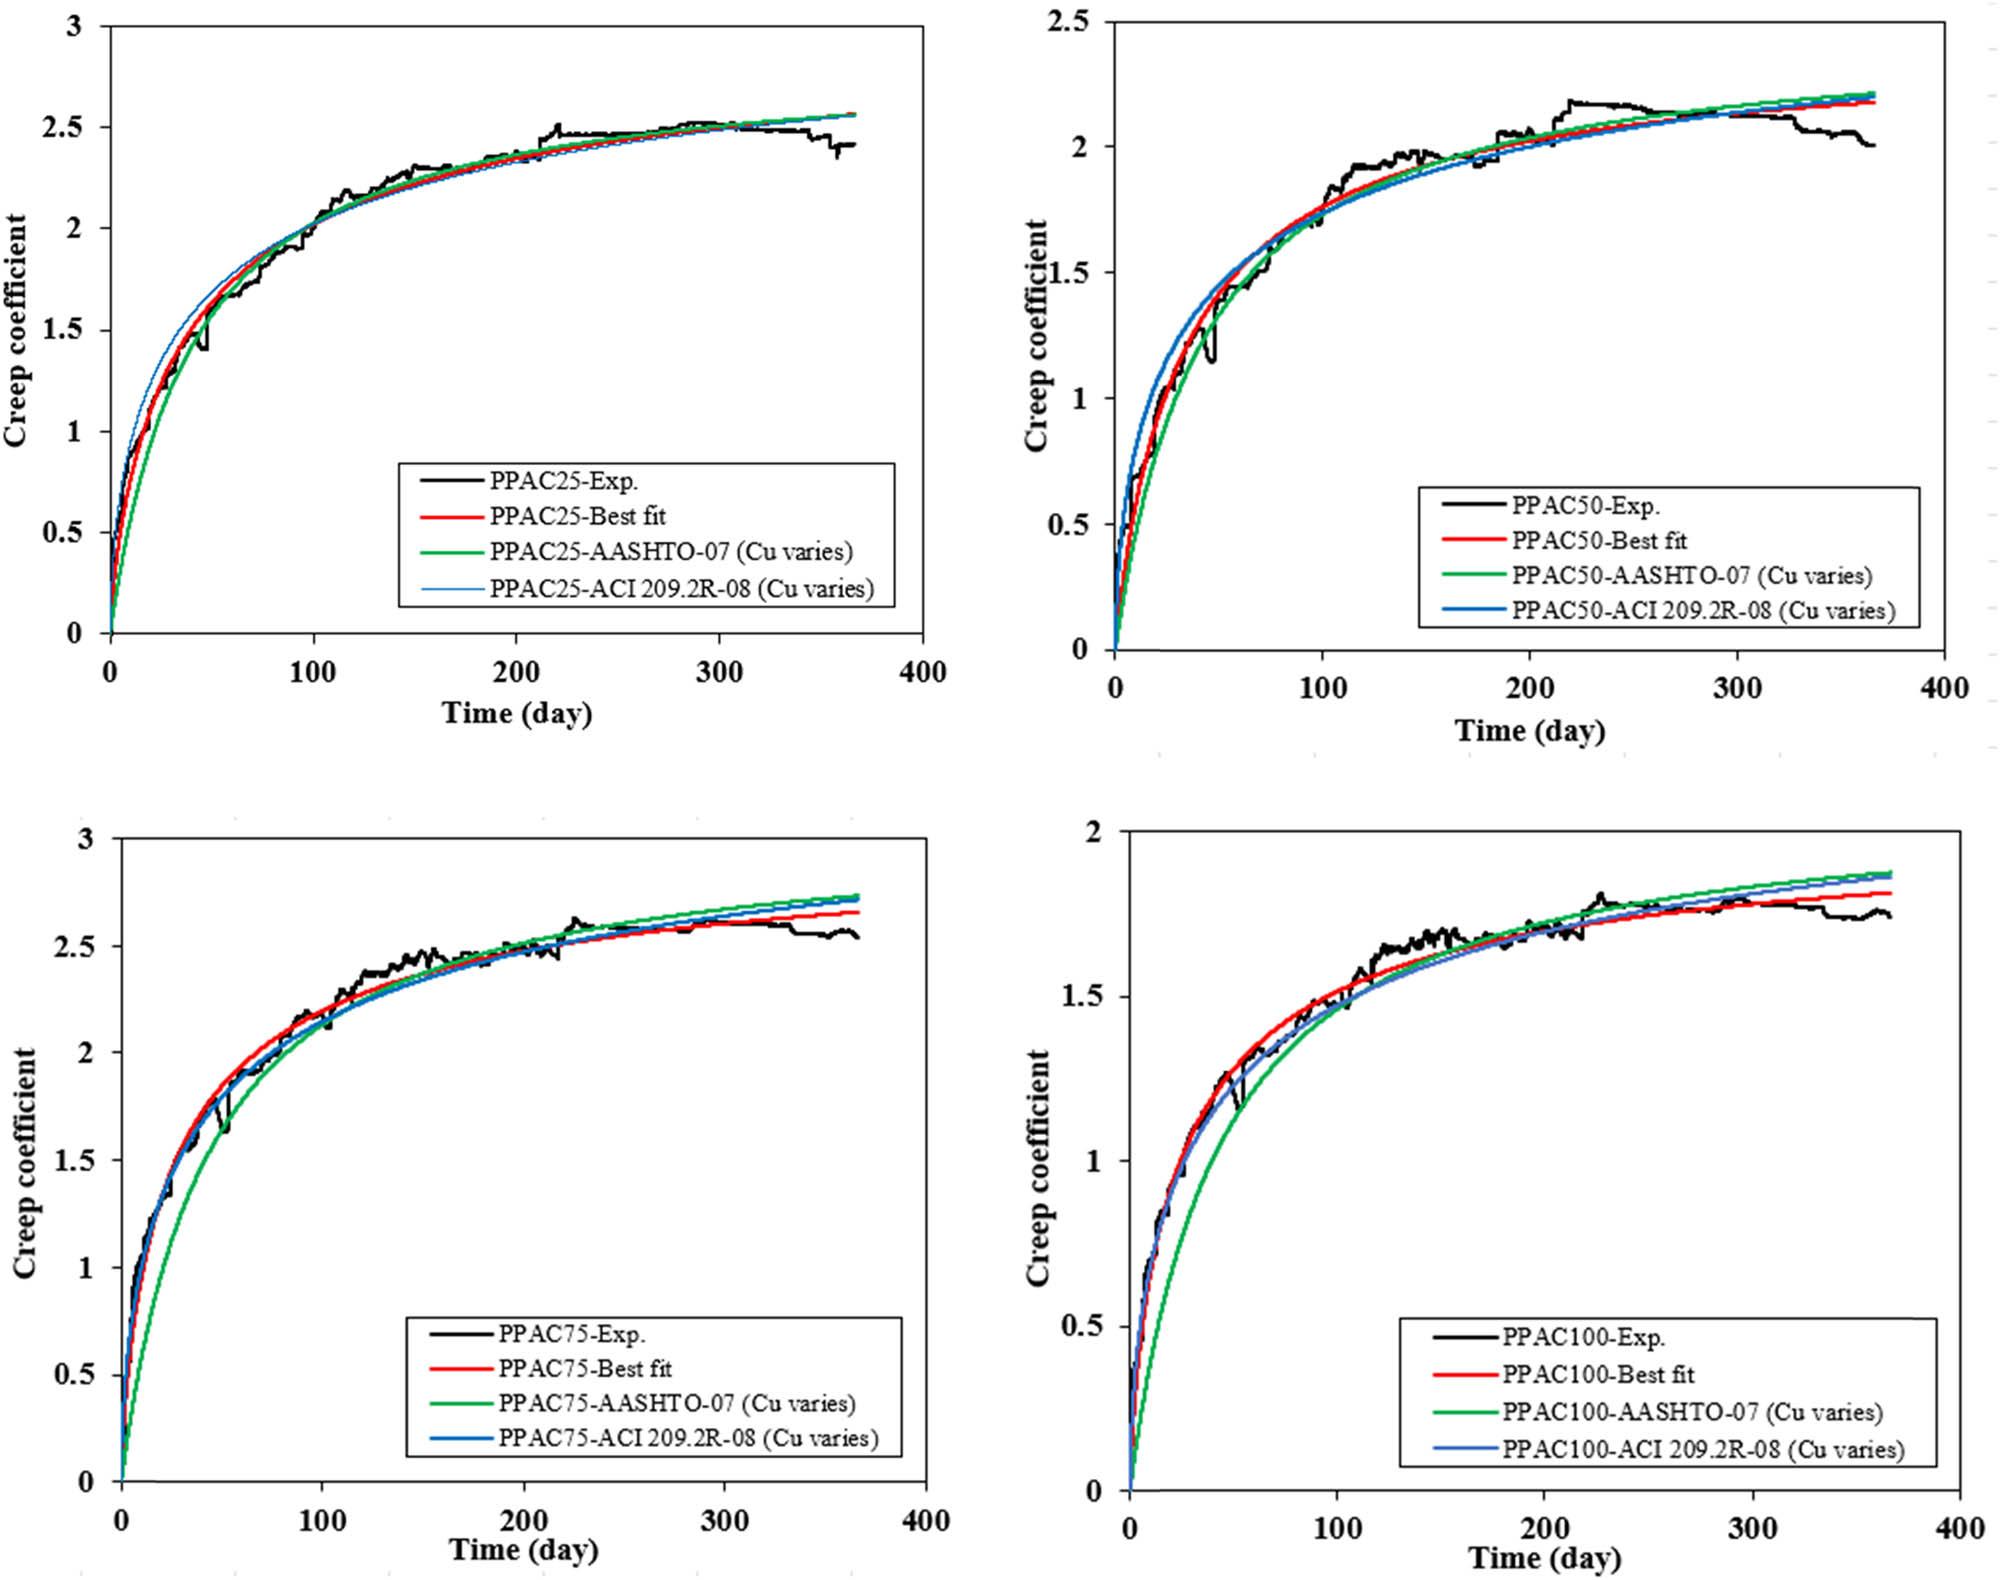
Figure 10
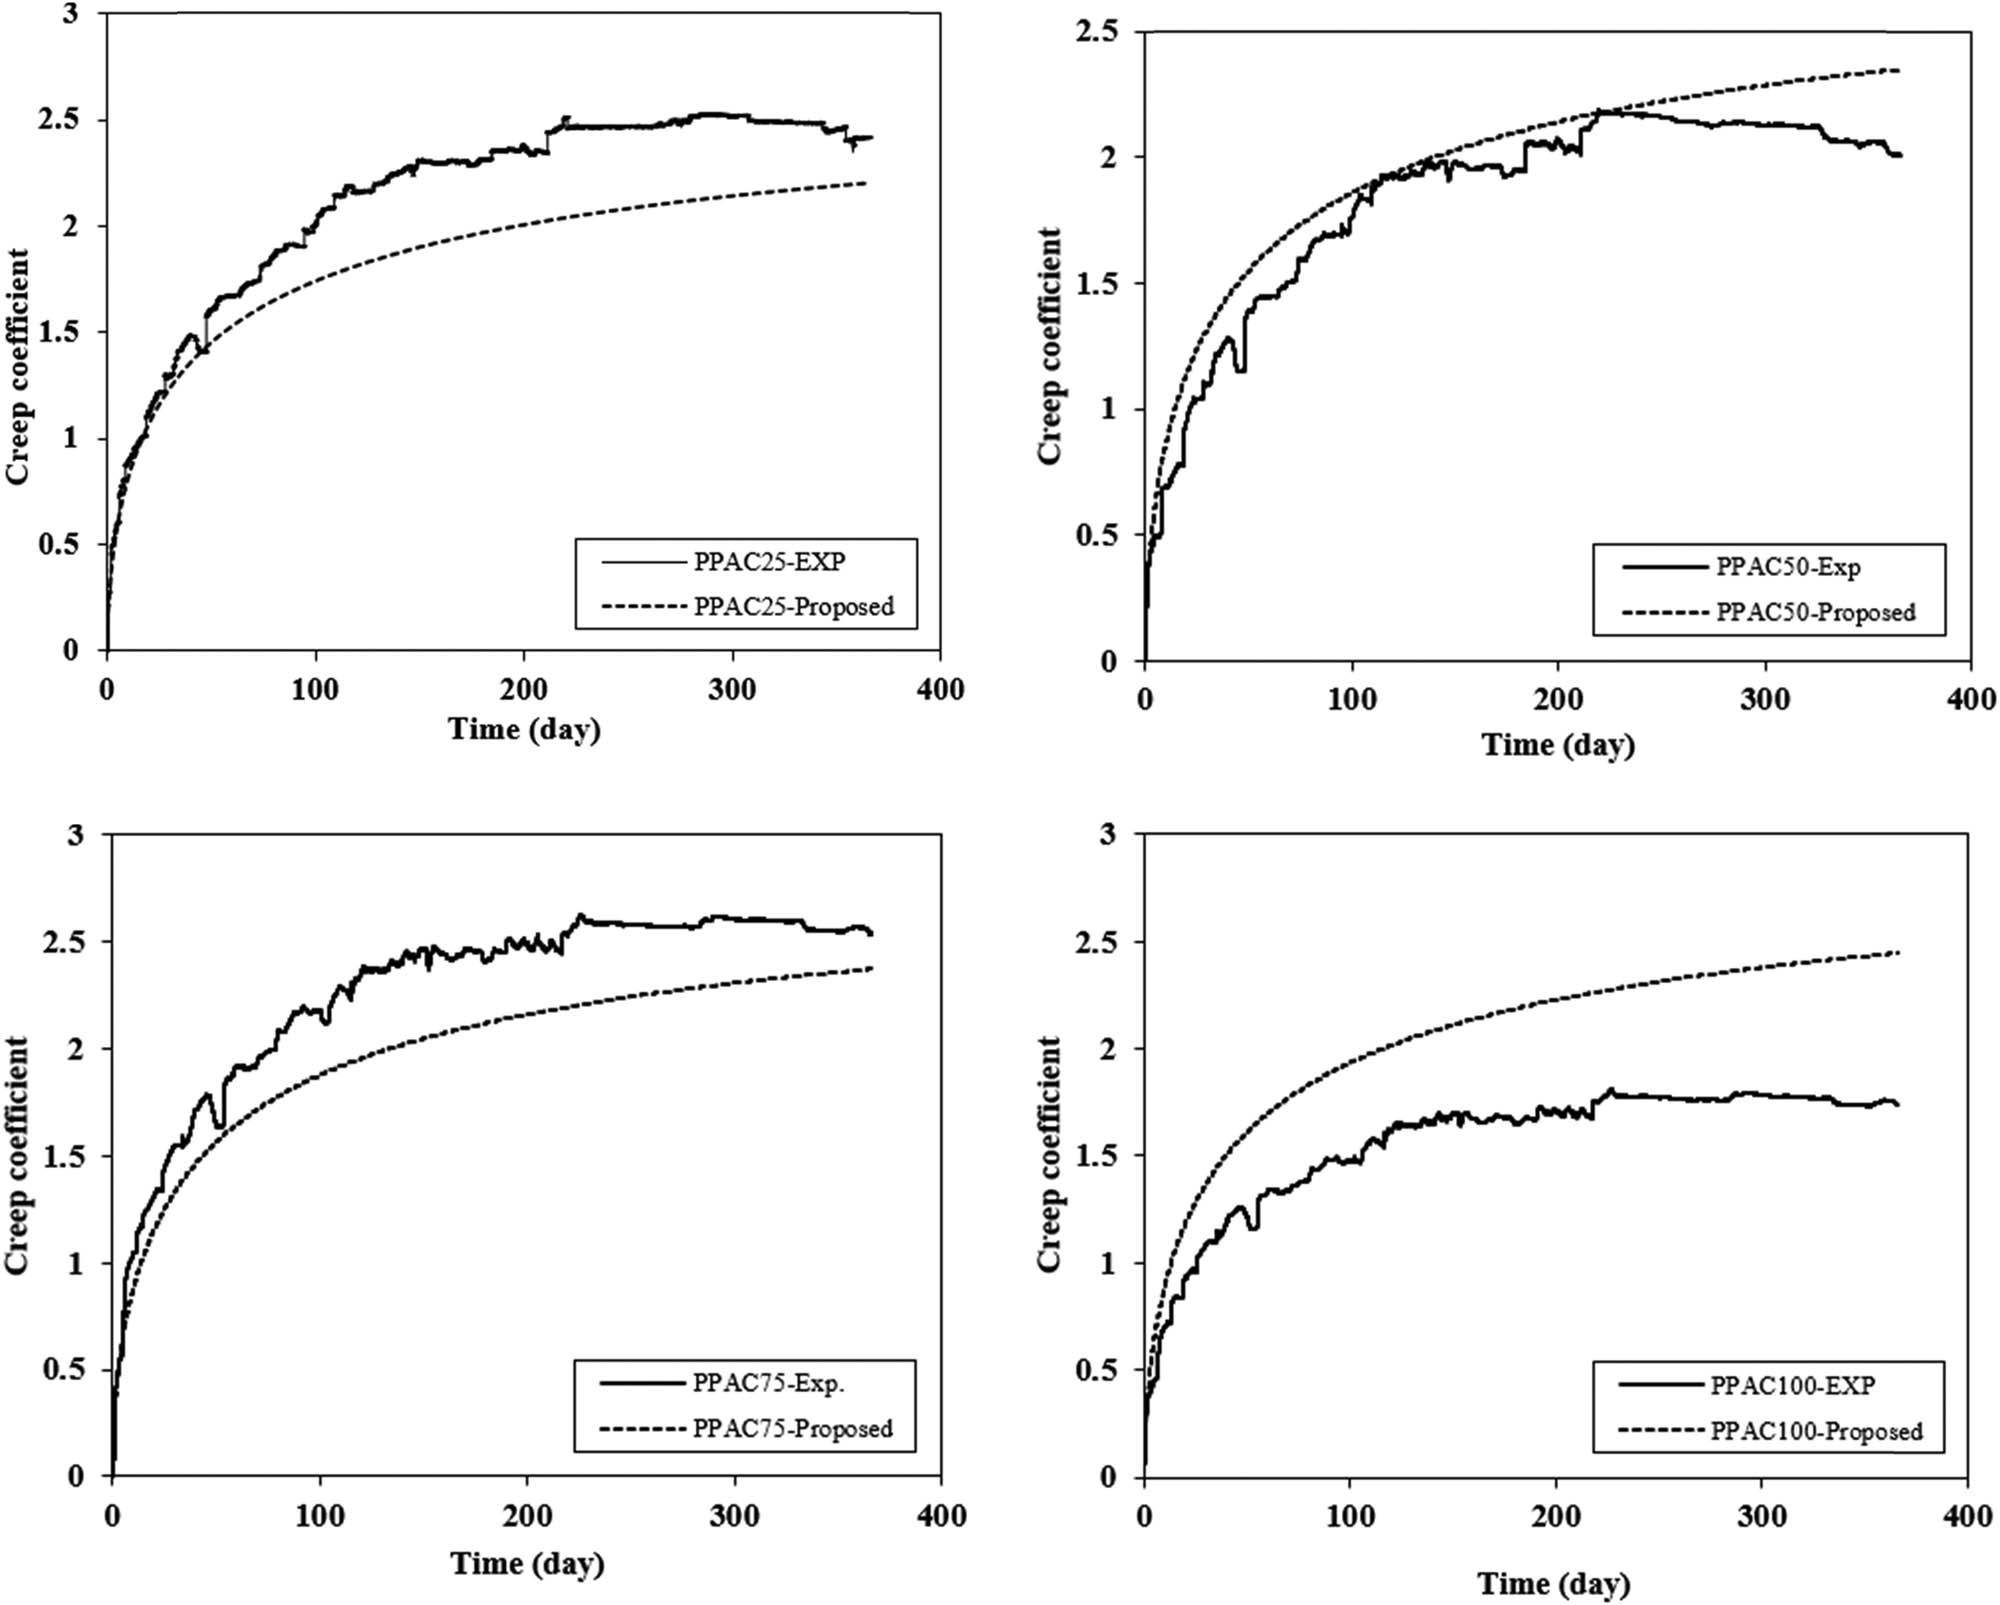
Figure 11
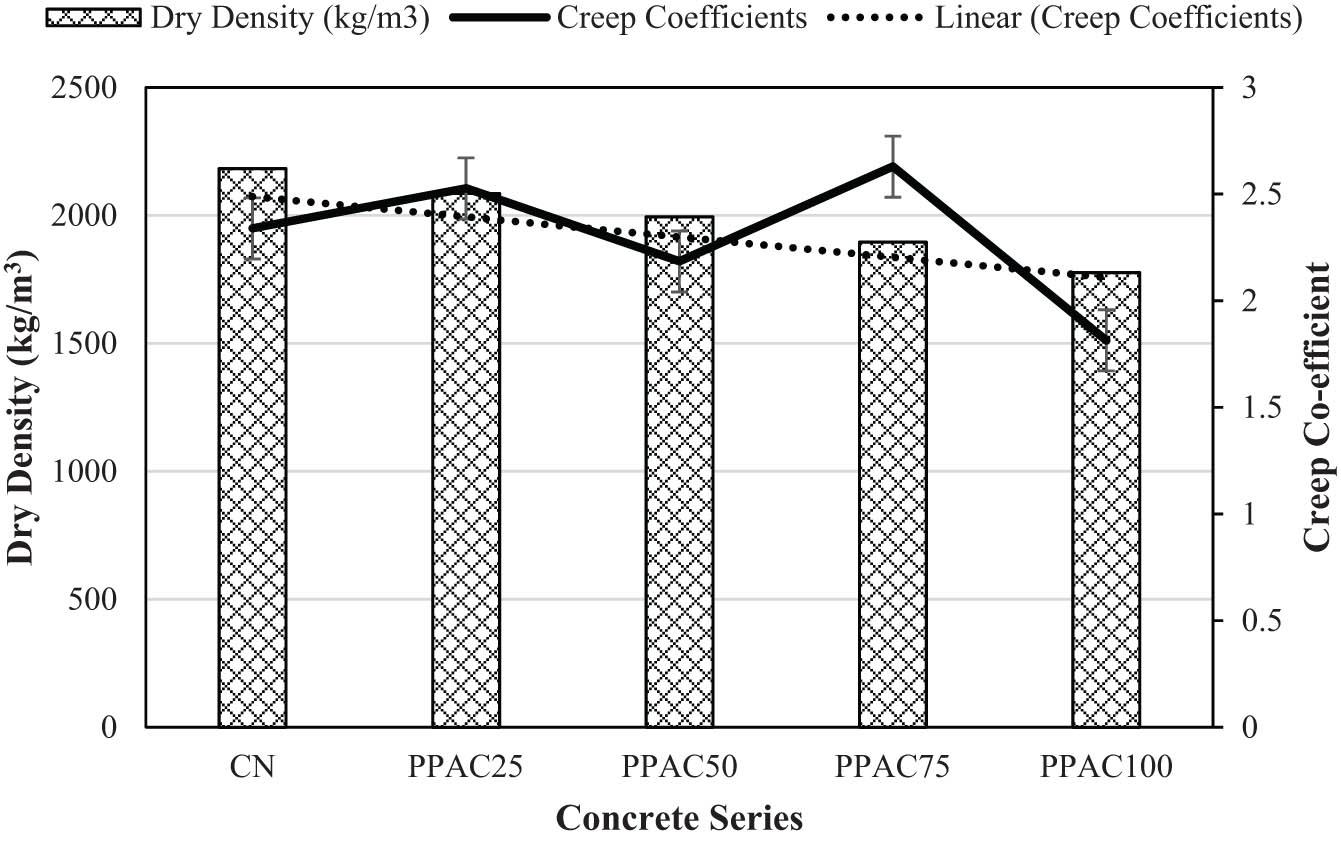
Figure 12
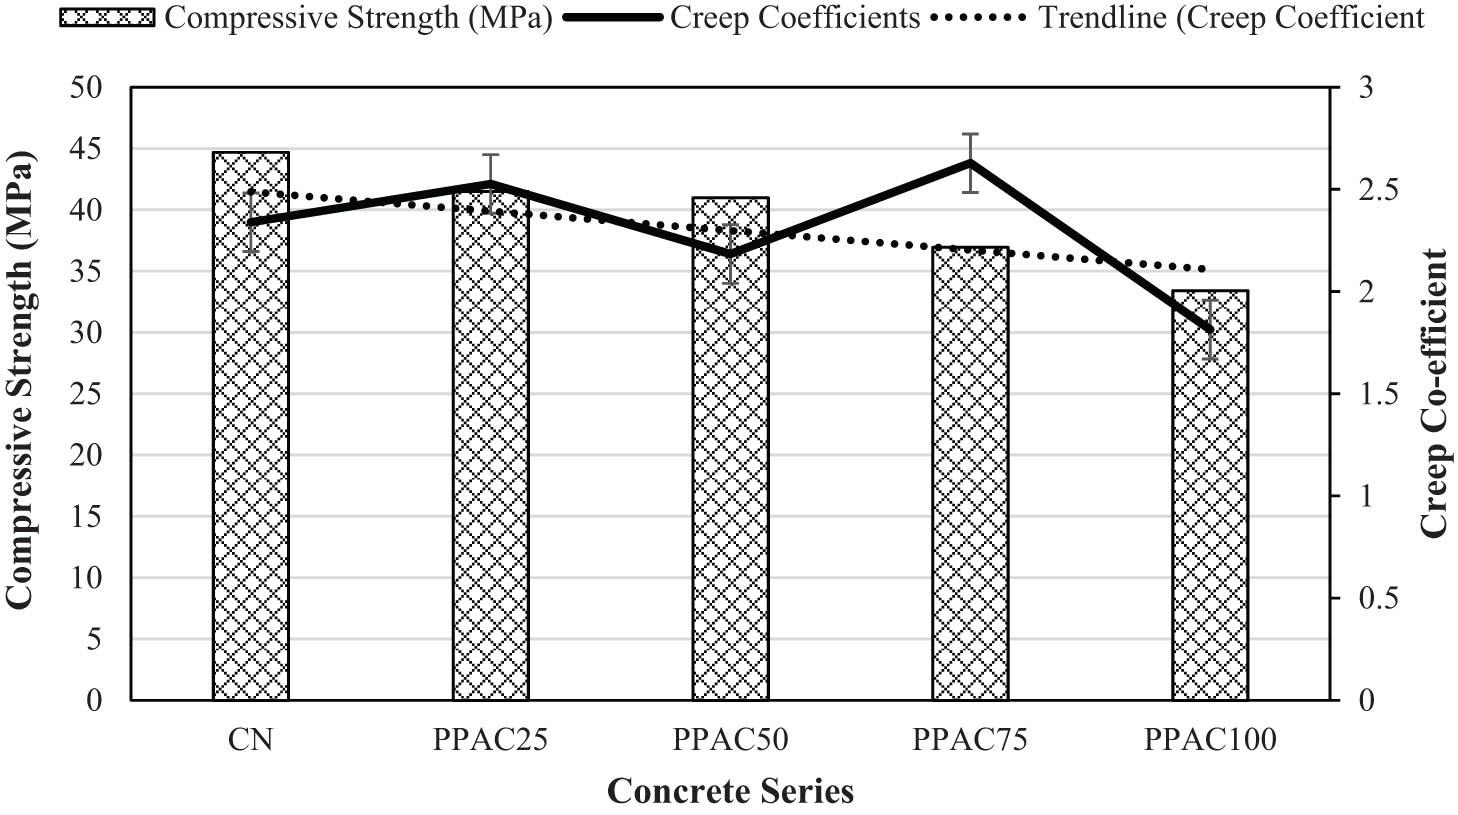
Figure 13
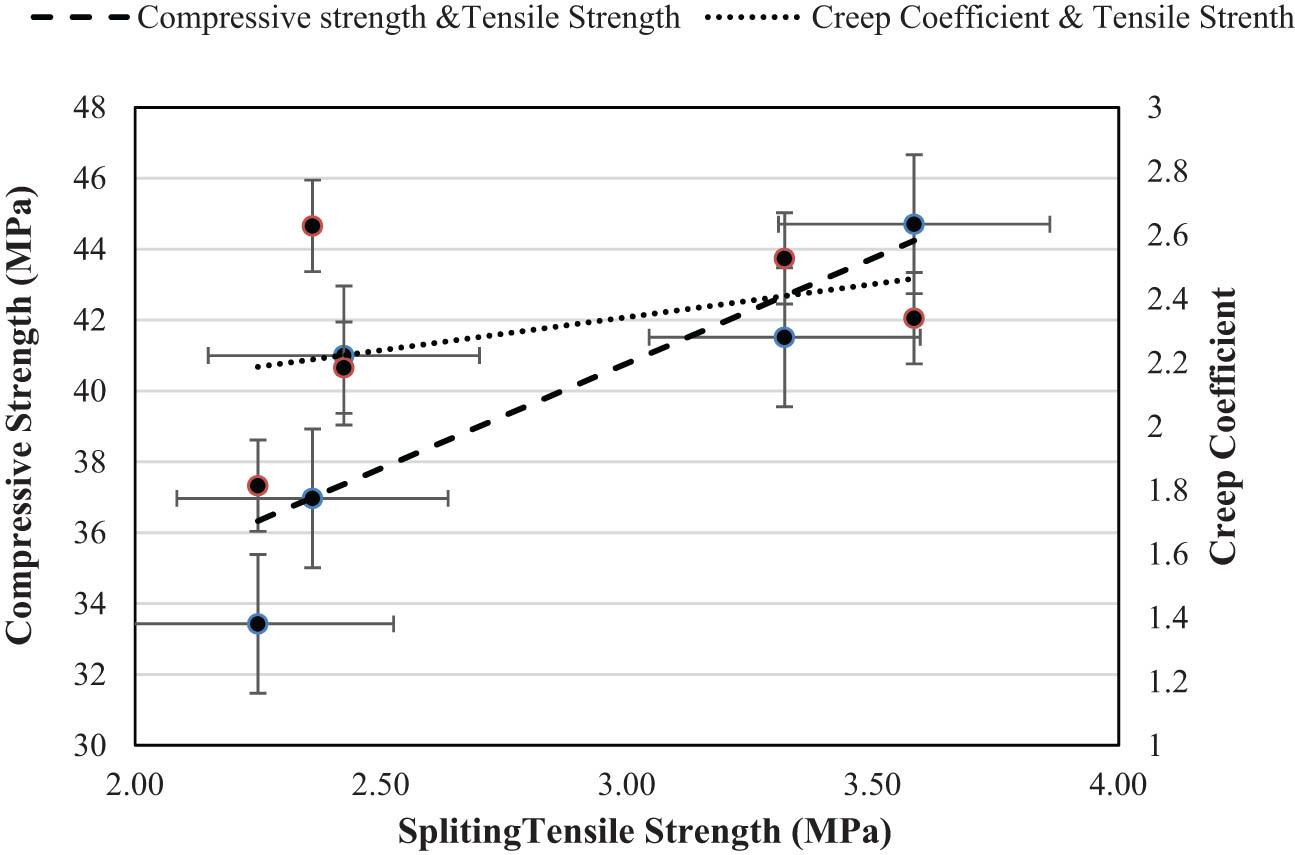
Figure 14
Parameters of the creep coefficient in different models_
| Type of model | |
|---|---|
| AASHTO LRFD (2007) [39] | ACI 209.2R-08 [40] |
|
|
|
|
|
|
|
|
|
|
|
|
|
|
|
|
|
|
|
|
|
|
| |
|
| |
|
| |
Coefficient of correlation of the proposed model for the creep coefficient of PPAC mixes_
| Concrete type | Coefficient of correlation (equation (2)) |
|---|---|
| PPAC25 | 0.98 |
| PPAC50 | 0.96 |
| PPAC75 | 0.97 |
| PPAC100 | 0.97 |
Calculations for calibrating the ACI models for PPAC mixes_
| Model type | Parameter | Concrete type | |||
|---|---|---|---|---|---|
| PPAC25 | PPAC50 | PPAC75 | PPAC100 | ||
| ACI 209.2R-08 |
| 0.844 | 0.844 | 0.844 | 0.844 |
|
| 1.015 | 1.015 | 1.015 | 1.015 | |
|
| 1.158 | 1.158 | 1.158 | 1.158 | |
|
| 1.189 | 1.268 | 1.282 | 1.321 | |
|
| 0.88 | 0.88 | 0.88 | 0.88 | |
|
| 0.73 | 0.73 | 0.73 | 0.73 | |
|
| 0.759 | 0.810 | 0.819 | 0.844 | |
|
| 3.30 | 2.83 | 3.50 | 2.40 | |
|
| 4.35 | 3.49 | 4.27 | 2.84 | |
Mix proportions for concrete mixes used in the current study_
| Concrete series | W/C | Total water | Free water | Cement | Fine aggregate | Coarse aggregate | |
|---|---|---|---|---|---|---|---|
| PPA | CNA | ||||||
| kg/m3 | |||||||
| CN | 0.50 | 240.3 | 225 | 450 | 880 | — | 688 |
| PPAC25 | 239 | 847 | 141 | 516 | |||
| PPAC50 | 237.6 | 815 | 282 | 344 | |||
| PPAC75 | 236.2 | 782 | 423 | 172 | |||
| PPAC100 | 234.8 | 750 | 565 | — | |||
Major mechanical properties for all the concrete series
| Sample | Dry density (kg/m3) | Compressive strength (MPa) | Tensile strength (MPa) | Flexural strength (MPa) | Modulus of elasticity (GPa) | Poisson ratio | Abrasion-weight loss (g) |
|---|---|---|---|---|---|---|---|
| CN | 2,183 | 41.8 | 3.58 | 5.42 | 27.82 | 0.25 | 0.40 |
| PPAC25 | 2,086 | 35.3 | 3.32 | 5.24 | 20.58 | 0.28 | 0.60 |
| PPAC50 | 1,995 | 31.7 | 2.42 | 5.04 | 15.06 | 0.38 | 0.61 |
| PPAC75 | 1,896 | 30.4 | 2.36 | 4.47 | 10.66 | 0.39 | 0.63 |
| PPAC100 | 1,777 | 30.2 | 2.25 | 3.99 | 10.14 | 0.39 | 0.66 |
Regression analysis results of the PPAC mixes_
| Model type | Parameter | Concrete type | |||
|---|---|---|---|---|---|
| PPAC25 | PPAC50 | PPAC75 | PPAC100 | ||
| Best fit | B | 17.72 | 26.45 | 12.71 | 12.46 |
| D | 0.77 | 0.92 | 0.76 | 0.77 | |
| C u | 3.04 | 2.42 | 3.03 | 2.05 | |
| R 2 | 0.98 | 0.96 | 0.98 | 0.98 | |
| AASHTO (2007) | B | 40.52 | 42.60 | 43.36 | 43.47 |
| D | 1 | ||||
| C u | 2.84 | 2.47 | 3.06 | 2.09 | |
| R 2 | 0.97 | 0.96 | 0.93 | 0.92 | |
| ACI 209.2R-08 | B | 10 | |||
| D | 0.6 | ||||
| C u | 3.30 | 2.83 | 3.50 | 2.40 | |
| R 2 | 0.97 | 0.94 | 0.96 | 0.96 | |
Aggregate properties used in the current study_
| Test | Experimental values | Standard used | |
|---|---|---|---|
| CNA | PPA | ||
| Fineness modulus | 5.83 | 5.67 | ASTM C136/C136M-14 [26] |
| Unit weight (kg/m3) | 1,554 | 1,132 | ASTM C29/C29M-16 [27] |
| Voids (%) | 37.79 | 37.44 | ASTM C29/C29M-16 [27] |
| Specific gravity | 2.59 | 1.81 | ASTM C127-15 [28] |
| Water absorption (%) | 1.48 | 0.95 | ASTM C127-15 [28] |