
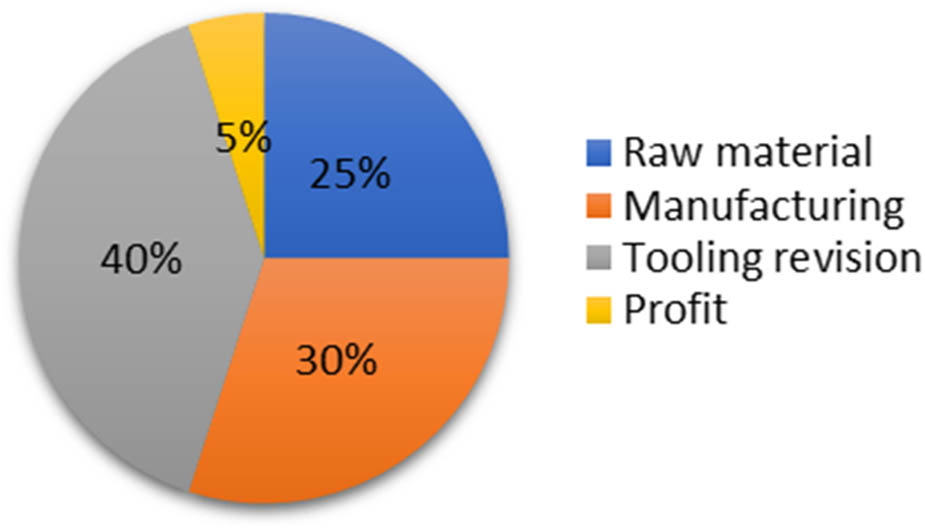
Figure 1
Cost of forging.
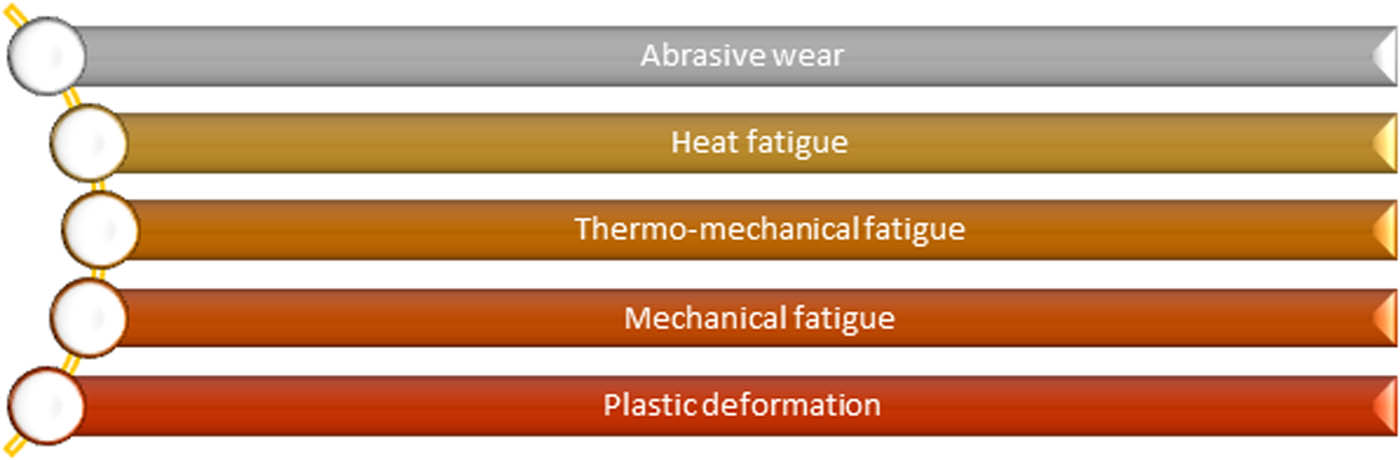
Figure 2
Mechanisms of wear of forging tools. The elaboration is based on Kannappan A.: Wear in Forging Dies – A Review of World Experience. Met. Form. Vol. 36 No. 12 (Dec 1969), s. 335; Vol. 37 No. 1 (Jan 1970), s. 6.
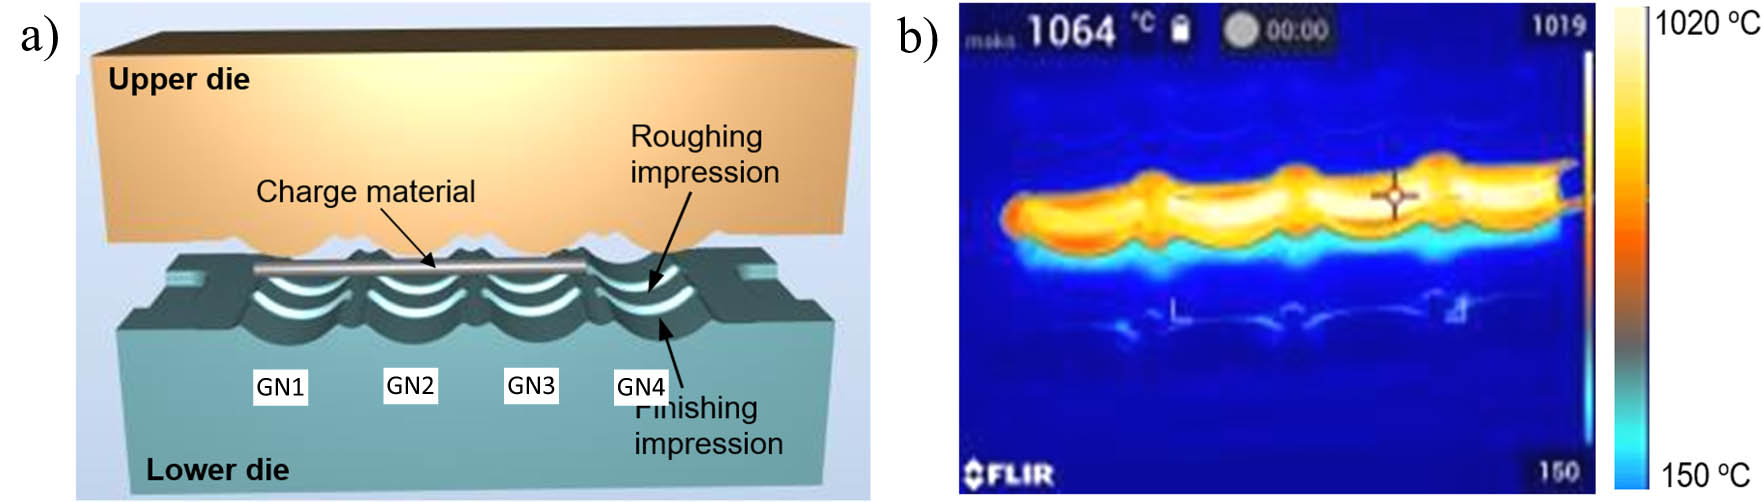
Figure 3
(a) CAD model of forging tools and (b) an example photo from a thermal imaging camera of the technological process.
Table 1
Comparison of the durability of forging tools.
| Tool durability | Tool durability (pcs) | Average (pcs) | ||
|---|---|---|---|---|
| First set of tools | Second set of tools | Third set of tools | ||
| Standard manufacturing process (forging tools without gas nitriding) | 3,380 | 3,200 | 3,150 | 3,243 |
| Forging tools with gas nitriding | 1,200 | 1,070 | 1,370 | 1,213 |
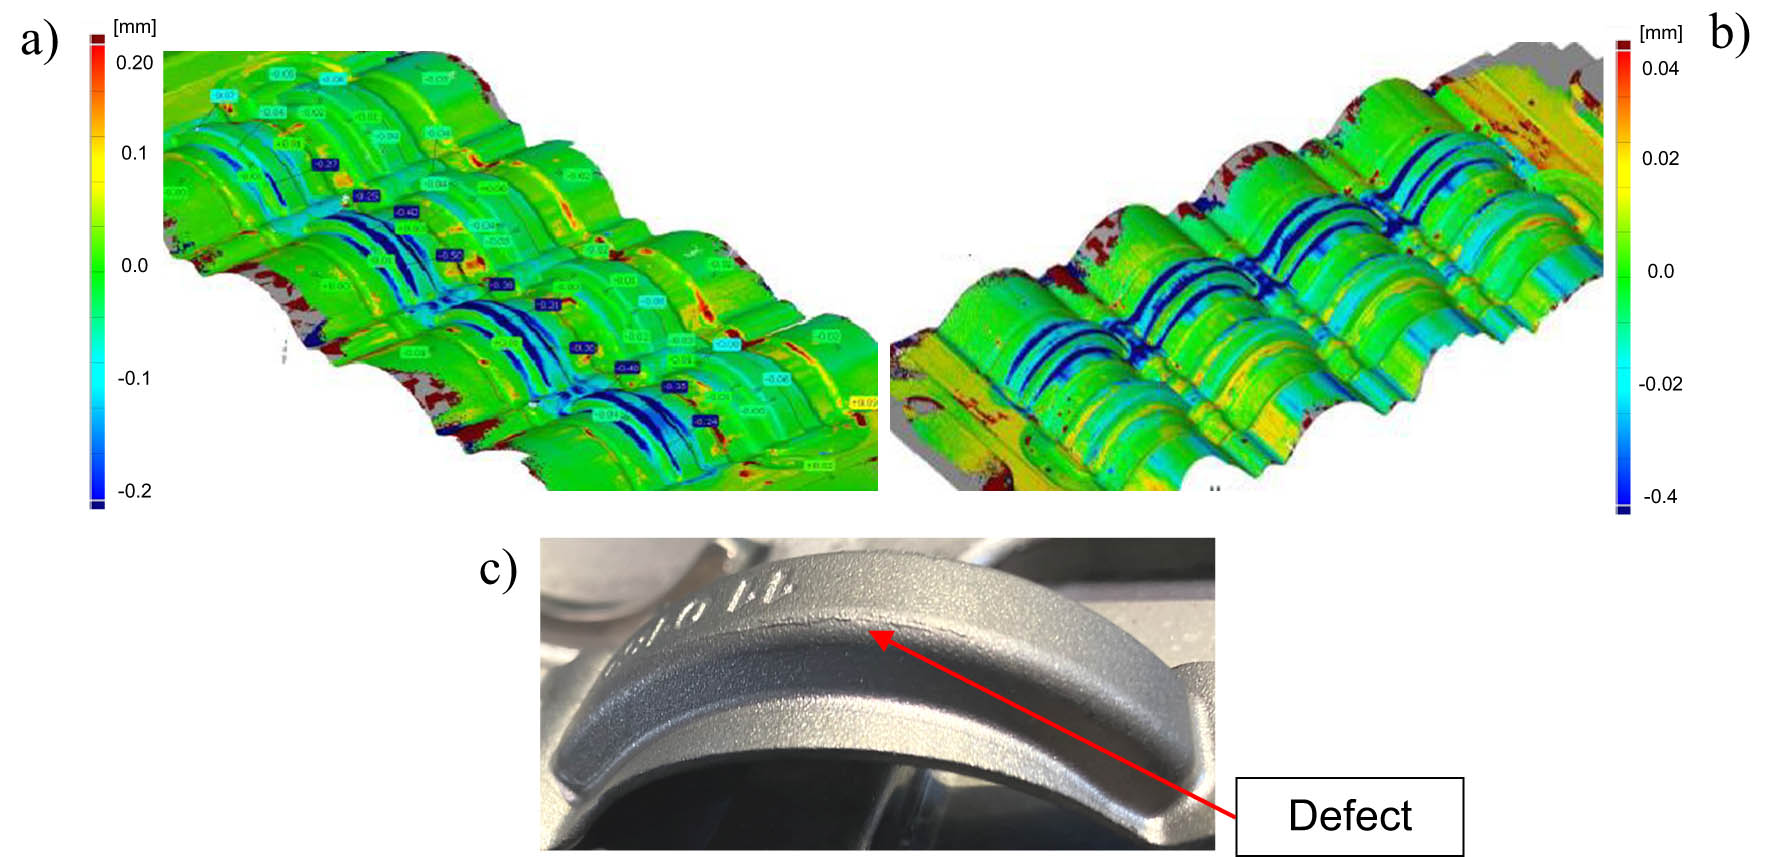
Figure 4
Comparison of forging dies for (a) standard tools after 1,370 pieces, (b) nitriding tools after 1,200 pieces, and (c) an example of faulty forgings in nitriding tools.
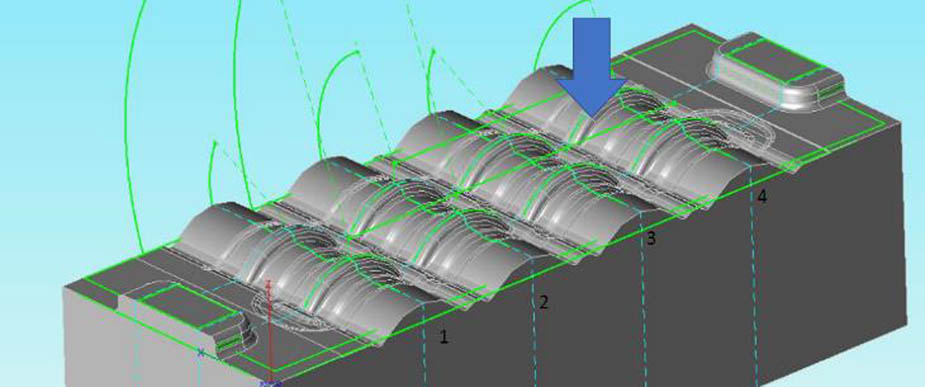
Figure 5
View of the upper forging die along with the results of scanning measurements of the upper forging tools on the Mitutoyo measuring machine (new forging tools).
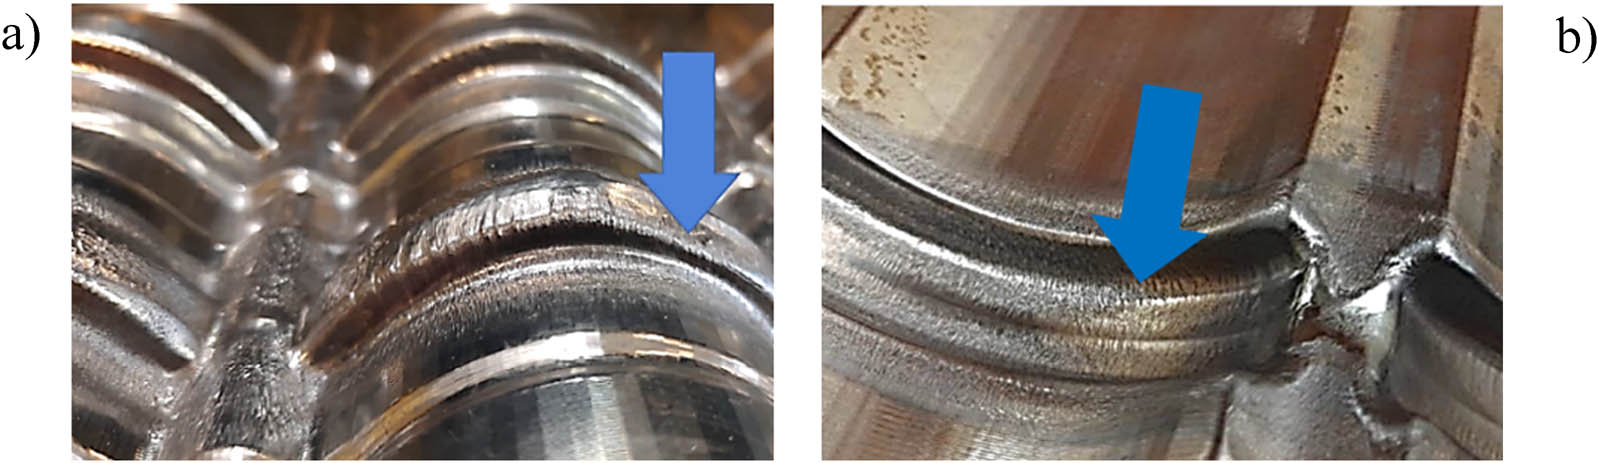
Figure 6
Visual evaluation of forging tools without nitriding after production of 3,380 forgings: (a) upper tool and (b) lower tool.
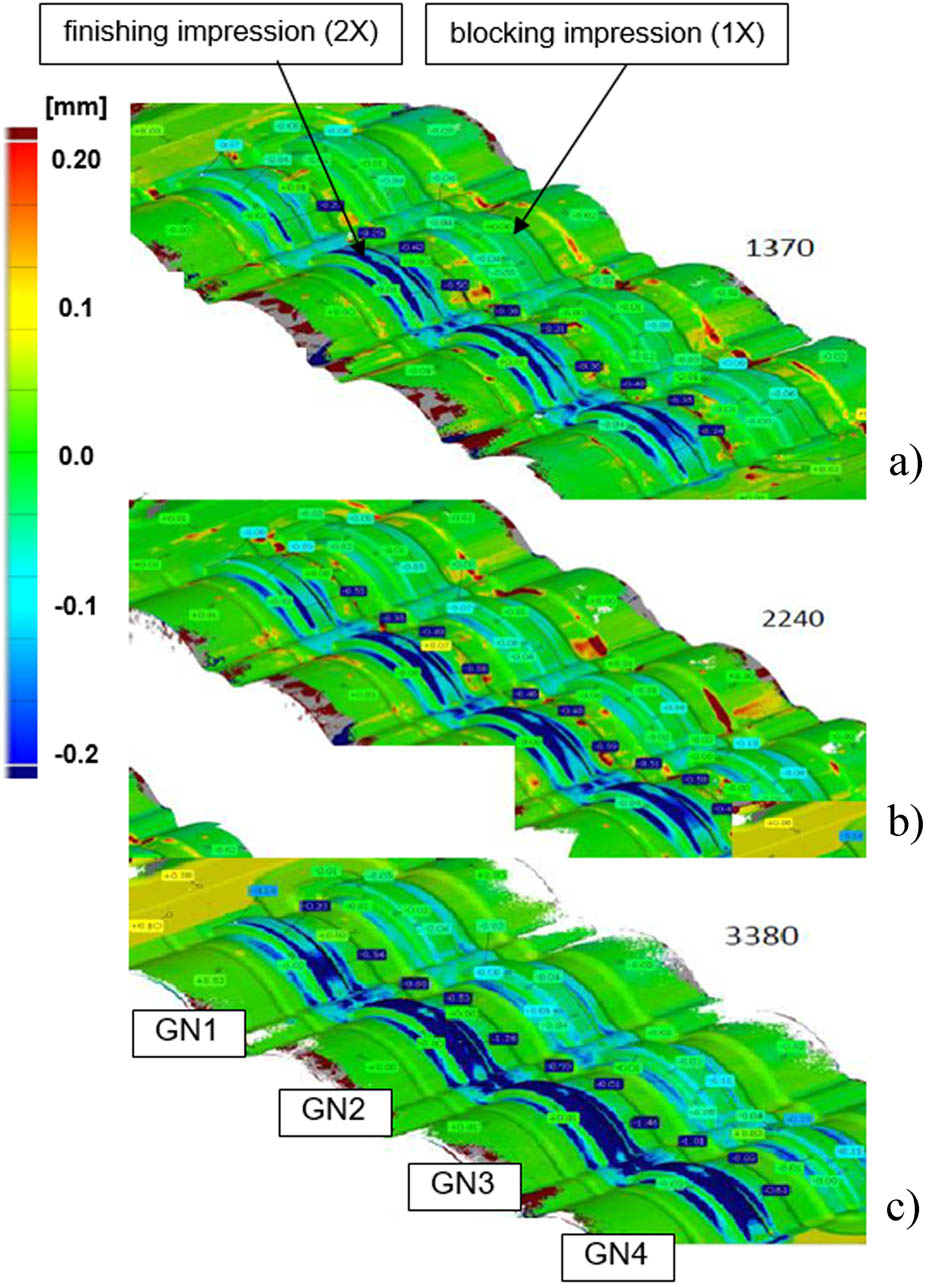
Figure 7
Scanning results of the upper forging tools after production of standard tools without nitriding: (a) 1,370 pcs of forgings, (b) 2,240 pcs of forgings, and (c) 3,380 pcs of forgings.
Table 2
Initial-boundary conditions adopted for numerical calculations of the forging process.
| Input raw material | ∅12 mm × 276 mm |
| Number of strokes | 1× (blocking impression): 12.5 kJ – 1 stroke; 2× (finishing impression): 5.5 kJ – 1 stroke |
| Temp. of the raw material | 1,165°C |
| Cycle time | 11 s divided into: cooling for 6 s + forging in the blocking impression for 2.5 s + forging in the finishing impression for 2.5 s |
| Machine | Hammer, 16 kJ |
| Temp. of tools | 200°C |
| Lubrication | Water with graphite |
| Heat exchange | Average 10 kW/(m2 K) |
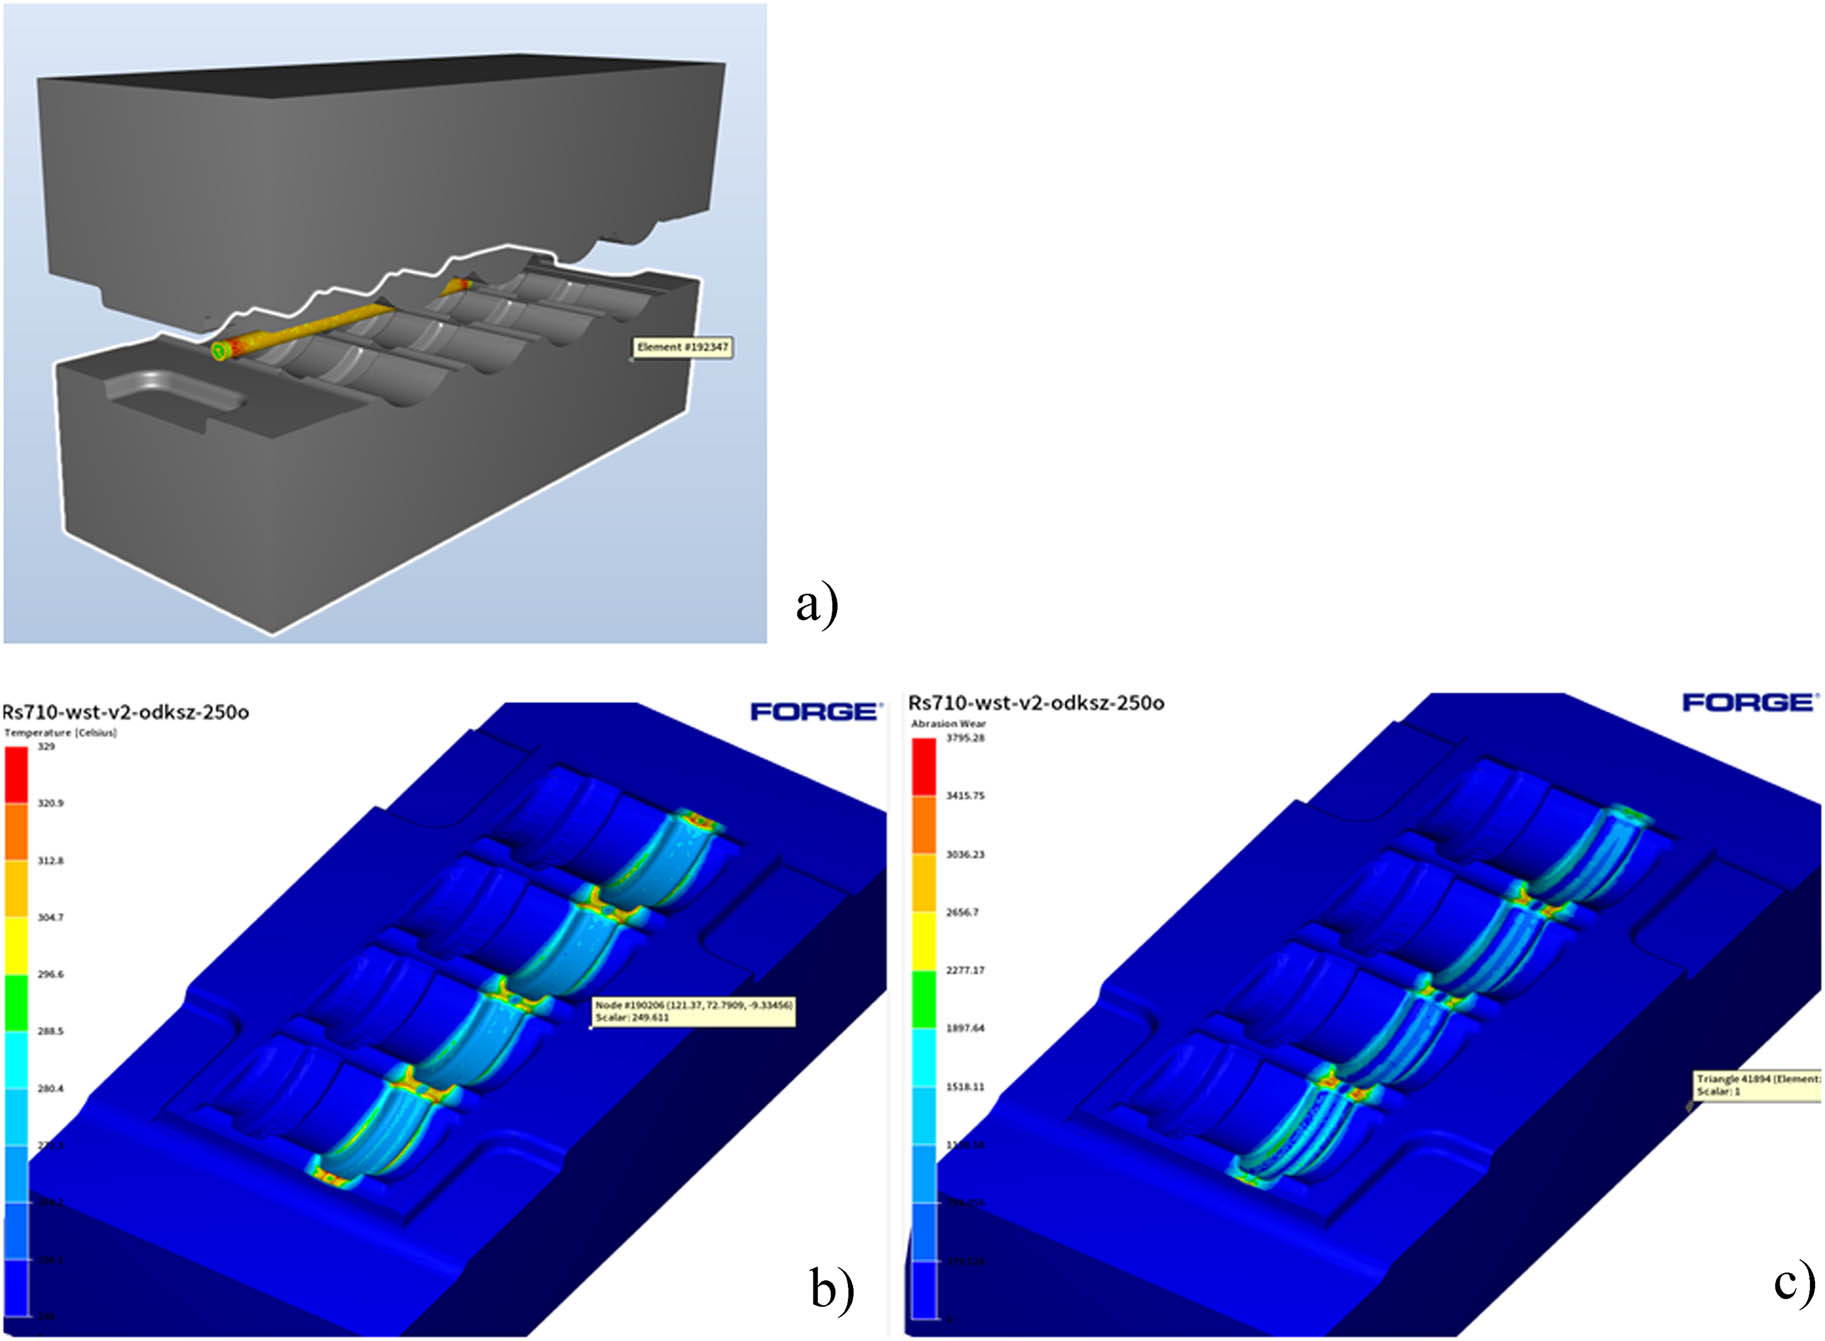
Figure 8
(a) Forging process and feed material settings, (b) temperature field distribution in the lower die in the finishing impression, and (c) abrasion wear in the lower die in the finishing impression.
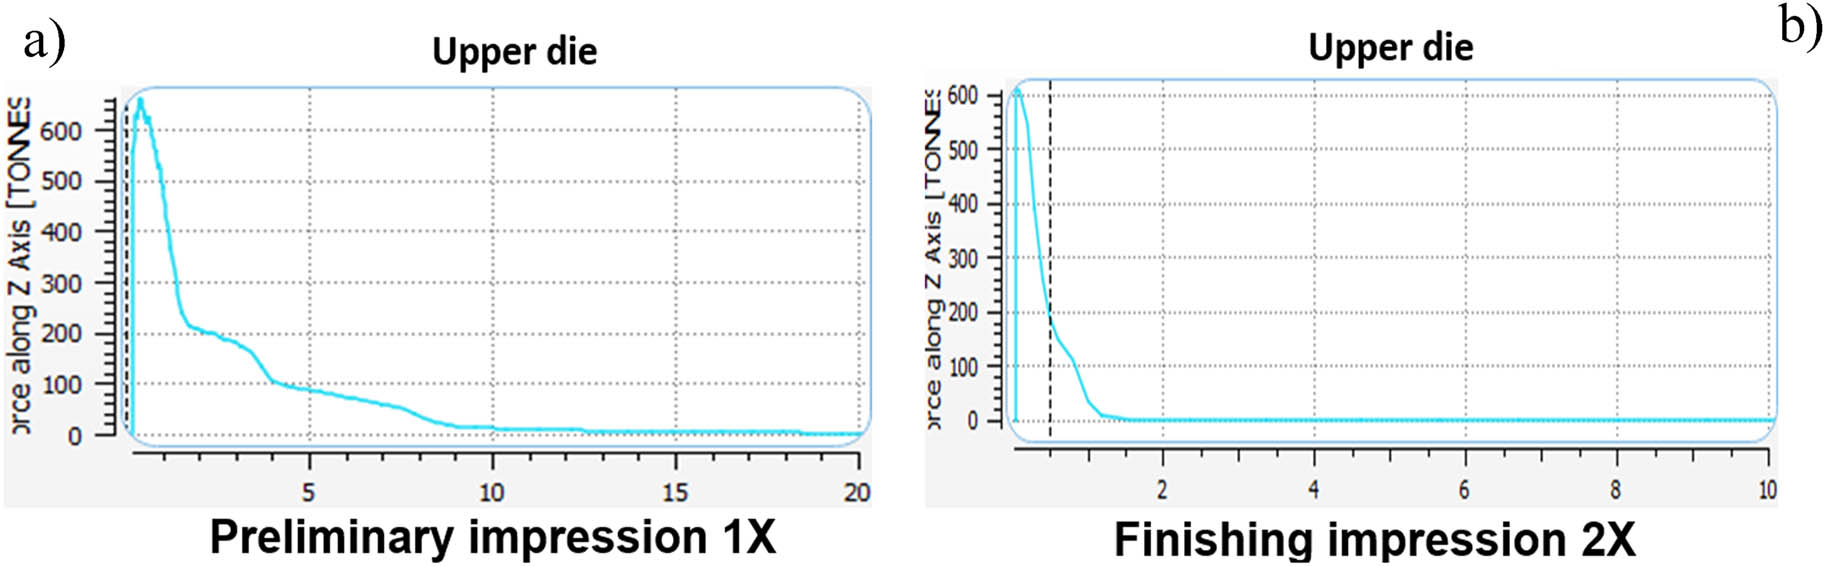
Figure 9
Force in the process of forging for (a) blocking impression and (b) finishing impression.
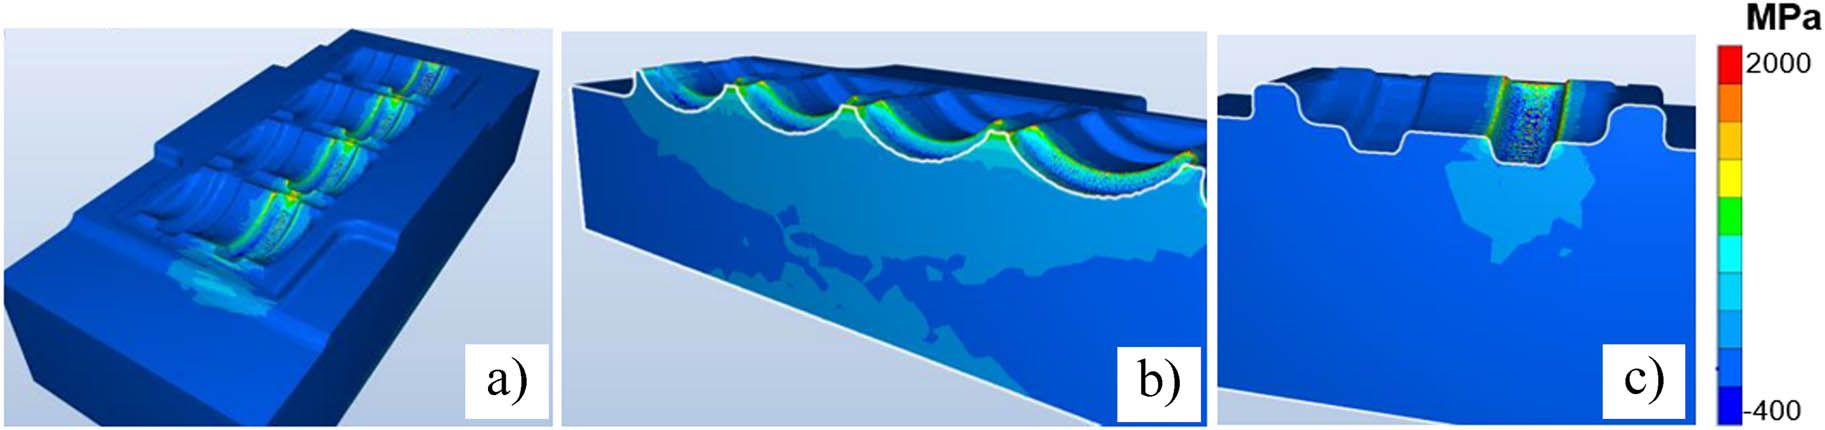
Figure 10
Distribution of hydrostatic pressure acting on the tool: (a) view of the entire lower tool, (b) longitudinal section, and (c) cross-section.
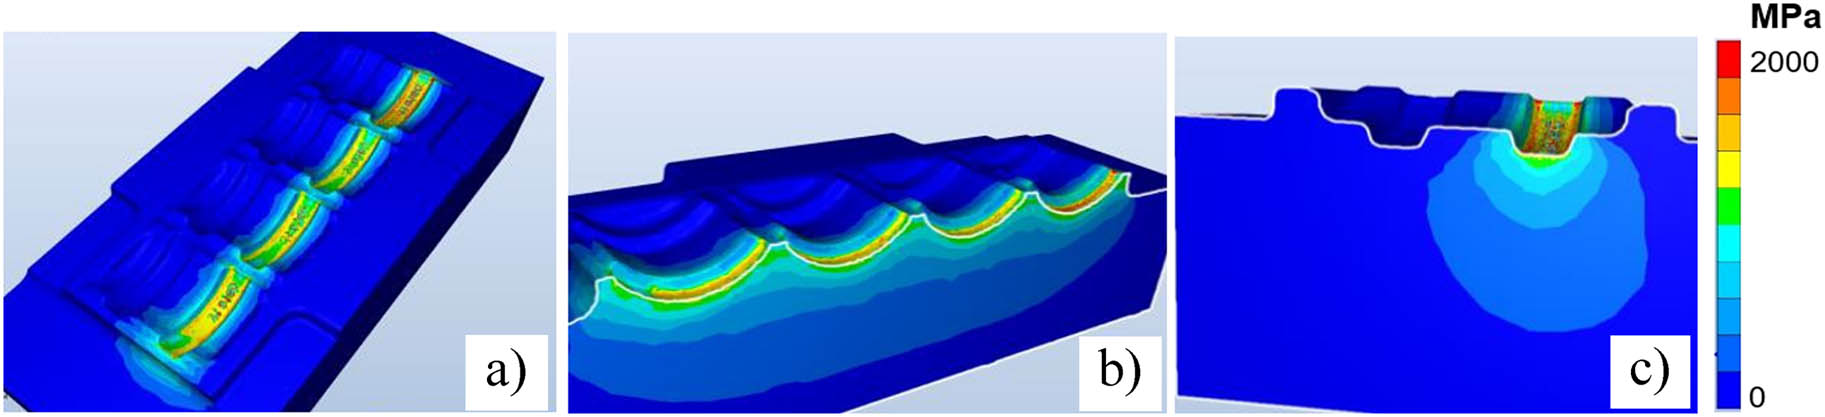
Figure 11
Distribution of reduced HMH stresses: (a) results for the whole tool, (b) longitudinal section, and (c) cross section.
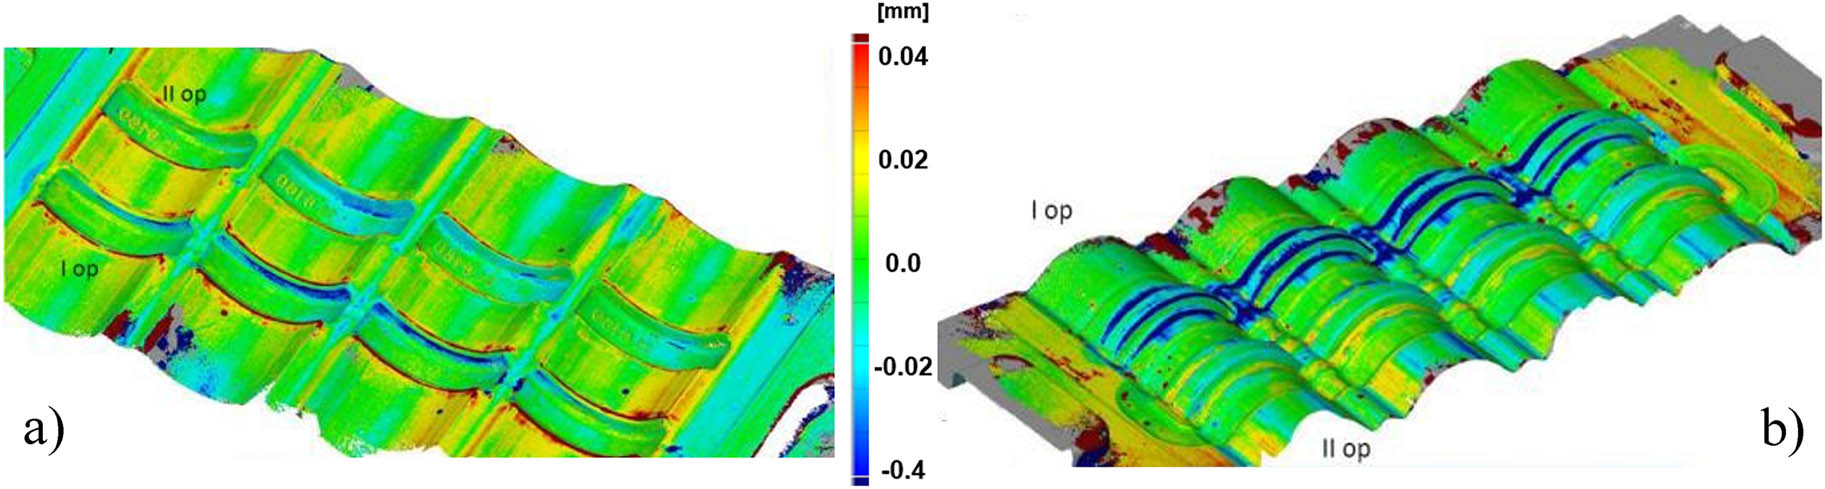
Figure 12
Geometric measurement of tools after being withdrawn from production: (a) lower die and (b) upper die.
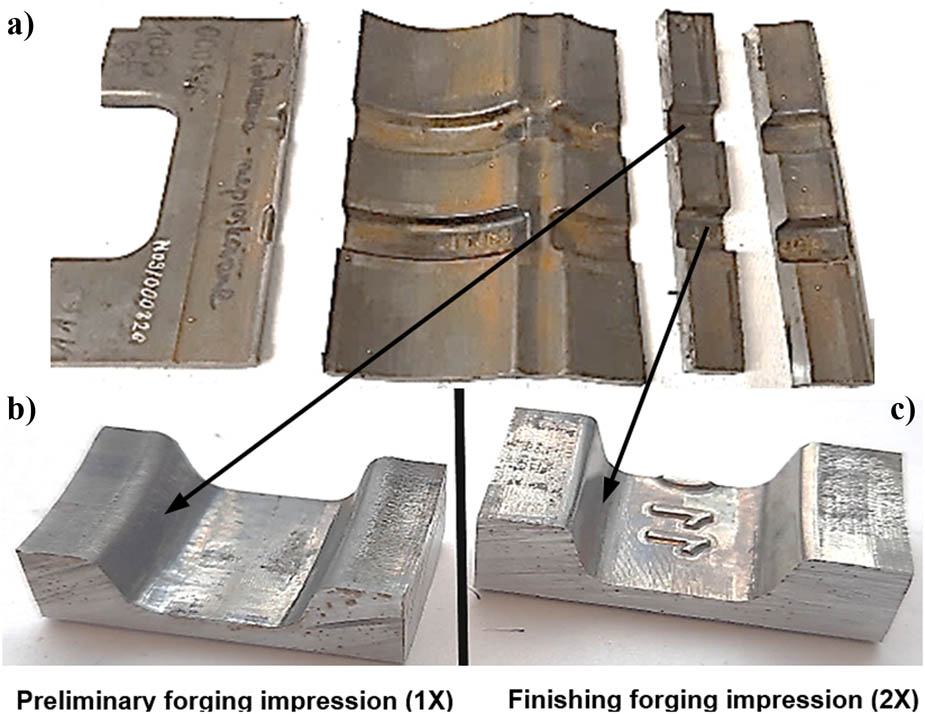
Figure 13
(a) An example of sampling locations with the samples taken from the forging tools after forging 1,200 pieces for (b) preliminary forging impression – 1× and (c) finishing forging impression – 2×.
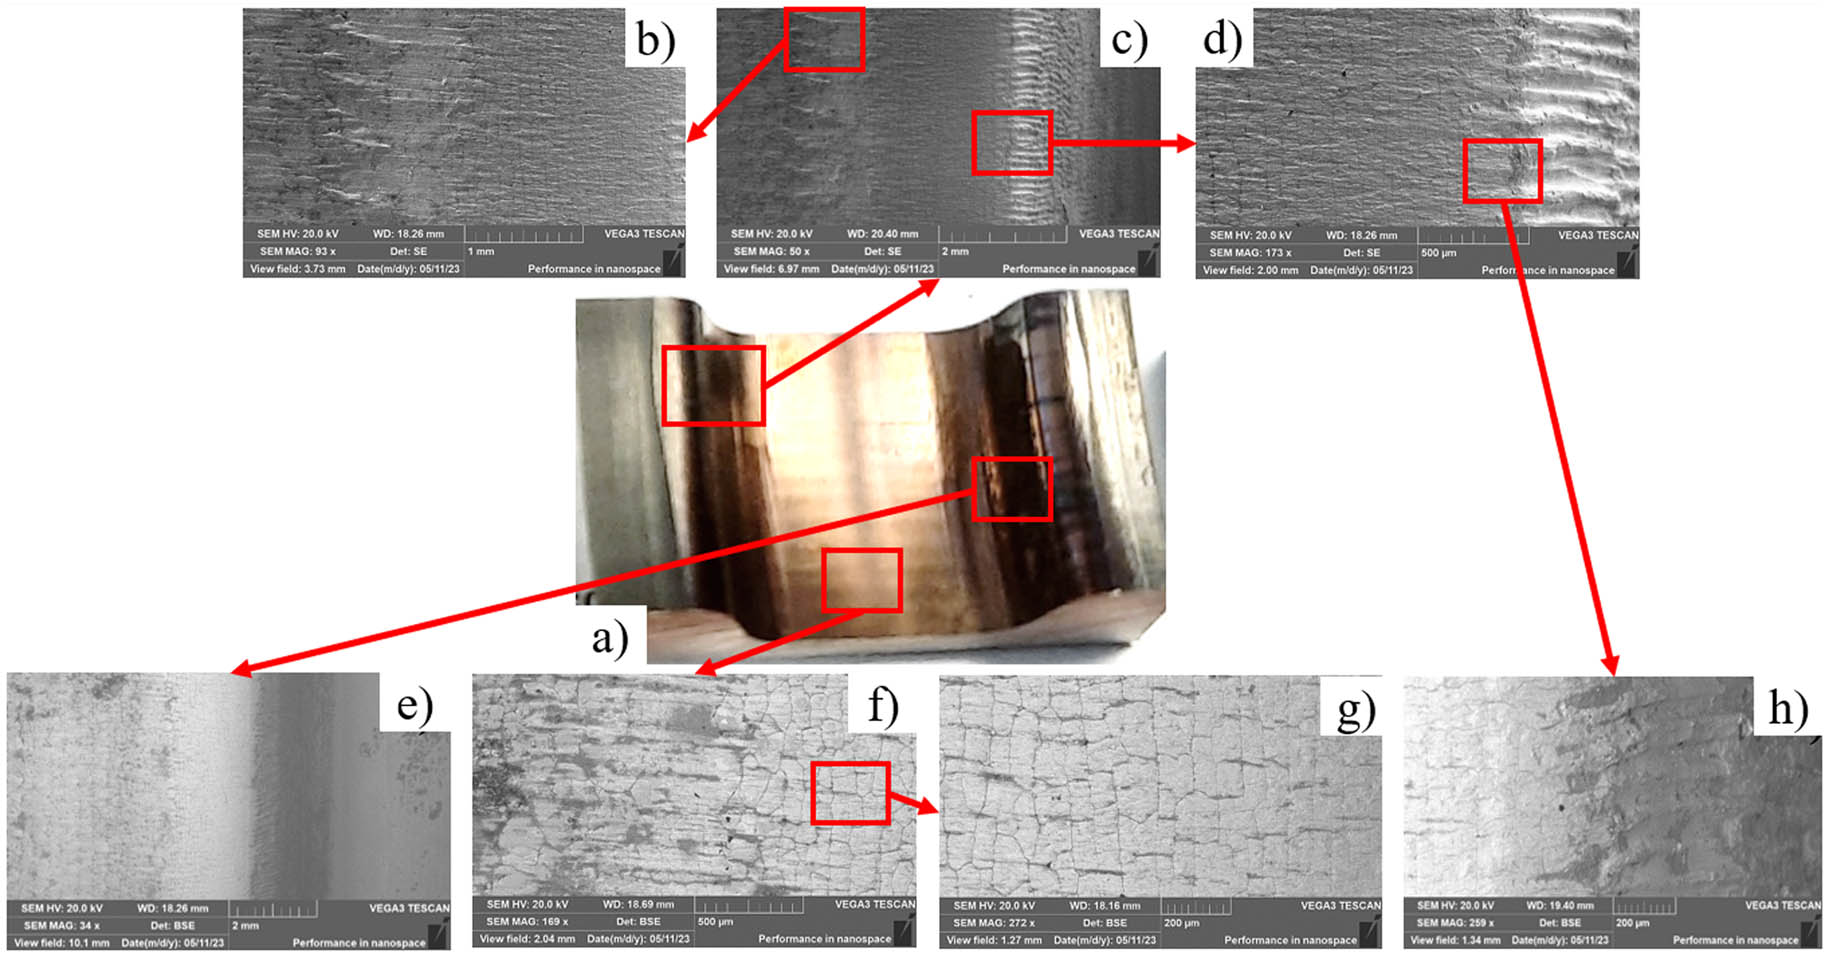
Figure 14
SEM test results for selected areas in the blocking impression – 1× after making 1,200 forgings: (a) view of the blocking impression (1×) and (b–h) different areas of blocking impression (1×) from (a).
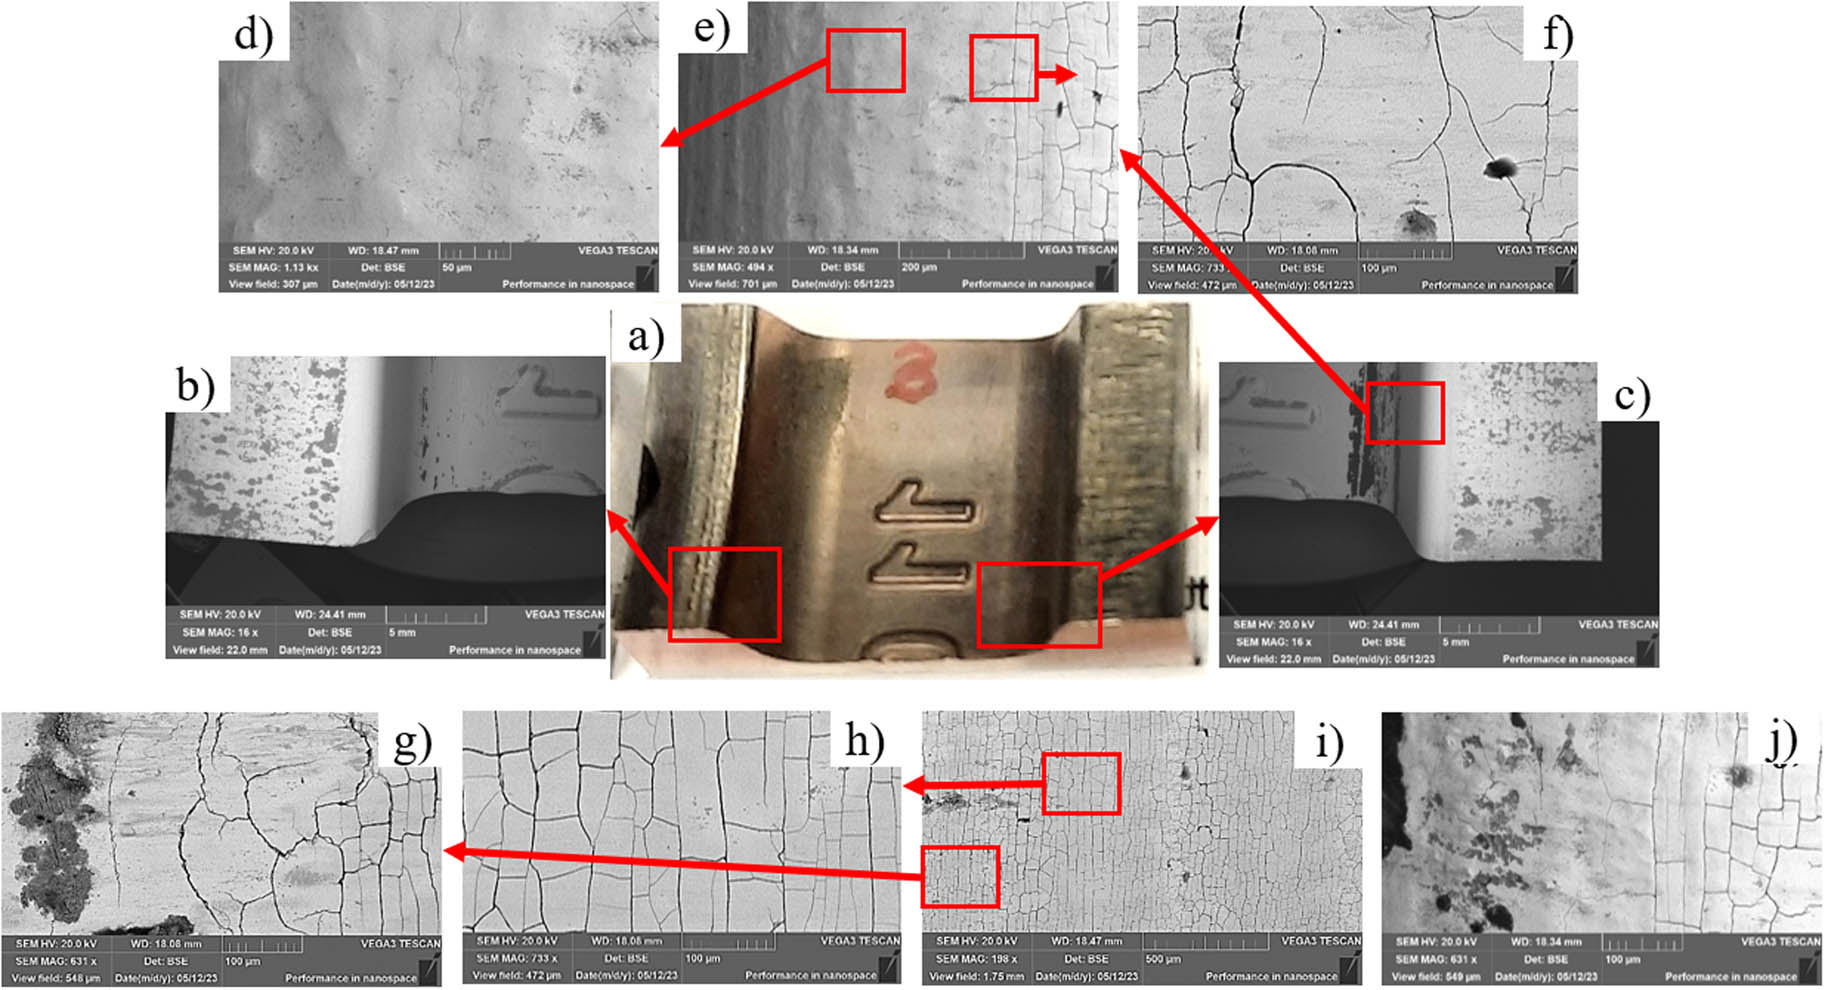
Figure 15
SEM test results for selected areas in the finishing impression – 2× after making 1,200 forgings: (a) view of the blocking impression (2×) and (b–j) different areas of finishing impression (2×) from (a).
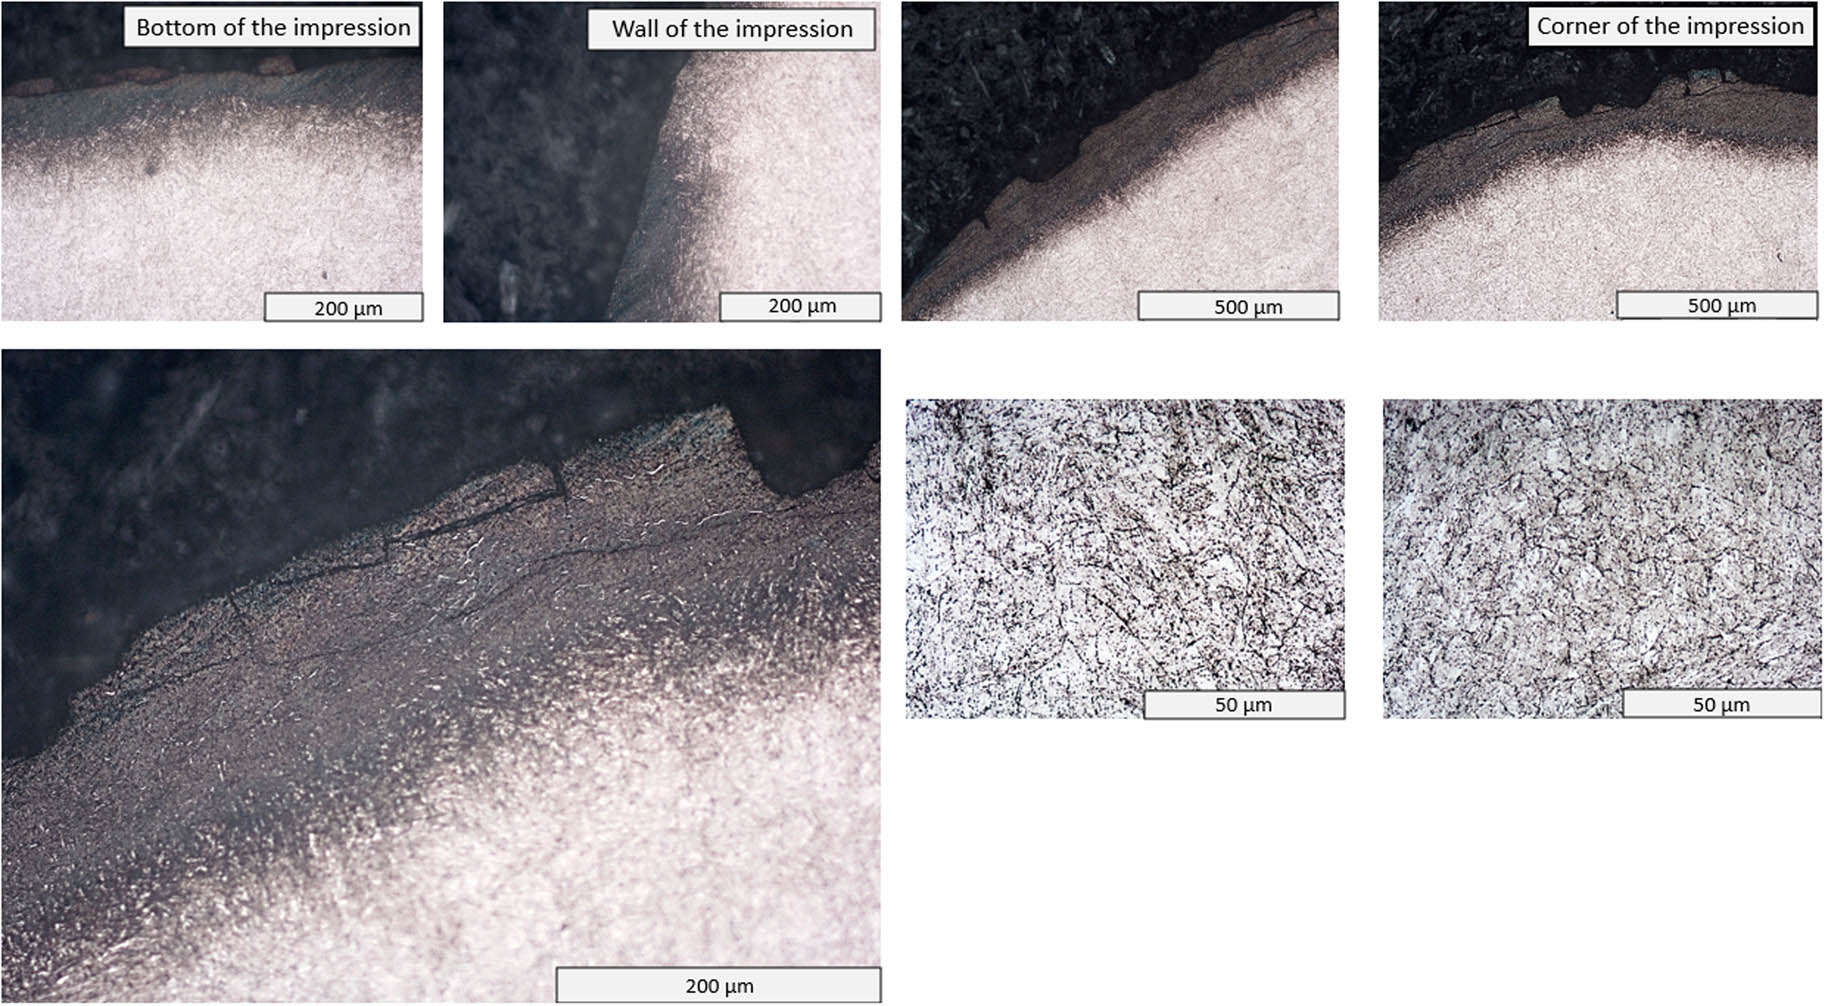
Figure 16
View of the forging tools after forging 1,200 pieces for different locations of the 1× blocking impression.
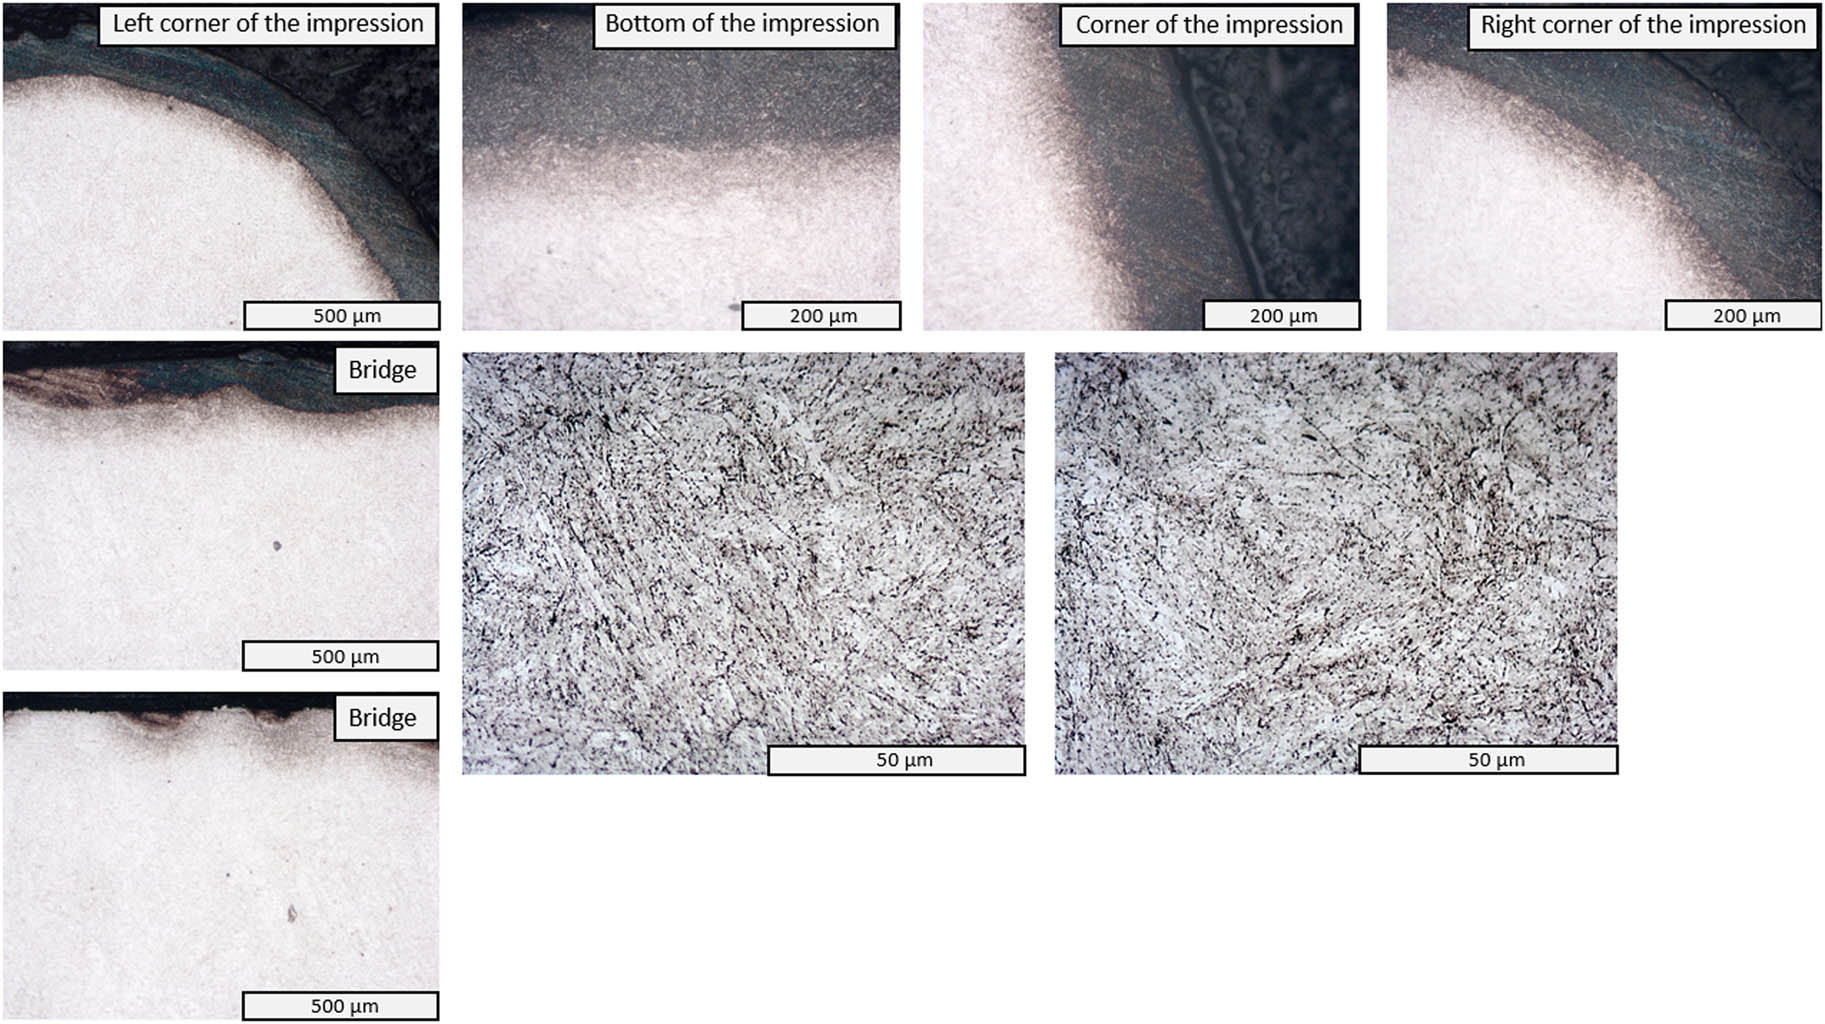
Figure 17
View of the forging tools after forging 1,200 pieces for different places of the 2× finishing impression.
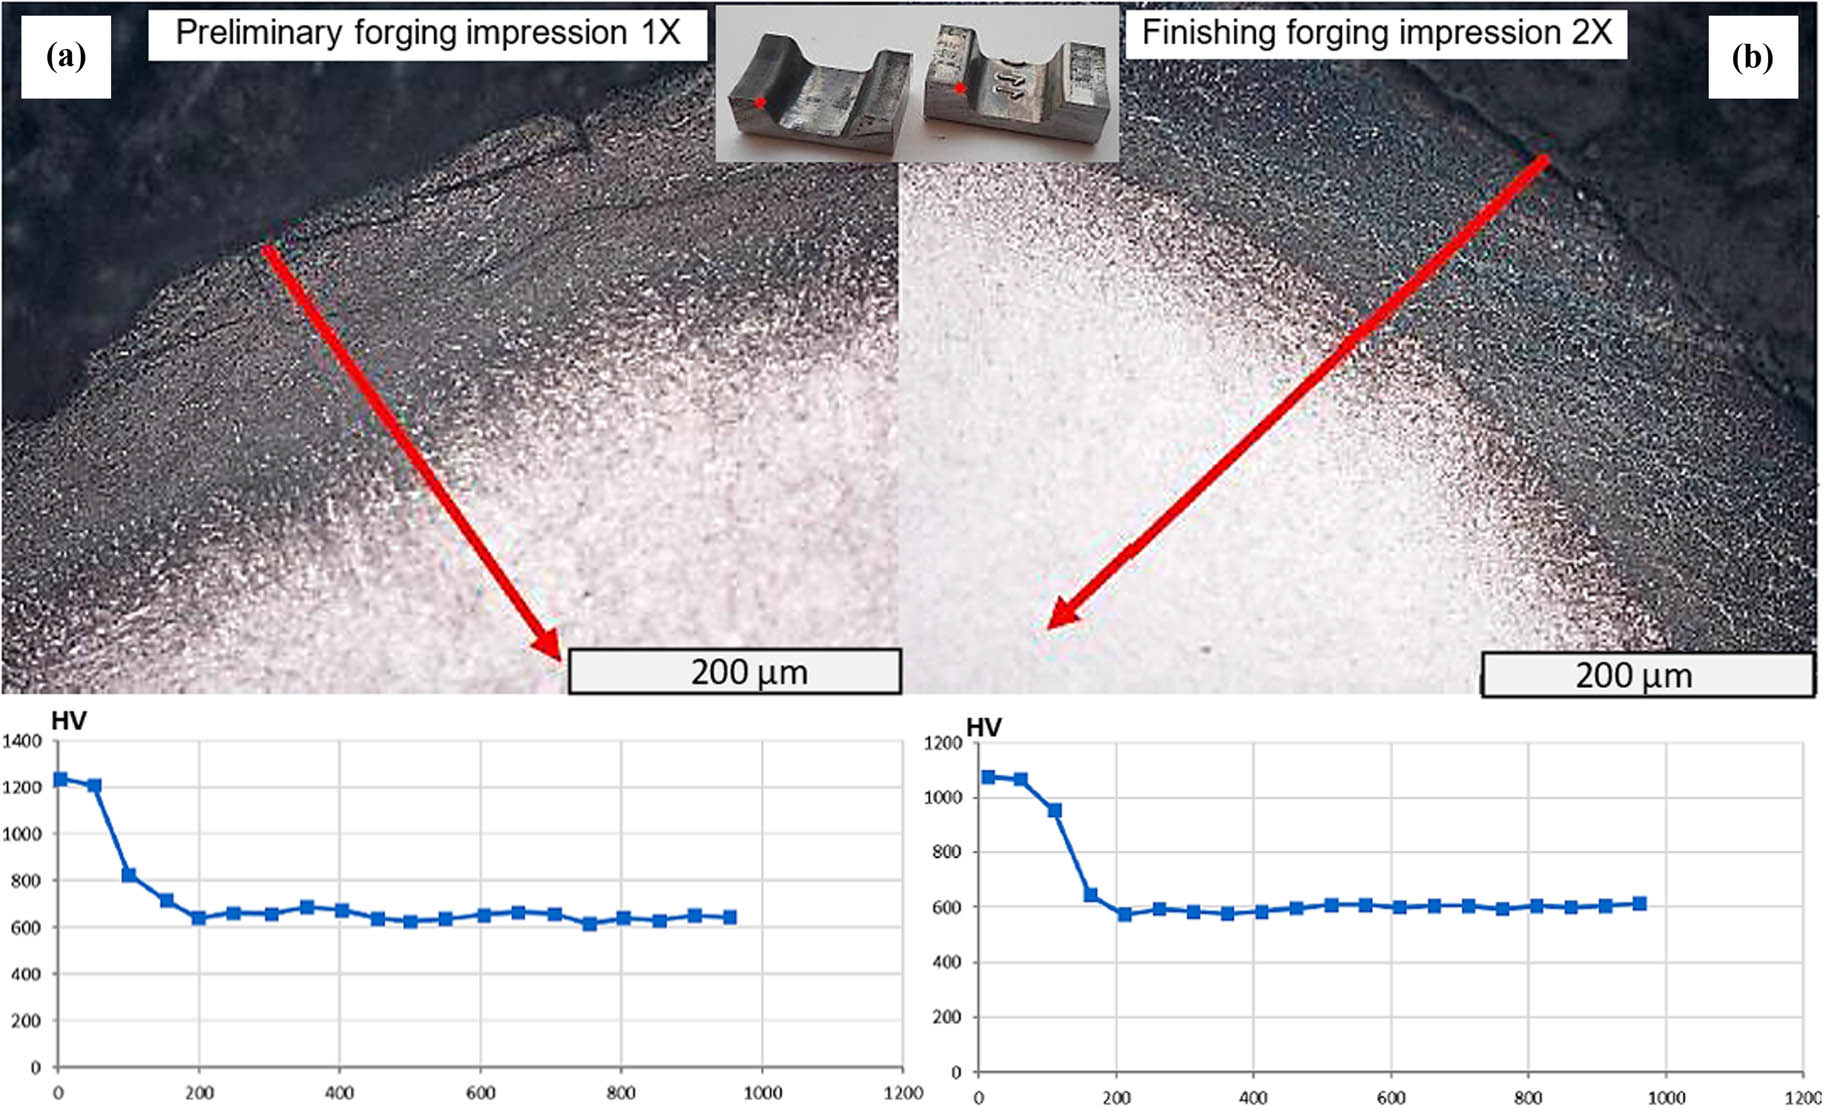
Figure 18
Microhardness measurements for (a) preliminary forging impression – 1× and (b) 2× finishing impression – 2×.
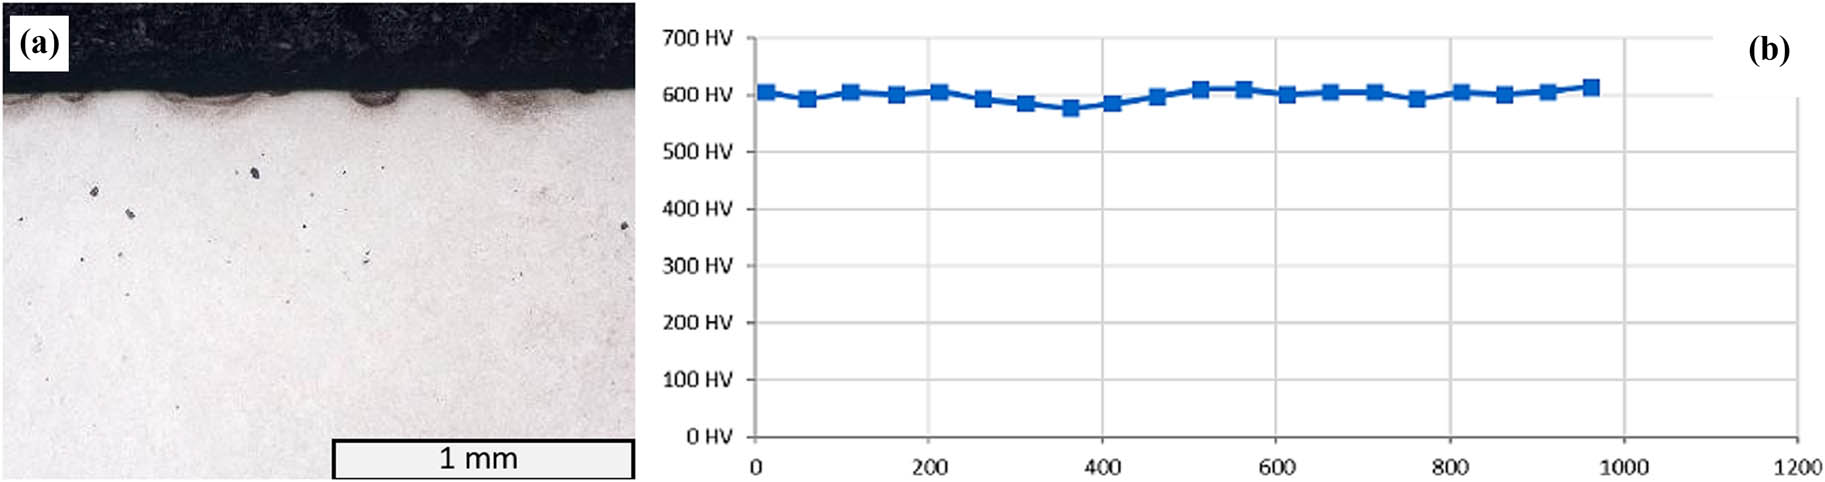
Figure 19
(a) Photo of the places subjected to the test – the place of flash formation around 2× and (b) microhardness distribution.