
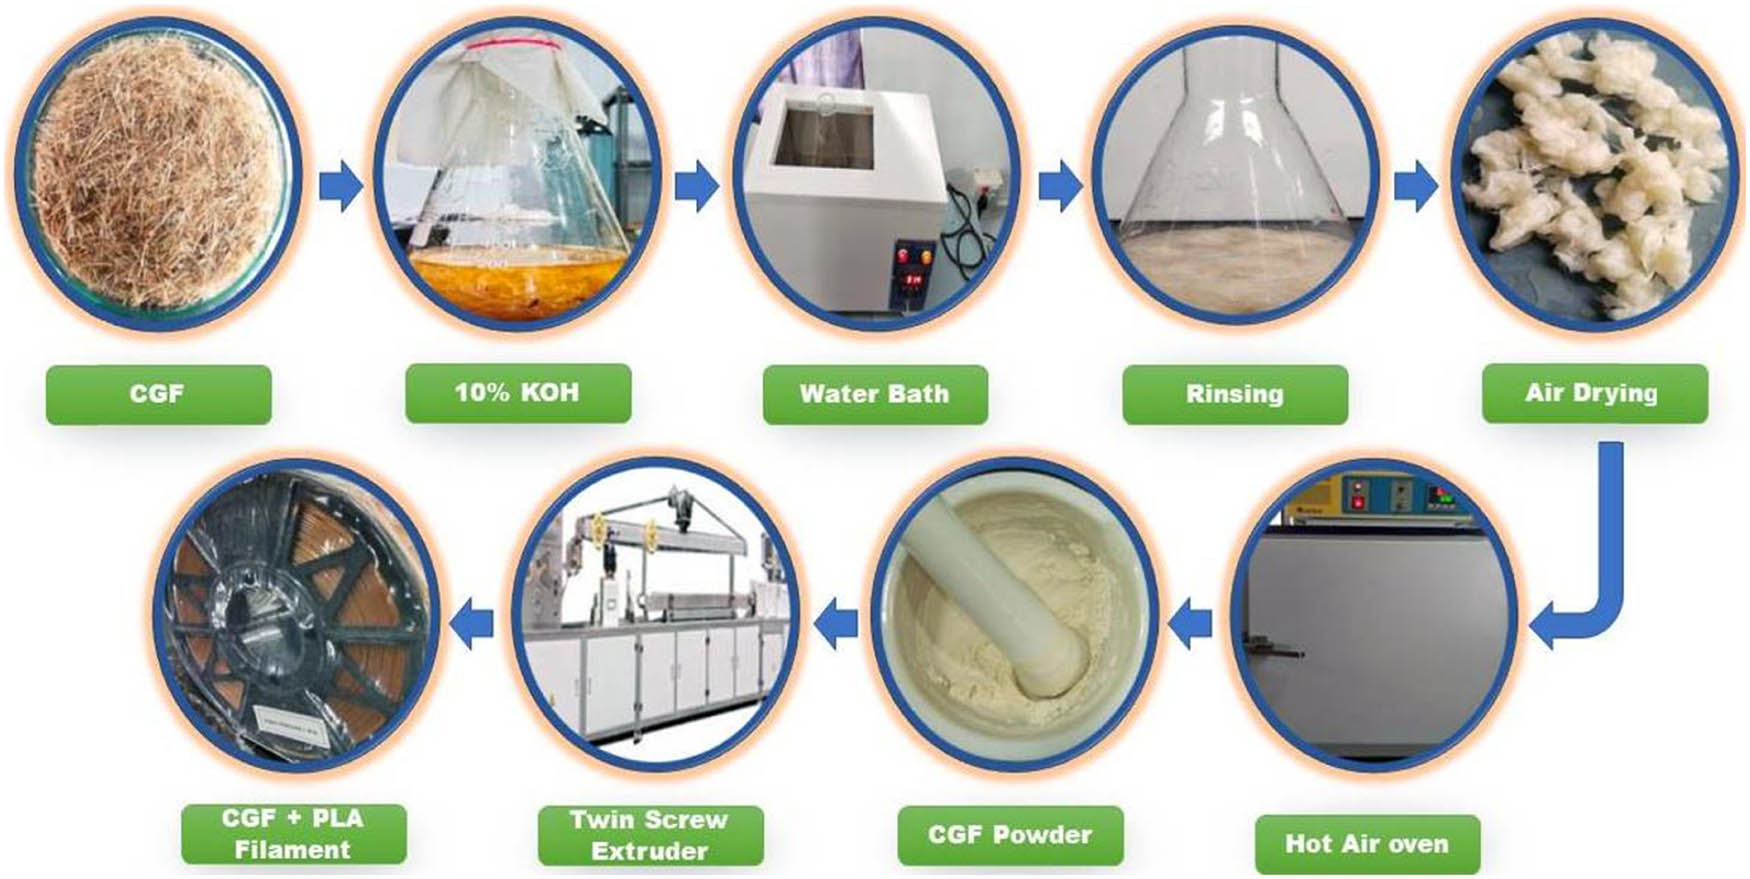
Figure 1
Production process of the filament.
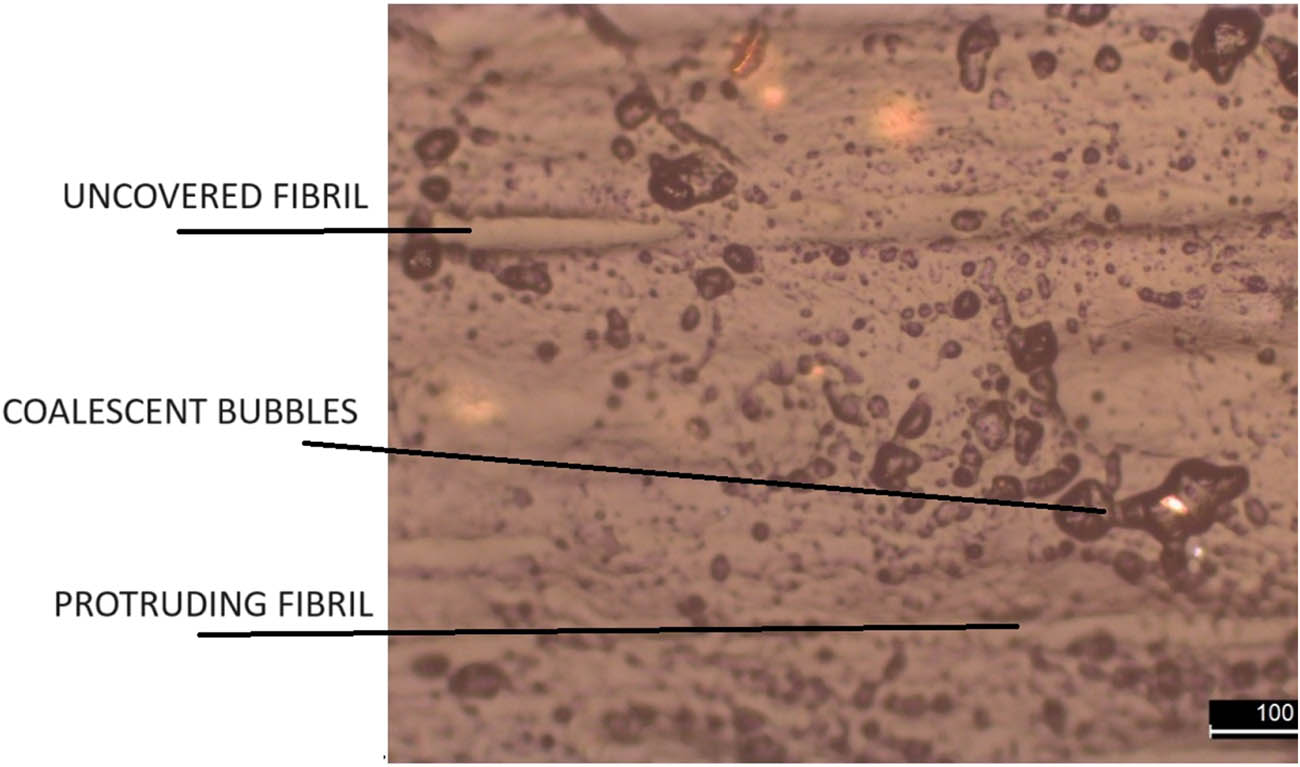
Figure 2
Optical microscopy image of a section of PLA/10% CGF filament.
Table 2
Tensile performance of the unfilled and filled filaments.
| Filament | Diameter (mm) | Tensile strength (MPa) | Ultimate strain (%) | Young’s modulus (GPa) |
|---|---|---|---|---|
| PLA | 1.75 ± 0.05 | 43.6 ± 2.8 | 4 ± 0.5 | 2.3 ± 0.2 |
| 90% PLA + 10% CGF | 1.75 ± 0.05 | 49.1 ± 3.3 | 3.2 ± 0.7 | 2.7 ± 0.4 |
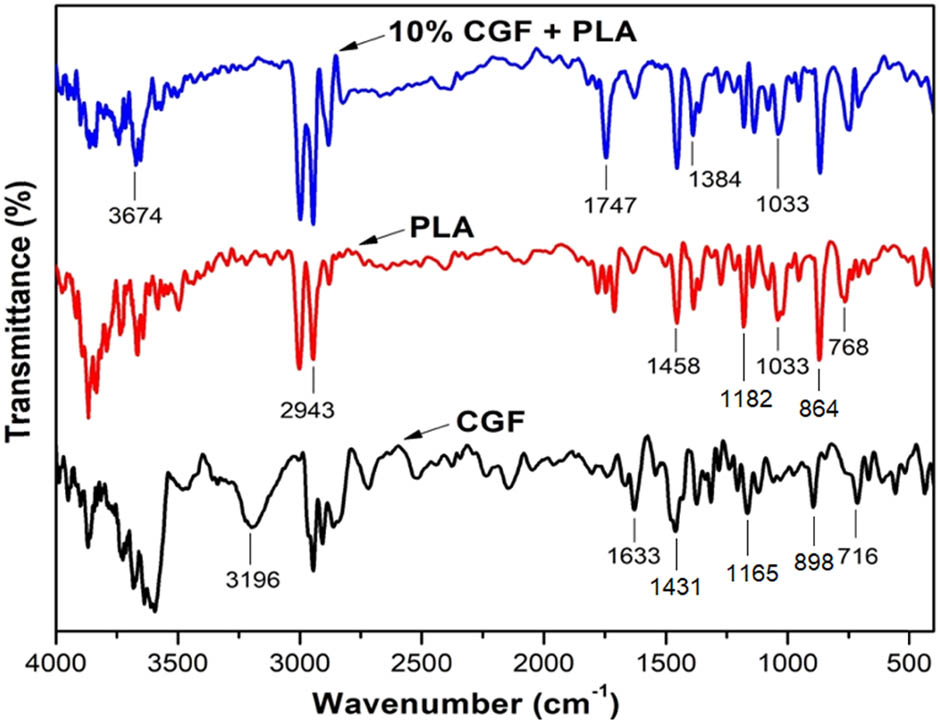
Figure 3
FTIR spectra for pure PLA, and CGF powder, and their 90/10 composite.
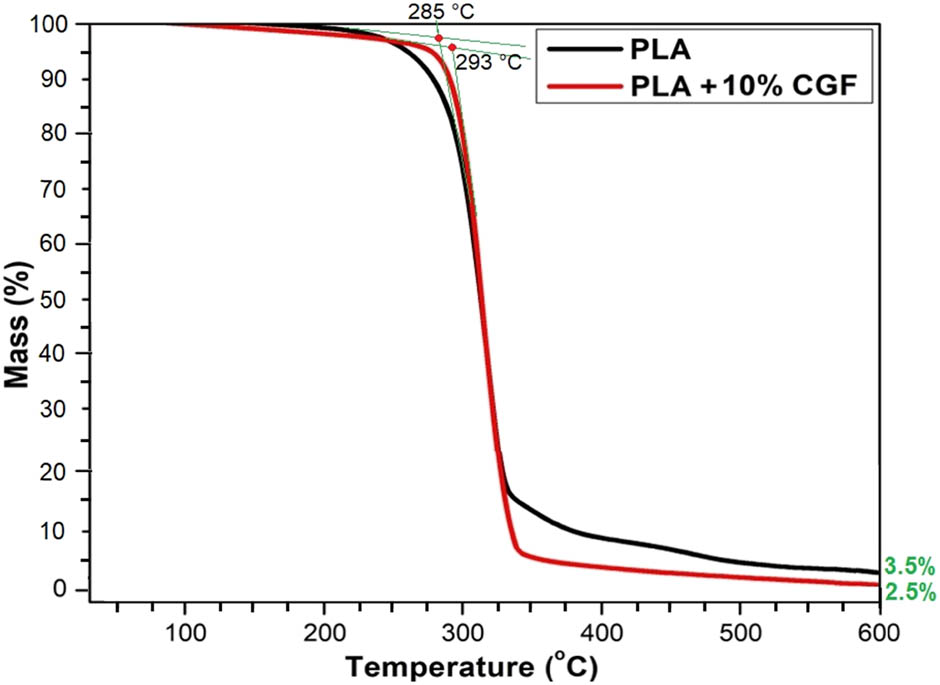
Figure 4
TGA curves for pure PLA and its 90/10 composite with CGF.
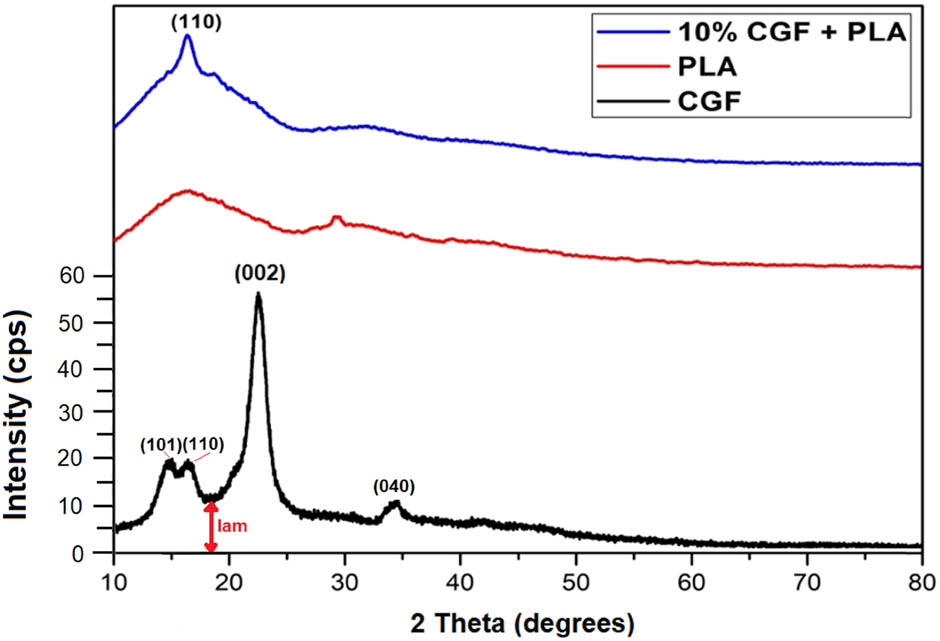
Figure 5
XRD spectra of CGF, PLA, and its composite.
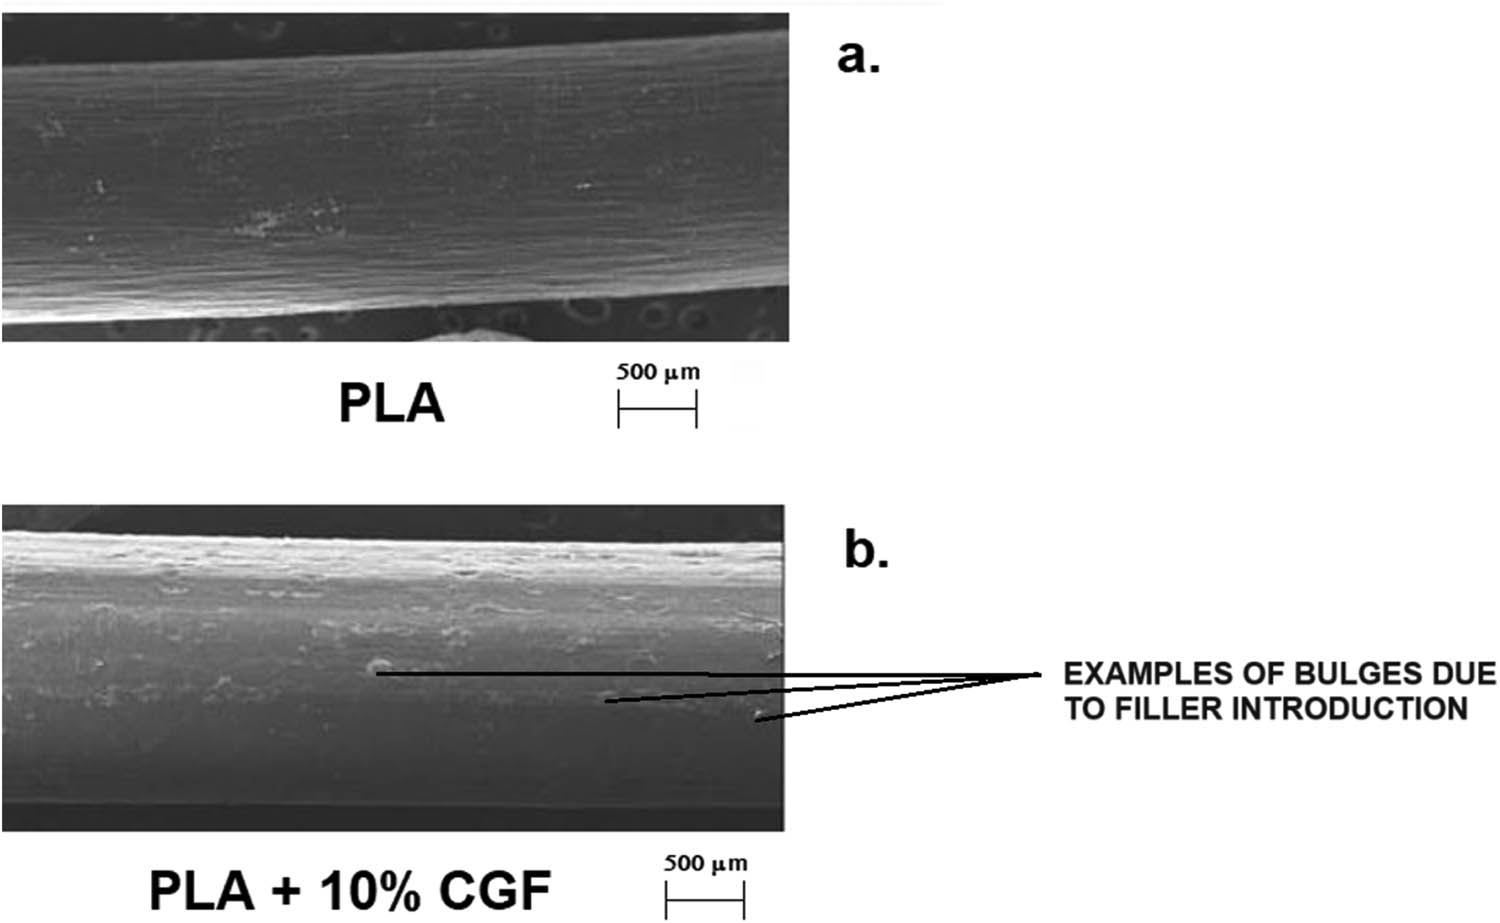
Figure 6
50× SEM images representing the (a) neat PLA filament and (b) 90% PLA + 10% CGF filament.
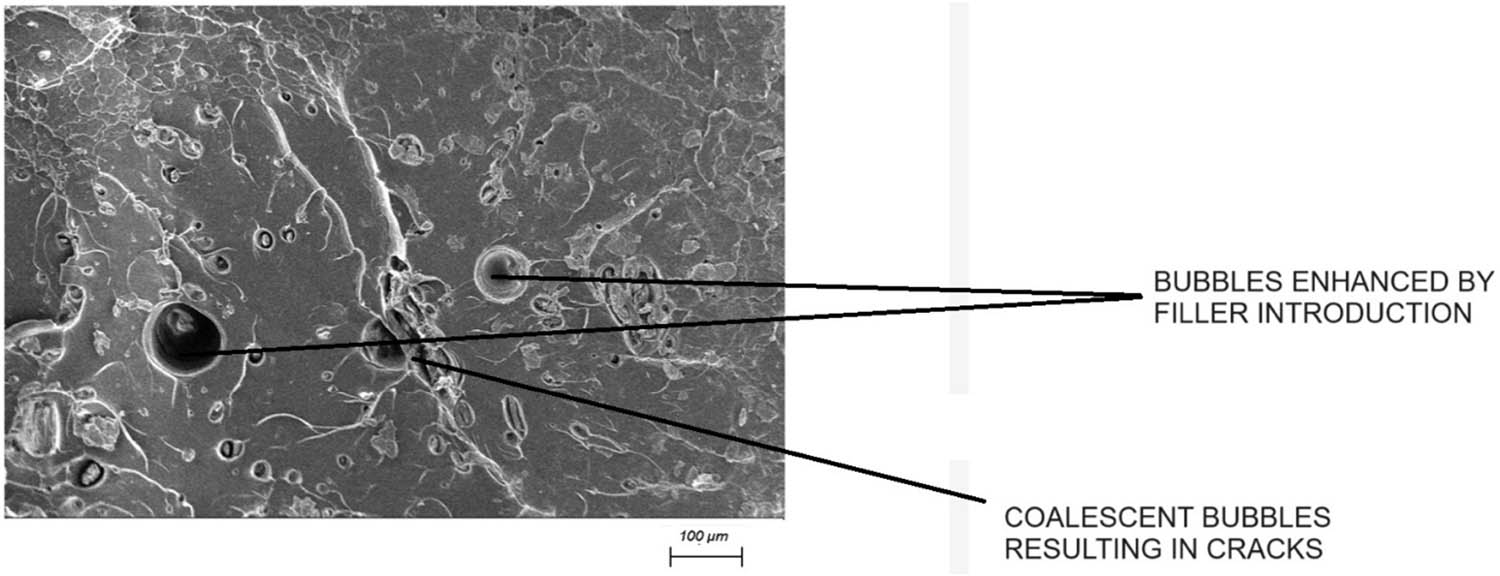
Figure 7
Image (300×) of the composite filament section with CGF particles.