
Minerals and nonrenewable resources are extensively used to produce concrete, especially natural aggregate. Concrete is a highly crucial element in building demolition operations. However, the waste generated from construction and demolition projects rapidly accumulates in landfills. This phenomenon adversely affects the ecosystem by causing air and groundwater contamination. The annual expenditures of millions of dollars to transport concrete waste from large towns to designated landfill sites, remove concrete debris from construction and demolition locations, and perform the appropriate burial procedures will further strain the economies of countries [1, 2]. Every year, the European Union produces more than 450 million tons of demolition waste, or approximately 1 ton per person [3]. However, the amount of demolition waste is increasing at unacceptable rates due to the ongoing conflicts in many regions of the world. These nations lack proper monitoring of demolition waste and face financial constraints that hinder appropriate disposal efforts, which has significant adverse effects on the environment, people’s health, and safety [4, 5].
Envision a world where we can construct structures that can withstand the loads applied over time while also preserving our planet. This vision is closer than you might imagine, and the solution lies in utilizing concrete made from recycled concrete aggregates (RCA) [6, 7]. Our research is focused on achieving a more sustainable and eco-friendly future. From the perspective of environmental sustainability, it is crucial to use waste concrete as RCA because the aggregate typically makes up 60%–80% of the concrete volume [8, 9]. Recycled aggregate refers to aggregates that have been recycled from previous building projects. Some reprocessing processes include crushing or grading aggregate to meet the required standards. An appropriate solution to achieve the objective of protecting non-renewable resources is to employ recycled aggregate in civil engineering applications [10, 11].
Researchers undertook numerous investigations to examine the effect of using RCA in concrete. Abedalqader et al. [12] experimentally examined the effect of adding recycled asphalt pavement (RAP) and RCA on the concrete mechanical characteristics after being exposed to a range of temperatures (20 °C, 200 °C, 400 °C, and 500 °C) and investigated the compressive, splitting tensile, flexural strengths, and modulus of elasticity. The findings demonstrated that mechanical characteristics reduced with increased RCA and RAP replacement levels at the same temperature. Moreover, the mechanical characteristic values reduced for the same RCA and RAP replacement ratios when the temperature rises. Katkhuda and Shatarat [1] tested 10 full-scale reinforced concrete (RC) beams without stirrups in an experimental program using three different combinations of coarse aggregates, including natural aggregate (NA), treated RCA, and untreated RCA. The replacement ratios of the RCA in five concrete mixtures differed: 100% NA, 50% treated RCA, 50% untreated RCA, 100% treated RCA, and 100% untreated RCA. The authors reported that employing untreated recycled aggregates decreases the shear capacity of the beams. According to the findings, utilizing 50% RCA improves the beams’ shear capacity while using 100% treated RCA decreases the shear capacity of the beams.
Some experimental tests [13, 14] were conducted to examine the bending behavior of recycled concrete beams. Among these studies, limited work is performed on large replacements of the coarse aggregates [15]. Regarding crack morphology and pattern, Pradhan et al. [16] observed no discernible difference between the RC beams made of NA and RCA. However, the authors noted that the specimens with RCA had more cracks than their corresponding NA samples. According to Are-zoumandi et al. [17], likely identical crack growth but not crack spacing was observed in the RCA and NA beams tested in flexure. Anike et al. [18] conducted experimental research on RC beams’ flexural strength, including recycled fine aggregate (RFA) and RCA with steel fibers (SF). The concrete’s hardened density, compressive, and splitting tensile strengths were also investigated. The findings demonstrated that the load-bearing capacity of the specimens with 100% recycled aggregate (RA) and 1% SF prepared by the usual approach increased by up to 13% and 8% compared with a similar mixture without SF and the control mixture, respectively. The nontraditional beam with 60% RA demonstrated the same load resistance (63 kN) as the beam constructed with 100% NA (i.e., control beam). Choi et al. [13] and Zhu et al. [19] examined the structural strength of flexural beams under sustained loads. They also considered the loads that continued for 380 and 3000 days. The creep and shrinkage in concrete substantially influence long-term member behavior. According to Zhu et al. [19], additional systematic testing is necessary to create design techniques.
The finite element (FE) approach can model RC members considering the actual properties of concrete and steel. However, this approach requires considerable computing time and careful assessment of the results. Accordingly, this approach is used to expand the range of experimental tests. In almost all cases, the FE is used in threedimensional (3D) analysis because it is more accurate when modeling nonlinear behavior [20, 21]. FE simulation is a viable alternative to experimental and theoretical analysis for forecasting the behavior of composite beams [22], particularly when numerous parameters and experimental tests cannot address them individually.
The structural design codes of different countries provide engineers with information and guidelines for designing different structural components. The provisions for evaluating beam resistance (shear and flexural strength) and the other code specifications for durability, details, etc. could show some differences across the codes. Numerous comparative examinations of the provisions found in various design codes are covered in the available literature. However, the data available to verify code provisions for shear and flexure capacity are limited, especially the RCA influences on the shear and flexural behavior of the RC beams. In this study, various building codes from the USA, Saudi Arabia, and Egypt are evaluated regarding shear and flexural strength, especially with RCA.
Given that RCA performance may change with increased concrete compressive strengths, how the inclusion of RCA influences the shear and flexural behavior of RC beams to establish accurate design methodologies must be understood. This project aims to assess the flexure and shear provisions of three different codes in the context of beams made from recycled aggregate concrete. To fill this gap, this work intends to study a green concrete option through modeling by using the FEs to test the recycled concrete beams that fail in shear and flexure. This study also intends to perform a parametric study using the ABAQUS FE program to address the shortcomings in the available experimental research. Specifically, these shortcomings are the use of relatively small amounts of RA, relatively low concrete compressive strength, relatively high shear reinforcement, and relatively low flexural reinforcement. Sixty FE models with different parameters, including various coarse natural aggregate replacement levels (i.e., 0%, 25%, 50%, 75%, and 100%), compressive strengths (i.e., 25, 35, and 40 MPa); and reinforcement rebar diameters (i.e., 14, 16, and 18 mm), are numerically investigated. Finally, additional experimental results reported in the literature (30 for shear and 61 for flexural tests) are utilized to verify the American Concrete Institute code (ACI318-19) [23], the Saudi Building Code (SBC304-18) [24], and the Egyptian Code of Practice (ECP203-2020) [25] provisions for shear and flexure capacity.
Two beams that had previously been experimentally tested were selected to validate the FE models in the study. The first beam was used to validate the shear performance of the FE models, while the second beam was used to validate the flexural performance of the FE models.
The FE models of this investigation are validated using the experimentally tested beams from Ignjatovic et al.’s [26] research, namely RAC50-3, with details presented in Figure 1. In this beam, the RCA replaces 50% by mass of the natural coarse aggregate. The shear reinforcement ratio is 0.14%. The concrete cylinder’s compressive strength is 37.04 MPa, the Young’s modulus is 24.5 GPa, and the splitting tensile strength is 3.2 MPa. The dimensions of the beam are 200 x 300 x 3500 mm. The yield strength of the stirrups is 300 MPa, while that of the longitudinal bars is 555 MPa. The beam is supported and spans a length of 3000 mm. Two-point loads are applied at the third points.

RAC50-3 specimen details: (a) longitudinal-section and (b) cross-section [26]
The FE models of this investigation are validated using experimentally tested beams from Seara-Paz et al.’s [15] research, namely H50-100, with details presented in Figure 2. In this beam, 100% of the coarse aggregate is replaced by RCA. The beam dimensions are 200 x 300 x 3600 mm. The longitudinal reinforcements are two bars of 16 mm diameter. The beam is supported under two-point loading. The clear span is 3400 mm. The concrete cylinder’s compressive strength is 42.9 MPa, the splitting tensile strength is 2.3 MPa, and the Young’s modulus is 25.9 GPa. The dimensions and reinforcements of the beam are shown in Figure 2. The yield strength of the stirrups is 240 MPa, while that of the longitudinal bars is 420 MPa.

H50-100 specimen details: (a) longitudinal-section and (b) cross-section [15]
In the numerical analysis, ABAQUS FE program (version 6.19) [20] was utilized because it can simulate problems with difficult tasks and the nonlinear behavior of various materials, both of which are required for this study.
The concrete damaged plasticity model (CDPM) is frequently used in FE modeling, as done by Alshaikh et al. [27] when modeling the collapse of a frame made of rubberized concrete, by Altheeb et al. [28] when studying the progressive collapse of reinforced concrete structures, and by Alshaikh et al. [29] when evaluating the progressive collapse of beam-slab substructures made of rubberized concrete, was used in simulating the behavior of concrete. The CDPM accurately simulates how concrete responds to pressure by crashing and cracking, which represented the compressive and tensile strengths, respectively. The CDPM was developed by Lubliner et al. [30] and Lee and Fenves [31]. The CDPM’s parameters were chosen in accordance with ABAQUS (Table 1) [20]. The stress-strain curve for the concrete’s compression behavior can be split into two portions, as shown in Figure 3. Up to 40% of the maximum compressive strength

Stress–strain curve equations for the concrete’s compression behavior [34]
CDPM parameters utilized in this study
| Parameters Dilation angle (ψ) Stress ratio (fb0/fc0) | Compressive meridian (Kc) | Eccentricity (ε) | Viscosity (μ) | ||
|---|---|---|---|---|---|
| Value | 27 (calibrated value) | 1.16 (default value [20]) | 0.667 (default value [20]) | 0.1 (default value [20]) | 0.001 default value [20]) |
In all the parametric study that follows, the cylinder compressive strength of the concrete with RAC
The expression for the strain at peak strength (εc1) is given in Figure 3 for concrete with normal aggregates. Also, the maximum value for strain (εcu) is given as 0.0035. For the case of concrete with recycled aggregates Belen et al. [36] suggest the following relations (Equations (3) and (4)) for the corresponding values of strain at peak strength with recycled aggregates
The value of the elastic modulus for recycled aggregate concrete
The value of the modulus of elasticity for the concrete of normal aggregate is taken according to ACI318M-19 [23] as
According to Figure 4, which shows the behavior of concrete under tension, the softening curve started with the ultimate concrete tensile strength (fr), which was estimated according to ACI 318M-19 [23] using Equation (7). In addition, fr is the stress that determines the initiation of microcracking. Moreover, the fracture energy (Gf) and critical crack opening (Wc) were estimated using Equations (8) and (9), respectively, according to [37, 38].

Concrete’s tension behavior
where α0 is related to the aggregate’s types, which is a set of 1.44 crushed or angular aggregates; da is related to the aggregate’s size, which is a set of 14 mm; and w/c refers to the water-to-cement ratios taken according to each experimental data.
According to reference [35], the tensile strengths for concrete with aggregate replacements of 20%, 50%, and 100% are reduced by 2%, 2%, and 10%, respectively, compared with the concrete with NA. The ratios for the other values of aggregate replacements can be obtained as a percentage from the previously mentioned values.
Titoum et al. [39] presented an idealized bilinear stress-strain curve to simulate the behavior of the reinforcement bars, as shown in Figure 5. The stress-strain curve was generated by utilizing the experimental yield stress value (fy) and ultimate stress (fu), which can be set as 1.25fy, with yield strain (εy) that can be estimated as a modulus of elasticity (Es) divided by fy and ultimate strain (εu), which is set as 0.15 [40]. The value of each fy was taken from the experimental data. The idealized curve was employed in this study because it is much more stable to use in a numerical simulation. The Es and Poisson’s ratio (v) for the reinforcement bar were set at 200,000 MPa and 0.3, respectively, which were widely used in FE analysis.

Idealized curve of the reinforcement bars
The concrete beams in each specimen are modeled using continuum elements, which are solid cube-shaped elements. The element, called C3D8R, is 3D, has eight nodes, has reduced integration points to reduce the analysis time, and significantly lowers the computational cost. Reinforcement steel bars are modeled using a truss element (i.e., T3D2), defined as 3D with two node elements. The diameters of all longitudinal and transverse reinforcement bars and the crosssections of the concrete beams are modeled according to the data presented by Ignjatovic et al. [26] and Seara-Paz et al. [15] for shear and flexural tests, respectively.
The steel loading and support plates were set as rigid bodies, restricted to the respective reference points, as shown in Figure 6(a). The steel loading and support plates were simulated using only elastic behavior (i.e., Es = 200, 000 MPa and v = 0.3). The interaction between the steel loading/support plates and the concrete beam surfaces was set to “tie” contact to avoid the convergence problem in the static analysis, as shown in Figure 6(b). The “embedded modeling” technique was used in this study to accurately represent the bonding interaction of the reinforcement steel bars inside the concrete beam, as shown in Figure 6(c). The bonded interaction was applied by restricting the translational degrees of freedom of the embedded elements (i.e., reinforcement bars) to those in the host elements (i.e., surrounding concrete) [20].

Constraints and interactions of tested specimens: (a) Rigid bodies, (b) Tie contact, and (c) Embedded constraints
The support characteristics of the experimental tests were applied to the FE models through the boundary condition technique. The boundary conditions and the loading application for each specimen are shown in Figure 7. The transitions and rotations were restricted to represent a hinge for the left support (i.e., Ux=Uy=Uz=URx=URy = 0) and a roller for the right support (i.e., Uy=Uz=URx =URy = 0). The experimental loading was applied to the two steel loading plates by increasing the displacement at their reference points (which act vertically downward) until the specimen failed.

Boundary conditions and applied loads
After modeling, the H50-100 beam was used for the mesh convergence analysis, which was carried out on three various mesh densities (Mesh 1 = size 100 mm, Mesh 2 = size 60 mm, Mesh 3 = size 40 mm, and Mesh 4 = size 20 mm). The results are shown in Figure 8. The four mesh densities were simulated using equal geometry, material parameters, and FE element types. An assessment of the four mesh densities was carried out to choose a fitting size. Compared with the previous experimental results, Mesh 3 offered a better-fit curve and produced more precise results (Fig. 8). Although Mesh 4 was the smallest size, it did not give better results compared with Mesh 3. Further mesh refinement attempts required more running time and resources. However, these attempts did not improve the results compared with those of Mesh 3. Thus, all the beams (for shear and flexural tests) were adopted at the same size as Mesh 3.
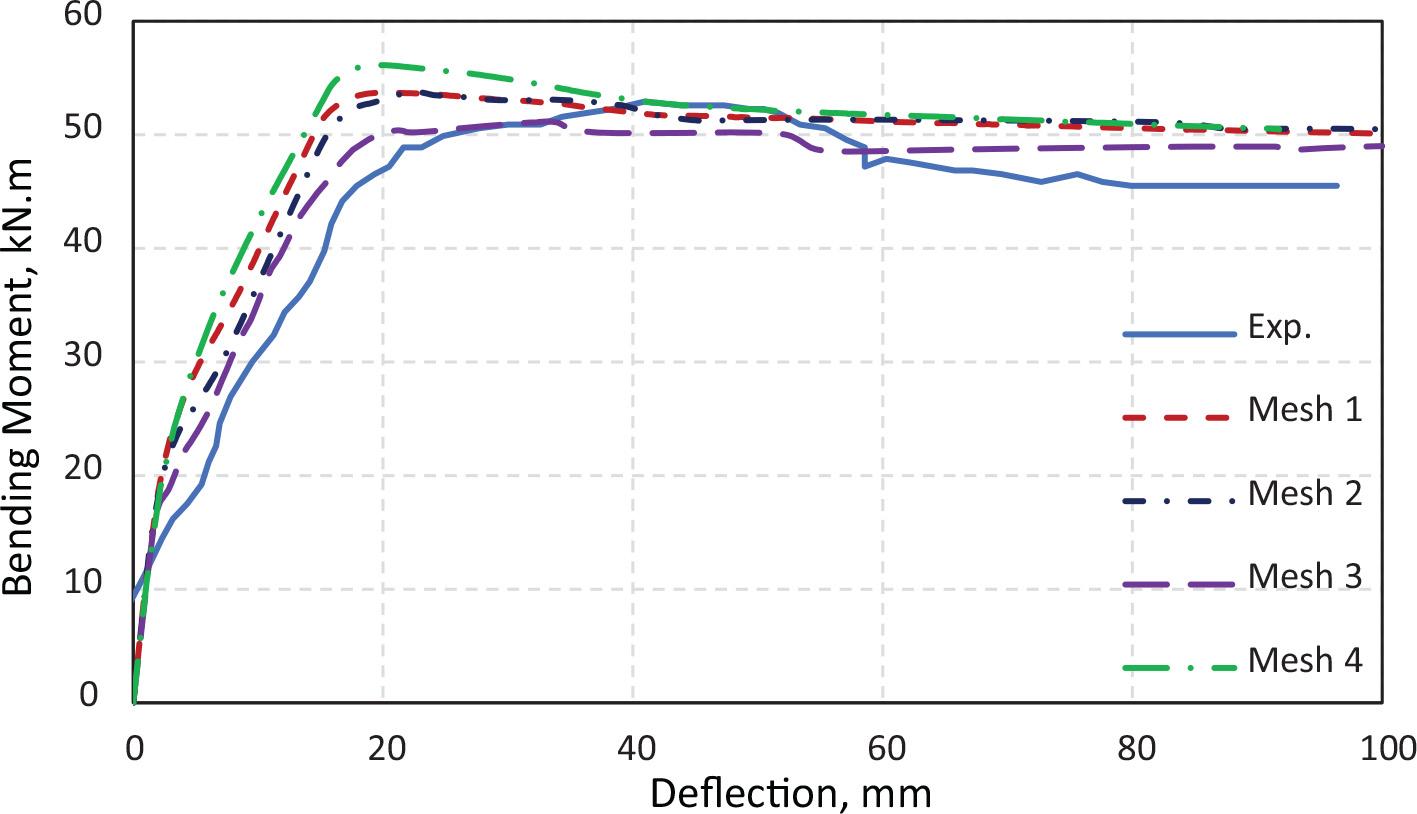
FE mesh sensitivity results
Figure 9 shows the comparison between the previous experimental and FE load–deflection curves of beam RAC50-3. The FE curve shows good agreement. This finding confirms that the FE model using ABAQUS can simulate the shear behavior of this type of beam. Figure 10 presents the comparison of the bending moment–deflection curves of beam H50-100 from the experimental and FE analyses. The close correspondence is evident. The capability of the FE model using ABAQUS to predict the bending behavior is confirmed. Therefore, using various parametric studies, the FE models using ABAQUS software can be applied to investigate the shear and flexural strengths of the RC beams made with RCA.

Experimental and FE load-deflection curves of beam RAC50-3

Experimental and FE bending moment–deflection curves of beam H50-100
Fifteen FE runs are performed for beams that failed in shear. The beams have the same crosssection, span, bottom and top reinforcement, supports, and loading as beam RAC50-3 of Ignja-tovic et al. [26]. The beams have five recycled aggregate replacement ratios (0%, 25%, 50%, 75%, and 100%). The shear reinforcement consists of stirrups 6 mm in diameter at 150 mm. Three normal aggregate concrete strengths (25, 35, and 40 MPa) are assumed. Moreover, 45 FE runs are performed for beams that failed in flexure. These beams are similar to beam H50-100 of Seara-Paz et al. [15] in terms of the cross-section, span, top reinforcement, stirrups, supports, and loading. The concrete strengths and recycled aggregate ratios are similar to the shear beams. However, the bottom reinforcements are two bars of 18, 16, or 14 mm diameter. The following procedure is used to specify the names of the FE runs conducted in the parametric study. The first letter for shear specimens is S, the second numeral is the ratio of the recycled aggregate replacements. The third numeral is the spacing between stirrups, and the fourth numeral is strength for the case of no recycled aggregates. Regarding the flexural FE runs, the first letter is F, the second numeral is the ratio of the recycled aggregate replacements, the third numeral is the reinforcement diameter, and the fourth numeral is the cylinder concrete compressive strength for the case of no recycled aggregates. The FE analysis matrix that was considered for this study is listed in Table 2.
Details of the FE analysis matrix
| Scenarios | Specimen ID | RCA ratio | Concrete strengths | Main rebar diameter | No. of specimens |
|---|---|---|---|---|---|
| Beams Failing in Flexural | F-0-18-(25/35/40) | 0% | 25/35/40 MPa | 2T18 mm | 3 |
| F-25-18-(25/35/40) | 25% | 3 | |||
| F-50-18-(25/35/40) | 50% | 3 | |||
| F-75-18-(25/35/40) | 75% | 3 | |||
| F-100-18-(25/35/40) | 100% | 3 | |||
| F-0-16-(25/35/40) | 0% | 25/35/40 MPa | 2T16 mm | 3 | |
| F-25-16-(25/35/40) | 25% | 3 | |||
| F-50-16-(25/35/40) | 50% | 3 | |||
| F-75-16-(25/35/40) | 75% | 3 | |||
| F-100-16-(25/35/40) | 100% | 3 | |||
| F-0-14-(25/35/40) | 0% | 25/35/40 MPa | 2T14 mm | 3 | |
| F-25-14-(25/35/40) | 25% | 3 | |||
| F-50-14-(25/35/40) | 50% | 3 | |||
| F-75-14-(25/35/40) | 75% | 3 | |||
| F-100-14-(25/35/40) | 100% | 3 | |||
| Beams Failing in Shear | S-0-150-(25/35/40) | 0% | 25/35/40 MPa | 2T16 + 4T22 | 3 |
| S-25-150-(25/35/40) | 25% | 3 | |||
| S-50-150-(25/35/40) | 50% | 3 | |||
| S-75-150-(25/35/40) | 75% | 3 | |||
| S-100-150-(25/35/40) | 100% | 3 | |||
| Total Number of Specimens | 60 | ||||
Shear and flexural failing beams are collected from the published experimental tests. The compilation consists of 30 experimental beams that failed due to shear, including nine beams with no recycled aggregate for comparison, and 61 experimental beams that failed due to flexure, which include 22 beams with no recycled aggregate for comparison. The 30-shear beams consist of three beams from Ignjatovic [41], four beams from Ajdukiewicz and Kliszczewicz [42], three beams from Fathifazl et al. [43], six beams from Gonzalez-Fonteboa and Martinez-Abella [44], three beams from Ignjatovic et al. [26], two beams from Al Mahmoud et al. [45], and nine beams from Etxeberria [46]. The 61 flexural beams are taken from the previous research work and consist of eight beams from Kang et al. [47], nine beams from Ignjatovic et al. [14], two beams from Choi et al. [13], eight beams from Fathifazl et al. [48], 12 beams from Knaack and Kurama [49], eight beams from Seara-Paz et al.’s [15], four beams from Nandhini et al. [50], and 10 beams from Sato et al. [51]. In the selection of the experimental results, the beams with no stirrups are not considered among the 30 and 61 specimens. These beams cover a wide range of the parameters studied in this research. The cylinder compressive strength of the shear beams ranges from 30 MPa to 50 MPa, and the percentage of used recycled aggregates ranges from 30% to 100%. However, the cylinder compressive strength of the flexural beams ranges from 29 MPa to 57 MPa, and the percentage of recycled aggregates used for these collected beams varies from 20% to 100%.
The beams of the parametric study, which are made using FE runs, are grouped based on the strength of the beams with normal aggregates. Every group consisted of five beams with similar parameters, except the recycled aggregate ratio. Figure 11 shows, for one group as an example, the variation of load and deflection for beams with recycled aggregate ratios’ replacements equal to 0%, 25%, 50%, 75%, and 100%, and the normal concrete strength of 25 MPa. The maximum load decreased with the increase in the RCA ratio, and the deflection increased. The curves’ ascending portion was similar, up to around 40% of the maximum loads. The descending parts after the maximum loads were similar. This phenomenon can be attributed to the shear resistance of the specimens with RCA being adversely affected by its high-water absorption [52] and higher porosity because the adhered mortar stuck to the NA, which could result into a greater permeability interfacial transition zone between the adhered mortar and NA [53]. Replacing 25% of the NA with RCA resulted in a decrease in shear strength of an average of 4.1% for all different concrete strengths (i.e., 25, 35, and 40 MPa) compared with the specimens without RCA. The same pattern was observed in the increased RCA ratios, which resulted in a decrease in the shear strength with averages of 5.5%, 8.2%, and 10.1% for specimens with replacement levels of 50%, 75%, and 100%, respectively, with all different concrete strengths (i.e., 25, 35, and 40 MPa) compared with the specimens without RCA. The investigation results in this study were consistent with those of previous studies [1, 12]. Moreover, cohesive strength, interfacial friction strength, and aggregate interlocking strength comprised most of the shear strength of RCA specimens, with interfacial friction strength dominating and accounting for 25% to 70% of the strength of the RCA specimens for shear [54].

Load–deflection relationships for beams with different RCA ratios
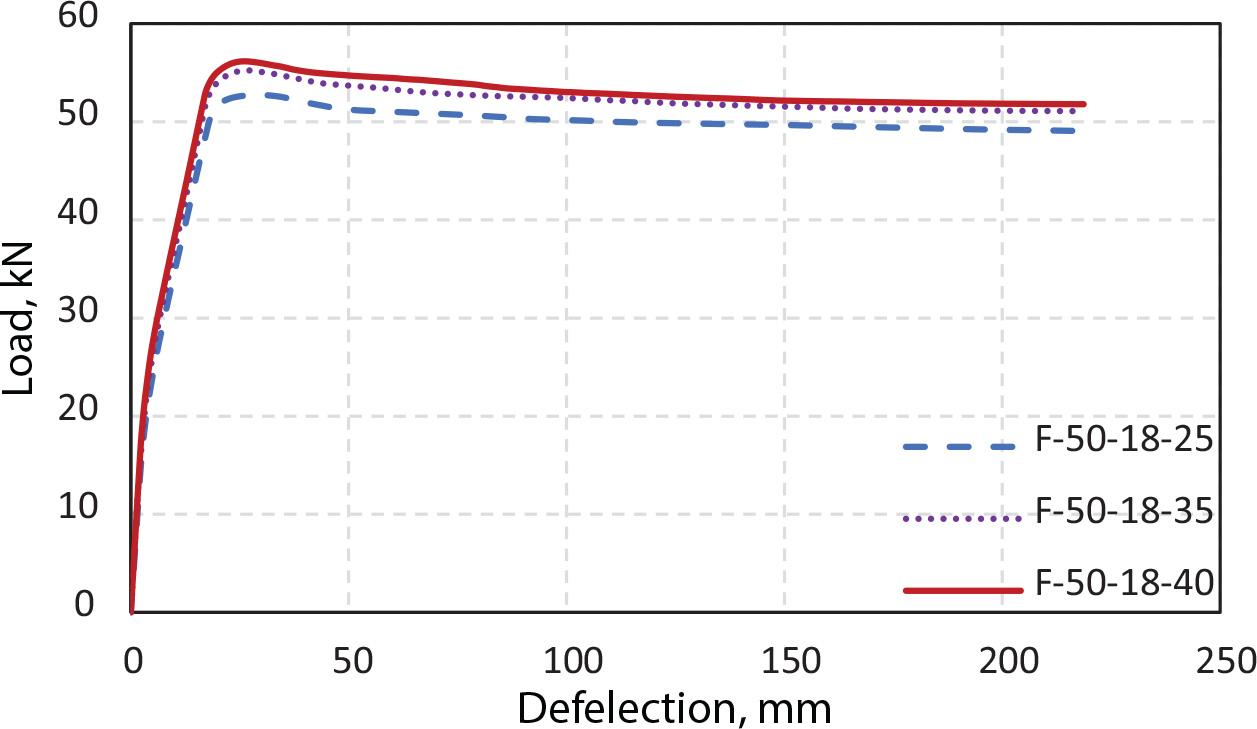
In this study, the beams were grouped based on the ratio of recycled aggregate replacements. Every group contained three beams of different compressive strengths for the corresponding beams of no recycled aggregates. One group is presented in Figure 12, which presents the relation between load and deflection for three beams with recycled aggregate replacements of 50% and different concrete strengths. The three curves were similar, up to 40% of the maximum load. Decreased concrete strength resulted in a lesser load capacity and greater deflection. The results indicated that increasing the strength of concrete results in an increase in shear strength. This result is consistent with the codes’ prediction of the concrete shear strength of beams [23–25]. Using concrete with 35 MPa strength resulted in a 16.6% increase ratio. Meanwhile, the utilization of concrete with 40 MPa strength increased by 23.1% compared with the specimens with concrete with 25 MPa strength. A slight decrease in shear strength was observed when concrete with 35 MPa strength was used compared with that with 40 MPa strength (Fig. 12). The specimens with 35 MPa strength recorded an average decrease of only 6.3%. Meanwhile, the specimens with 40 MPa strength recorded an average decrease of only 6.6% compared with other specimens without RCA.

Load–deflection relationships for beams with different concrete strengths
The beams of the FE runs are grouped based on the bottom reinforcement and compressive strength of the corresponding concrete beam of normal aggregates. Each group contains five beams with five different recycled aggregate replacements (0%, 25%, 50%, 75%, and 100%). The load-deflection relationships for beams with bottom reinforcement of two bars with 16 mm diameter and 25 MPa concrete strength for the corresponding normal aggregate concrete are shown in Figure 13. The effect of the RCA ratio on the flexural capacity is limited because the flexural capacity is mainly affected by the reinforcement rebars. This result can be attributed to the behavior of the under-reinforced beams being governed by the reinforcement ratio rather than the properties of the concrete [55]. Almost all the curves are similar at all stages. Replacing 25%, 50%, 75%, and 100% of the NA with the RCA resulted in a reduction in the flexural capacity of only averages of 1.1%, 1.4%, 1.8%, and 3.3%, respectively, for all different concrete strengths (i.e., 25, 35, and 40 MPa) and the 18 mm rebar diameter compared with the specimens without RCA. In addition, the same pattern was observed in the use of 16 mm rebar diameter, which resulted in a decrease in the flexural capacity with averages of 0.9%, 1.3%, 0.9%, and 3.3% for specimens with replacement levels of 25%, 50%, 75%, and 100%, respectively, with all different concrete strengths (i.e., 25, 35, and 40 MPa) compared with the specimens without RCA. Moreover, replacing 25%, 50%, 75%, and 100% of the NA with the RCA resulted in a reduction in the flexural capacity of only averages of 1.1%, 1.8%, 1.9%, and 3.1%, respectively, for all different concrete strengths (i.e., 25, 35, and 40 MPa) and for 14 mm rebar diameter compared with the specimens without RCA. The investigation results in this study are consistent with those of previous studies, wherein the authors reported that the failure mode and crack pattern in the specimens with RCA are similar to those without RCA, regardless of the RCA content [14, 42]. The results indicated that increasing the strength of the concrete slightly increased the flexural capacity, as shown in Figure 14. Concerning the use of 18 mm rebar diameter, the utilization of concrete with 35 MPa strength exhibited a 4.8% increase ratio. In contrast, using concrete with a 40 MPa strength resulted in a 6.4% increase compared with the specimens with concrete with 25 MPa strength. The same pattern was observed when a 16 mm rebar diameter was utilized, resulting in an increase in the flexural capacities of 4.5% and 6.4% for specimens with concrete with 35 MPa strength and concrete with 40 MPa strength, respectively, compared with the specimens with concrete with 25 MPa strength. Moreover, using 14 mm rebar diameter with concrete with 35 MPa strength exhibited a 5.3% increase ratio. Meanwhile, using concrete with 40 MPa strength resulted in a 7.5% increase compared with the specimens with 25 MPa strength. Using 18 mm of rebar diameter exhibited an average 46.1% increase ratio. Meanwhile, the use of 16 mm rebar diameter resulted in an average of 21.6% increase for all different concrete strengths (i.e., 25, 35, and 40 MPa) compared with the specimens with 14 mm rebar diameter, as shown in Figure 15.

Load–deflection relationships for beams with different RCA ratios
Load–deflection relationships for beams with different concrete strengths

Load–deflection relationships for beams with different reinforcement rebars
The failure shear loads for the 15 FE runs using ABAQUS and 25 tests collected from literature are recorded and compared with those calculated from the ACI318-19 [23], SBC304-18 [24], and ECP203-2020 [25] codes. Figures 16 and 17 present the relationships between the ratios of shear from the test or FE and the shear calculated from the ACI318-19, SBC304-18, or ECP203- 2020 code and the percent of RCA content. The errors obtained when using the three codes for calculating the shear capacity compared with the values from the FE or the tests are recorded. The average error obtained for the beams with RCA is 58% using the ACI318-19 and SBC304-18 codes and 78% utilizing the ECP203-2020. Meanwhile, the average error of the beams without RCA, which is not shown in the figures, is 58% using the ACI318-19 and SBC304-18 and 79% utilizing ECP203-2020. Given that the errors in calculating the shear capacity when using each code for cases of no RCA and with RCA are almost the same, the equations for calculating the shear capacity in the three codes can still be used for concrete with RCA replacements. The shown trend lines in the two figures indicate that the errors decrease with the RCA replacement, indicating less conservatism for the three codes as the ratio of RCA becomes larger.

Relationship between the ratio of shear from test or FE to shear from the ACI318-19 and SBC304-18 codes and percent of RCA

Relationship between the ratio of shear from the test or FE to shear from the ECP203-2020 codes and the percent of RCA
The maximum moment capacities were obtained for the 45 FE runs using ABAQUS, and 49 experiments were collected from the literature. These maximum moment capacities were compared with the flexural capacities obtained from the ACI318-19 [23], SBC304- 18 [24], and ECP203-2020 [25] codes. The relationships between the ratios of moment capacity from the test or FE to the moment capacity calculated from ACI318-19, SBC304-18, or ECP203-2020 and the percent of RCA content are shown in Figures 18 and 19, respectively. The errors obtained when using the three codes for calculating the flexural capacity were compared with the values from the tests and FE. The average error obtained for the beams with RCA is 27% using the ACI318-19 and SBC304-18 codes and 26% using the ECP203-2020 code. Meanwhile, the average error of the beams without RCA, which is not shown in the figures, is 21% using the ACI318-19 and SBC304-18 codes and 21% utilizing the ECP203-2020 codes. Given that the errors in the calculated flexural capacities when using the three codes for the two cases of no RCA and with RCA were almost the same, the bending capacity calculations in the three codes can still be used for concrete with RCA replacements. The trend lines shown in the two figures indicated that the errors become smaller, suggesting a reduction in the conservatism of the three codes with the increase in the ratio of RCA.

Relationship between the ratio of moment capacity from the test or FE to moment capacity from the ACI318-19 and SBC304-18 codes and the percent of RCA

Relationship between the ratio of moment capacity from the test or FE to moment capacity from the ECP203-2020 codes and the percent of RCA
This study investigates the shear and flexural behavior of beams containing RCA using FE simulations with the ABAQUS program. The FE models are validated using previous experimental tests. The finite element parametric study results are added to the existing experimental data reported in the literature and used together to verify the code’s provisions for shear and flexure capacity. The conclusions of the study are as follows:
The results from the FE models are consistent with the experimental results for RC beams that fail in shear and flexure. The tested beams’ results could be accurately and numerically predicted using a nonlinear FE model developed using ABAQUS.
The shear strength of the RC beam increases with the increase in the compressive strength from 25 MPa to 40 MPa. This result is consistent with the codes’ prediction of the concrete shear strength of beams. The use of concrete with 35 and 40 MPa strength exhibited a 16.6% and 23.1% increase ratio, respectively, compared with the specimens with 25 MPa strength concrete.
The maximum load of shear beams decreases with the increase in the RCA level, and the deflection increases. Meanwhile, the decrease in the concrete strength results in lesser capacity and greater deflection. The reduction in shear strength is an average of 4.1%, 5.5%, 8.2%, and 10.1% for specimens with replacement levels of 25%, 50%, 75%, and 100%, respectively, compared with the specimens without RCA.
The effect of the RCA level on the flexural capacity of the flexure beams is limited because the flexural capacity is mainly affected by the reinforcement. The specimens with RCA showed a slight reduction of up to 3.3% when using 16 and 18 mm of rebar diameters, while it was 3.1% when using 14 mm of rebar diameters compared with the specimens without RCA.
The work performed in this research proves that the shear strength capacity decreases with an increase in the RCA ratio, while the effect of using RCA on the flexural capacity is limited.
The available equations in the ACI318- 19, SBC304-18, and ECP203-2020 codes can still be used for calculating the shear and flexural capacities of beams containing RCA—however, the increase in the RCA results in less conservative equations.
The authors suggest that additional investigation is necessary to develop novel approaches for improving the design code provisions for shear and flexure capacity. Additionally, a wider range of concrete strengths should be investigated, together with examining sources of recycled aggregate, to assess their effect on the different design code provisions.