![Synthesis of [2-(3,4-epoxycyclohexyl) ethyl] triphenylsilane and study on its amine curing properties Cover](https://paradigm-files.s3.eu-central-1.amazonaws.com/MSP/cover-image.jpg)
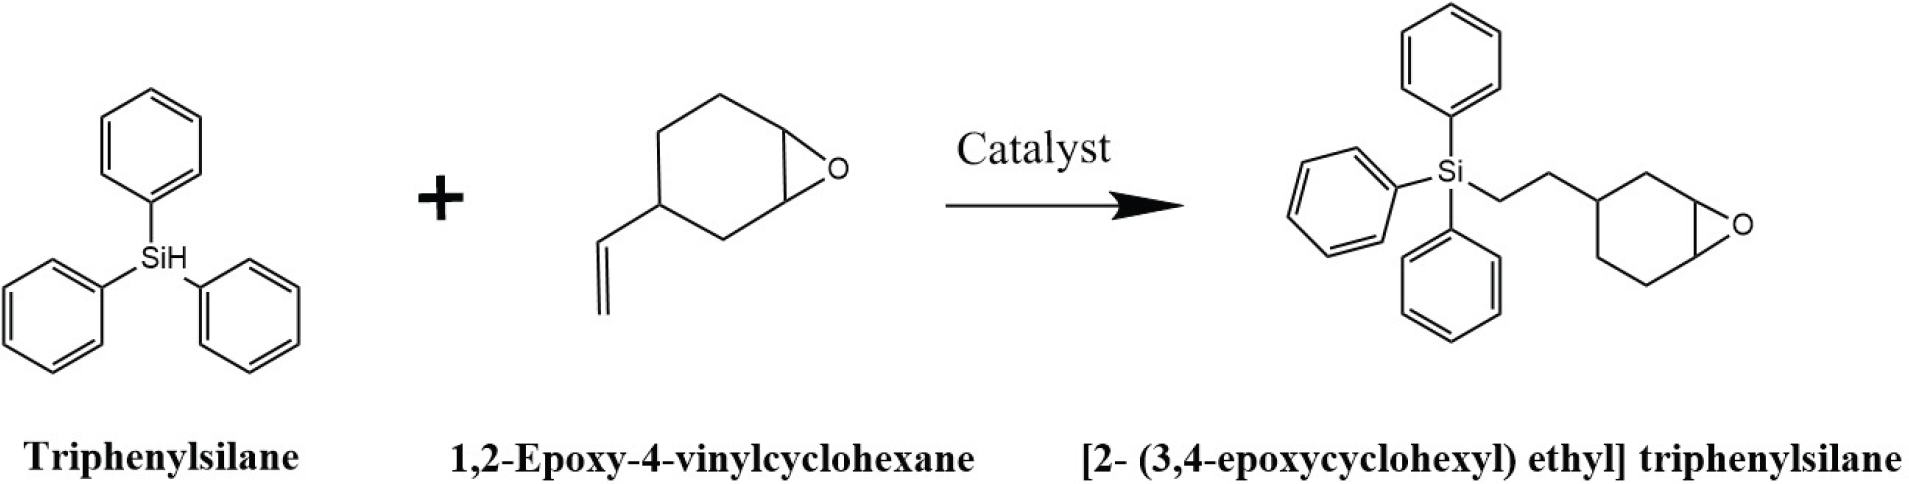
Fig. 1.
Synthesis route of [2-(3,4-epoxycyclohexyl) ethyl] triphenylsilane
Table 1.
ECETPS yields based on different ratios
| Numbering | TPS:ECV | ECETPS |
|---|---|---|
| 1 | 1:1.10 | 81.58% |
| 2 | 1:1.15 | 83.70% |
| 3 | 1:1.20 | 92.24% |
| 4 | 1:1.25 | 92.34% |
| 5 | 1:1.30 | 92.61% |
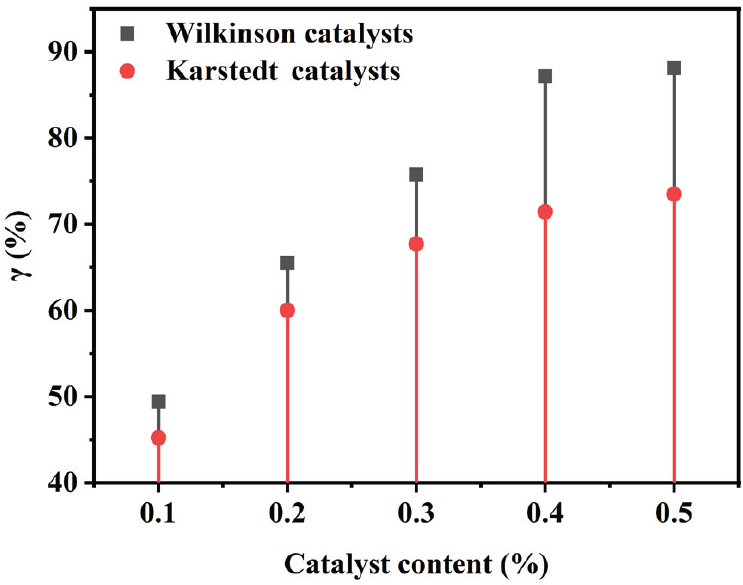
Fig. 2.
Effect of different catalysts and their contents on the yield of ECETPS
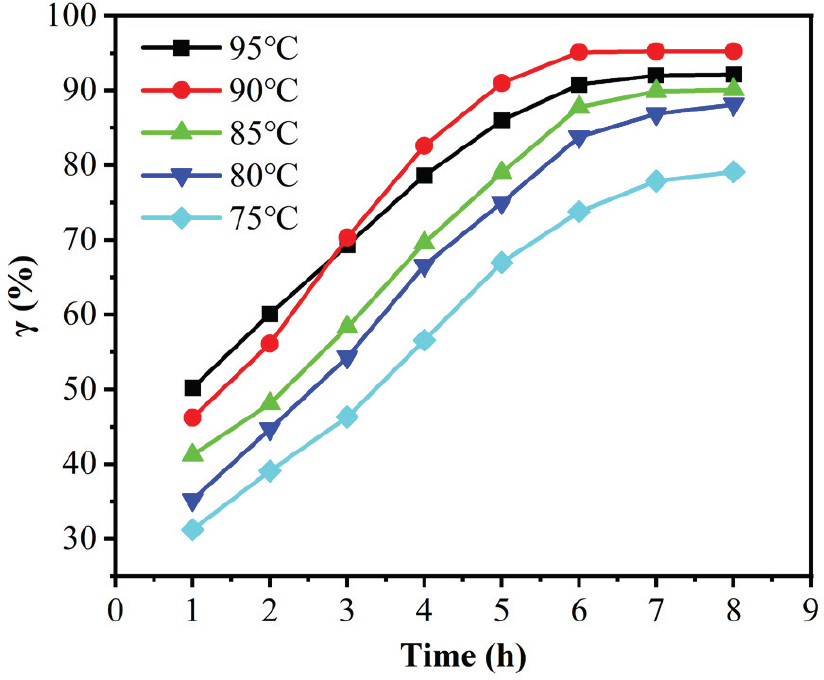
Fig. 3.
Effect of different reaction times and temperatures on the yield of ECETPS
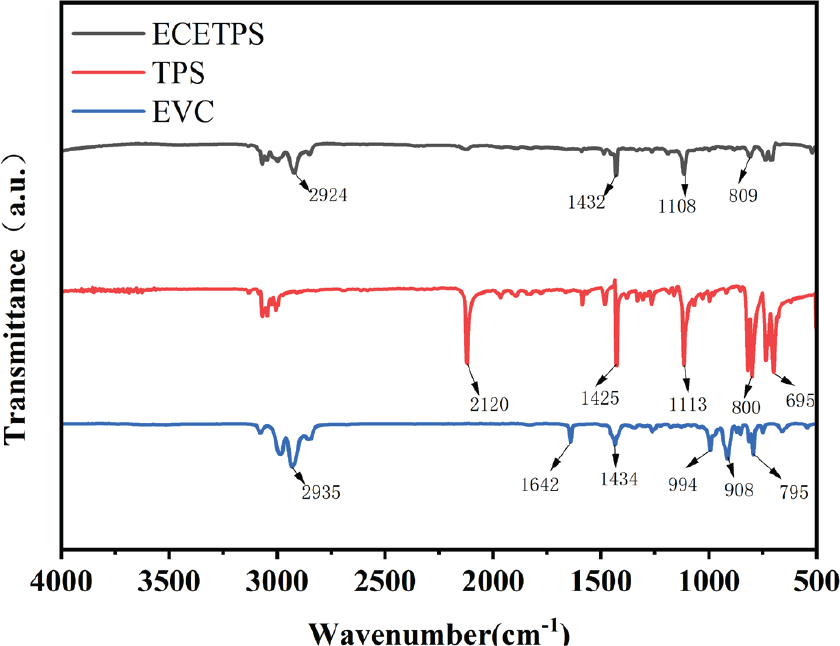
Fig. 4.
FTIR spectra of triphenylsilane, 1,2-epoxy-4-vinylcyclohexane, [2-(3,4-epoxycyclohexyl) ethyl] triphenylsilane
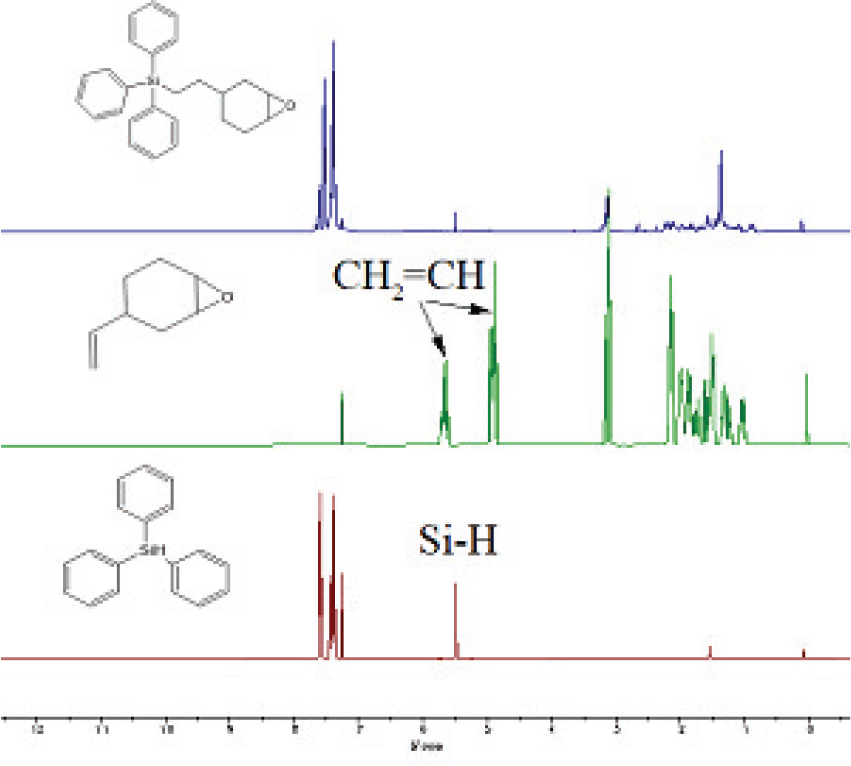
Fig. 5.
1H -NMR hydrogen spectra of TPS, ECV, [2-(3,4-epoxycyclohexyl) ethyl] triphenylsilane
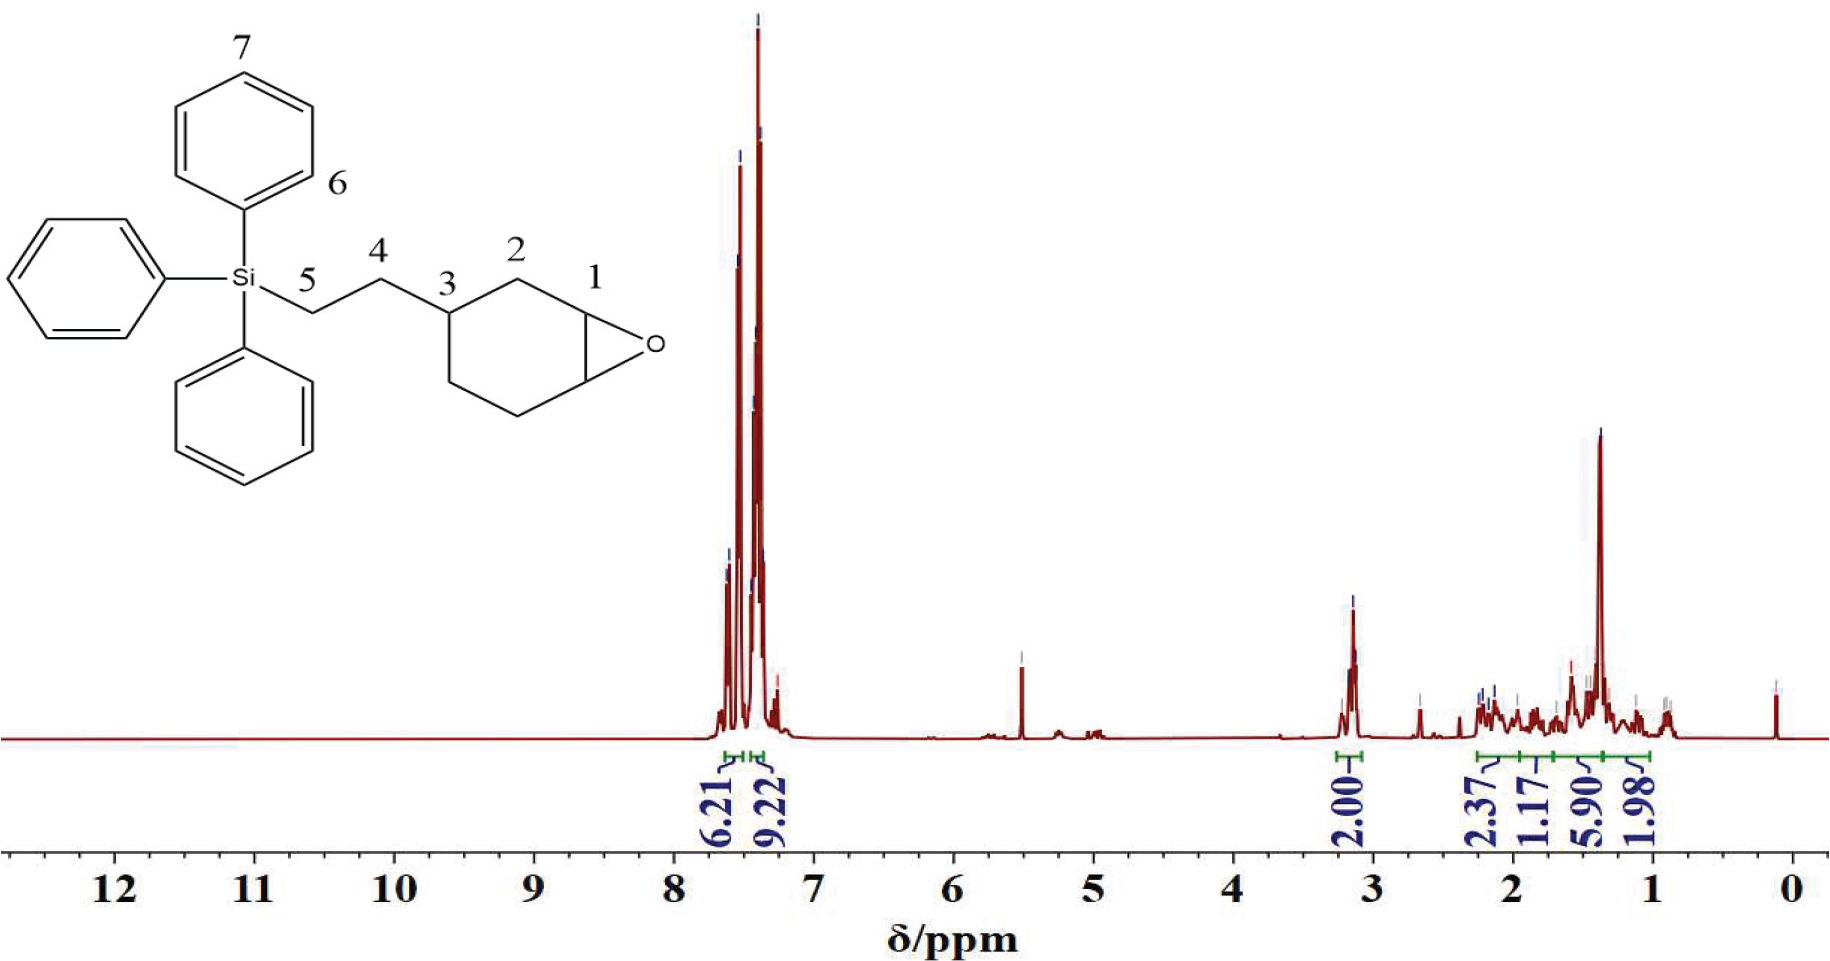
Fig. 6.
1H-NMR pattern of [2-(3,4-epoxycyclohexyl)ethyl] triphenylsilane
Table 2.
1H-NMR spectral analysis of ECETPS
| Location of H | Chemical shift/ (δ/ppm) | Integral ratio | Structural formula |
|---|---|---|---|
| 1 | 3.15 | 2.00 | 2H -O-CH- |
| 2 | 1.40~1.70 | 5.90 | 6H-CH-CH2-CH- |
| 3 | 1.72 | 1.17 | 1H -CH- |
| 4 | 1.17 | 1.98 | 2H C-CH2-CH2- |
| 5 | 2.24 | 2.37 | 2H Si-CH2-CH2- |
| 6 | 7.57 | 6.21 | 6H Si-C-CH- |
| 7 | 7.41 | 9.22 | 9H -CH-CH-CH- |
Table 3.
Amine curing ratios
| Numbering | ECETPS:E-51:593 amine |
|---|---|
| ETE-0 | 0.0:8.0:2.0 |
| ETE-1 | 0.8:7.2:2.0 |
| ETE-2 | 1.6:6.4:2.0 |
| ETE-3 | 2.4:5.6:2.0 |
| ETE-4 | 3.2:4.8:2.0 |
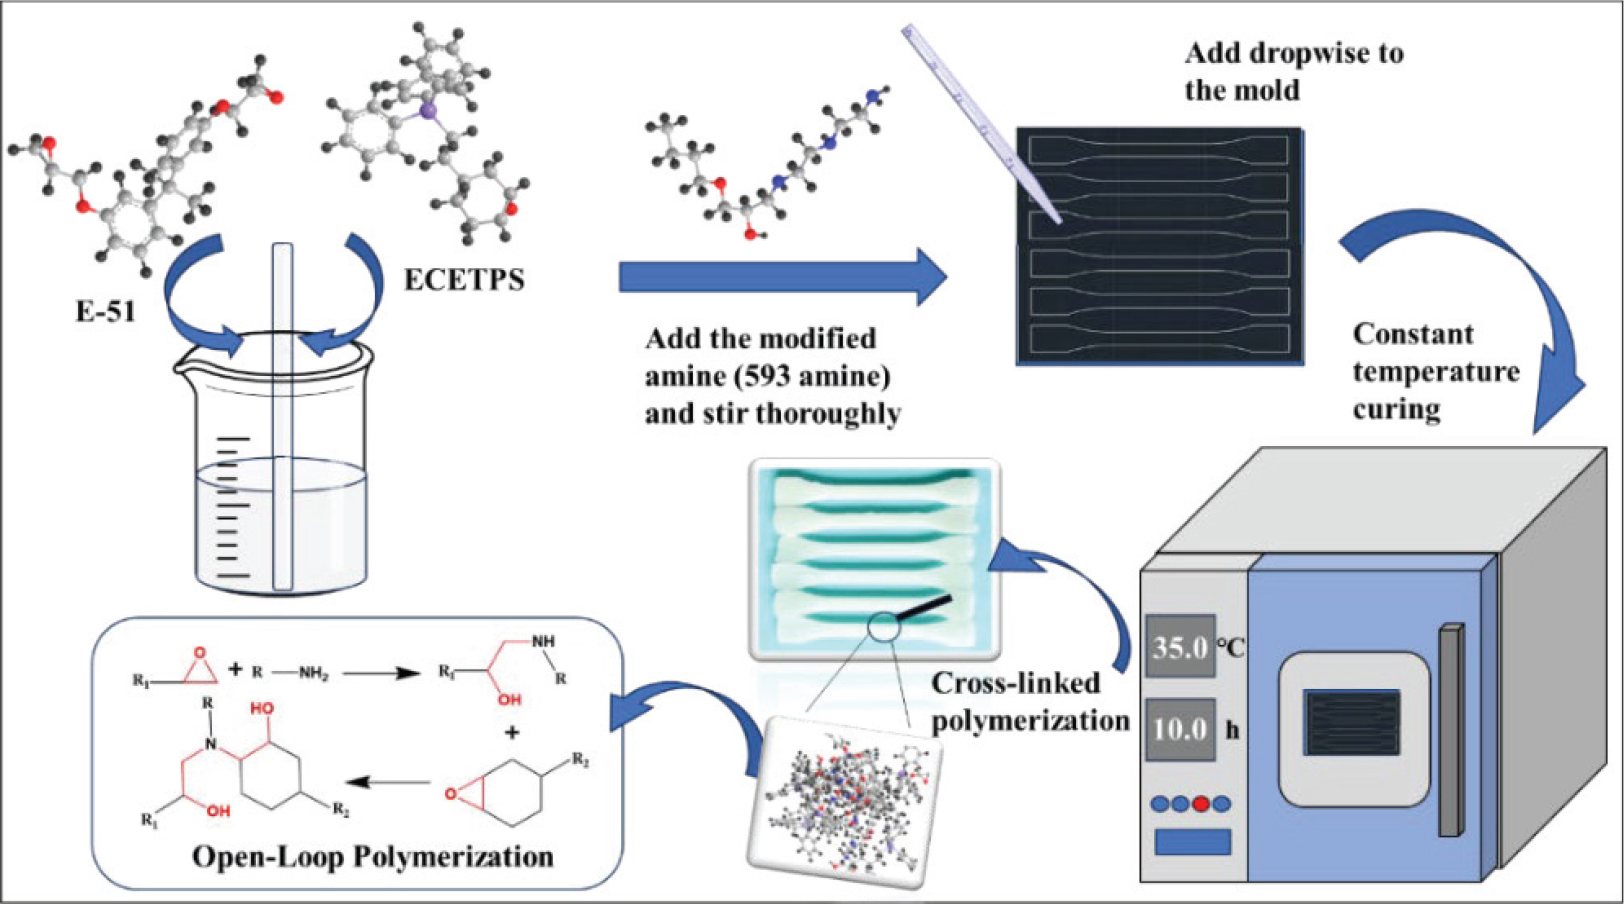
Fig. 7.
Amine curing process diagram. (In the ball-and-stick model: red spheres represent oxygen atoms, gray spheres represent carbon atoms, black spheres represent hydrogen atoms, blue spheres represent nitrogen atoms, and purple spheres represent silicon atoms.)
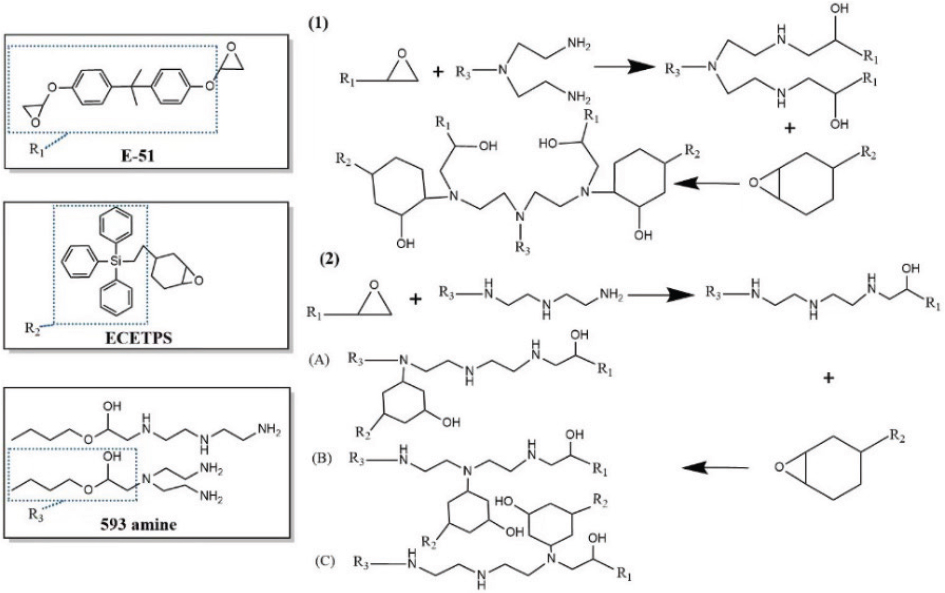
Fig. 8.
Chemical equations involved in amine curing
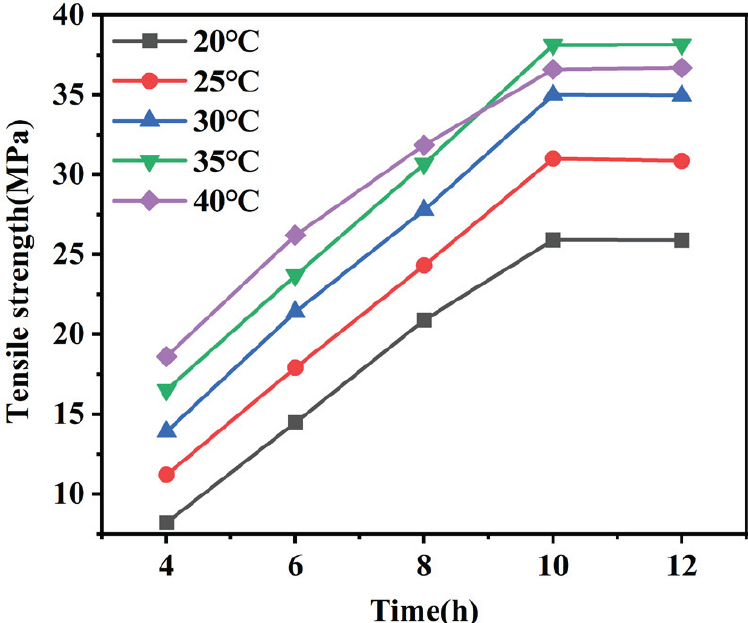
Fig. 9.
Effect of different reaction temperatures and reaction times on tensile strength
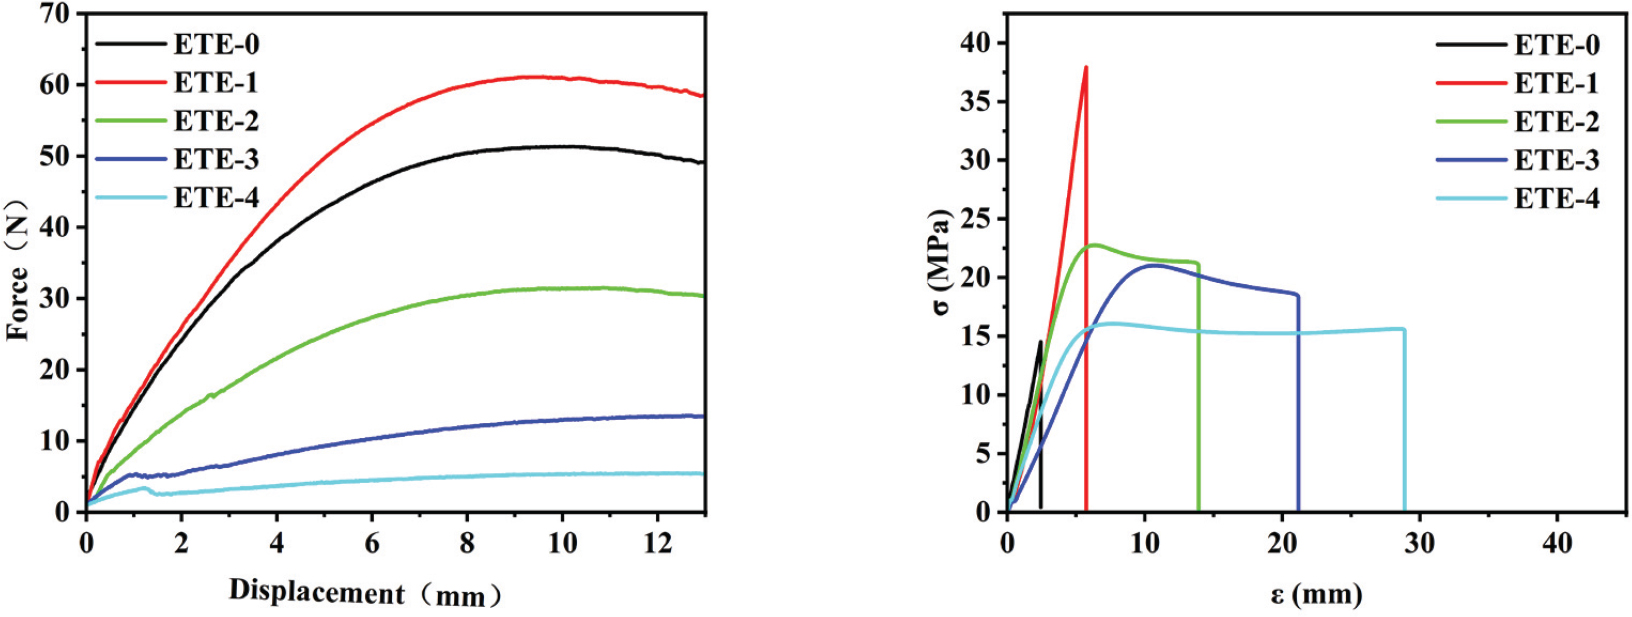
Fig. 10.
The effect of adding different concentrations of ECETPS on mechanical properties. (left: force and displacement curves for bending properties, right: stress and strain curves for tensile properties).
Table 4.
Tensile mechanical property data for cured samples
| Numbering | Elastic modulus (MPa) | Tensile strength (MPa) | Elongation at break (%) |
|---|---|---|---|
| ETE-0 | 505.65 | 14.53 | 2.33 |
| ETE-1 | 581.22 | 37.95 | 4.00 |
| ETE-2 | 443.08 | 22.78 | 12.42 |
| ETE-3 | 384.06 | 20.60 | 19.36 |
| ETE-4 | 290.10 | 16.08 | 26.59 |
Table 5.
Bending mechanical property data for cured samples
| Numbering | Elastic modulus (MPa) | Bending strength (MPa) | Elongation at break (%) |
|---|---|---|---|
| ETE-0 | 1136.65 | 25.38 | 8.31 |
| ETE-1 | 1847.91 | 39.10 | 9.73 |
| ETE-2 | 1342.19 | 20.24 | 8.93 |
| ETE-3 | 573.75 | 8.71 | 8.25 |
| ETE-4 | 239.12 | 3.06 | 7.74 |
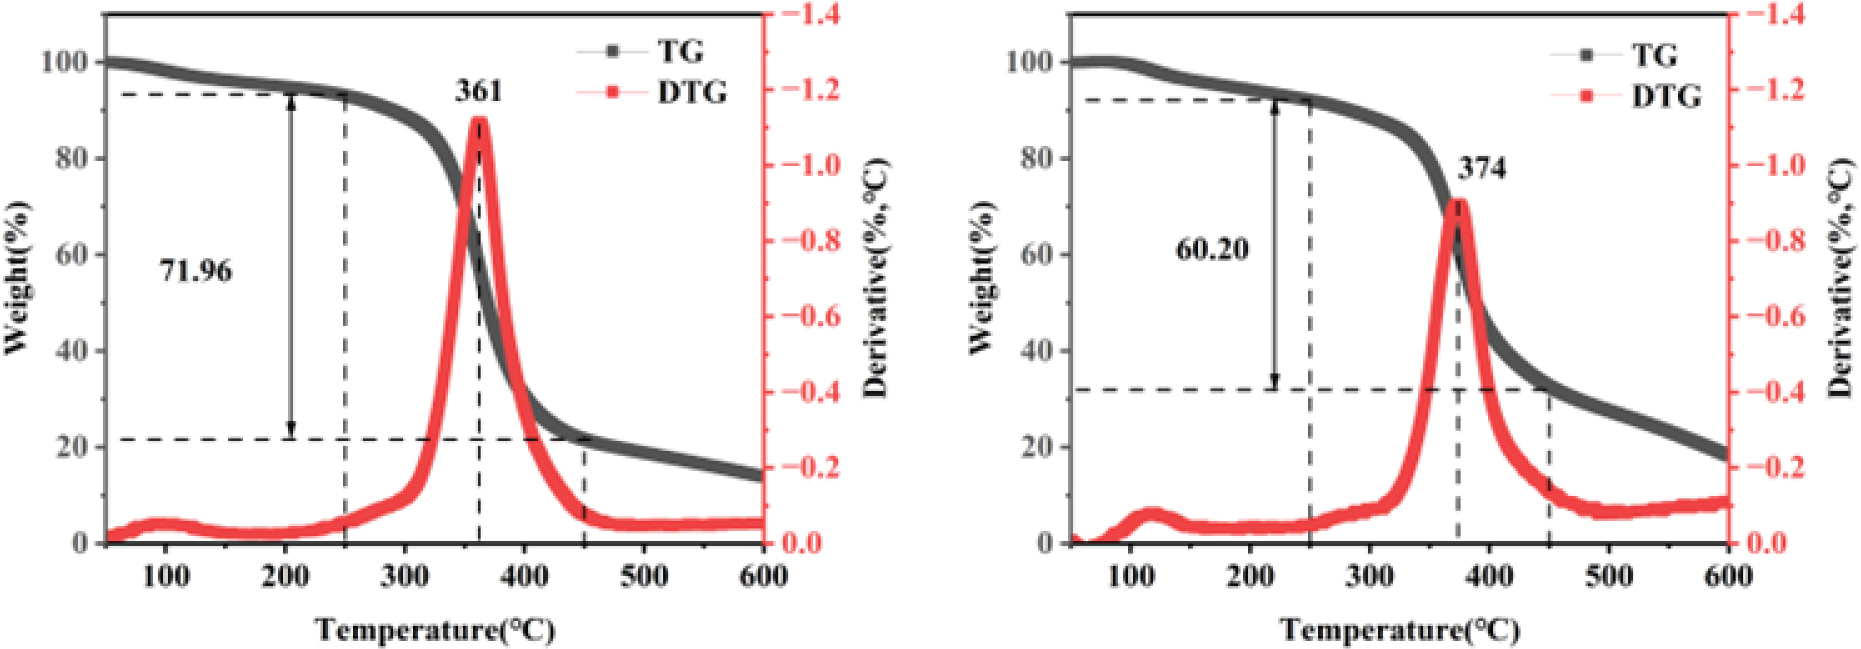
Fig. 11.
TG analysis vs. DTG analysis. (The left graph shows TG vs. DTG without added synthetics, right graph shows TG vs. DTG with added synthetics).