
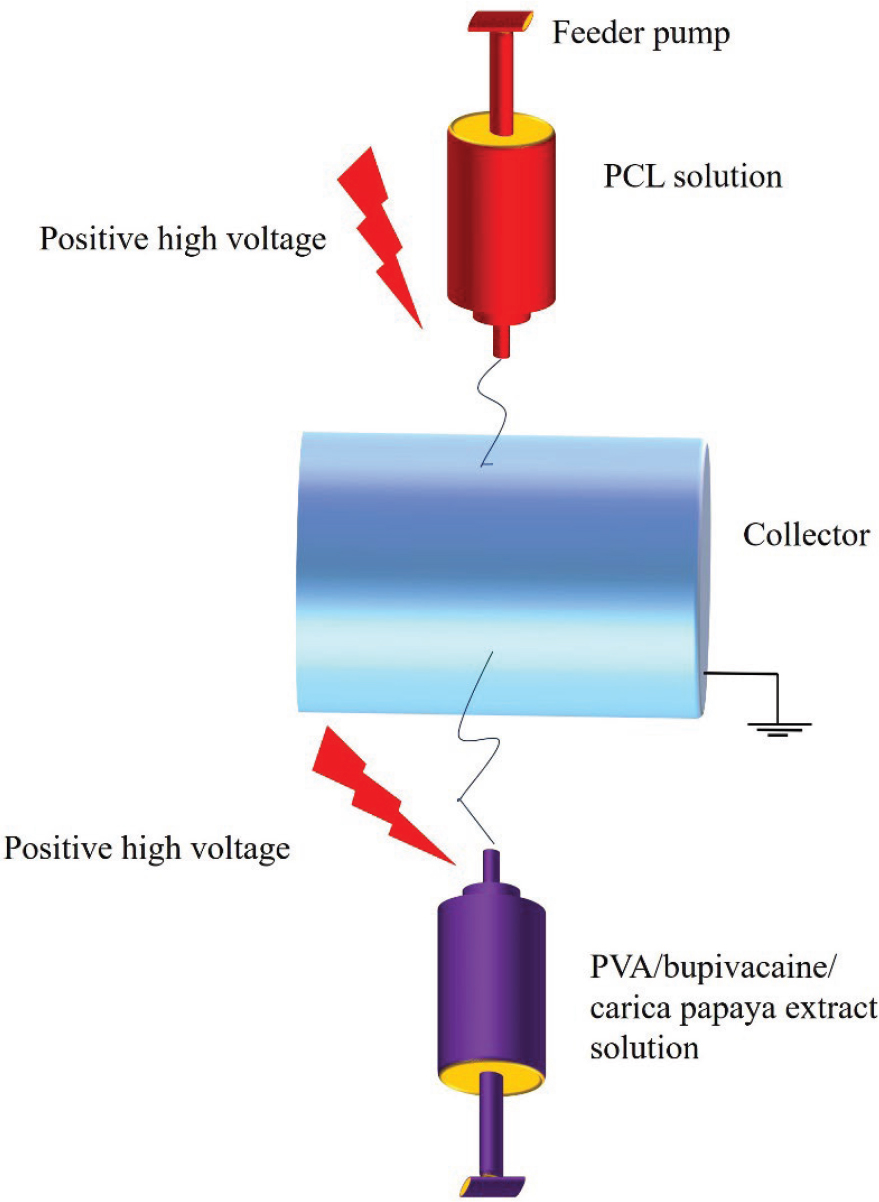
Fig. 1.
Schematic illustration representing the fabrication process of BUPCPEPCLPVA and PCLPVA scaffolds
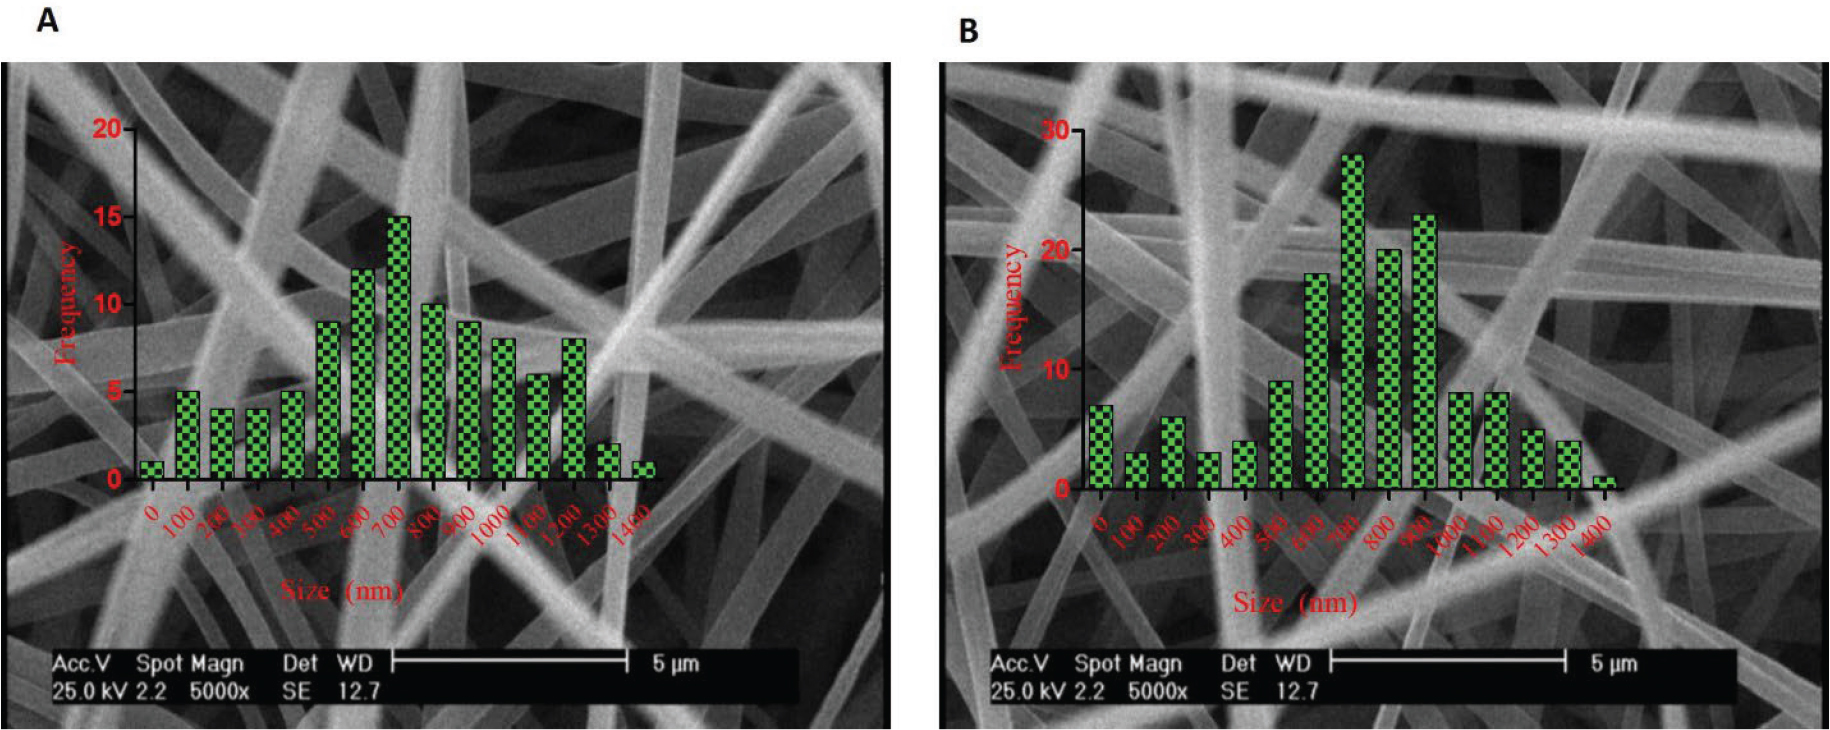
Fig. 2.
SEM images of (A) BUPCPEPCLPVA and (B) PCLPVA
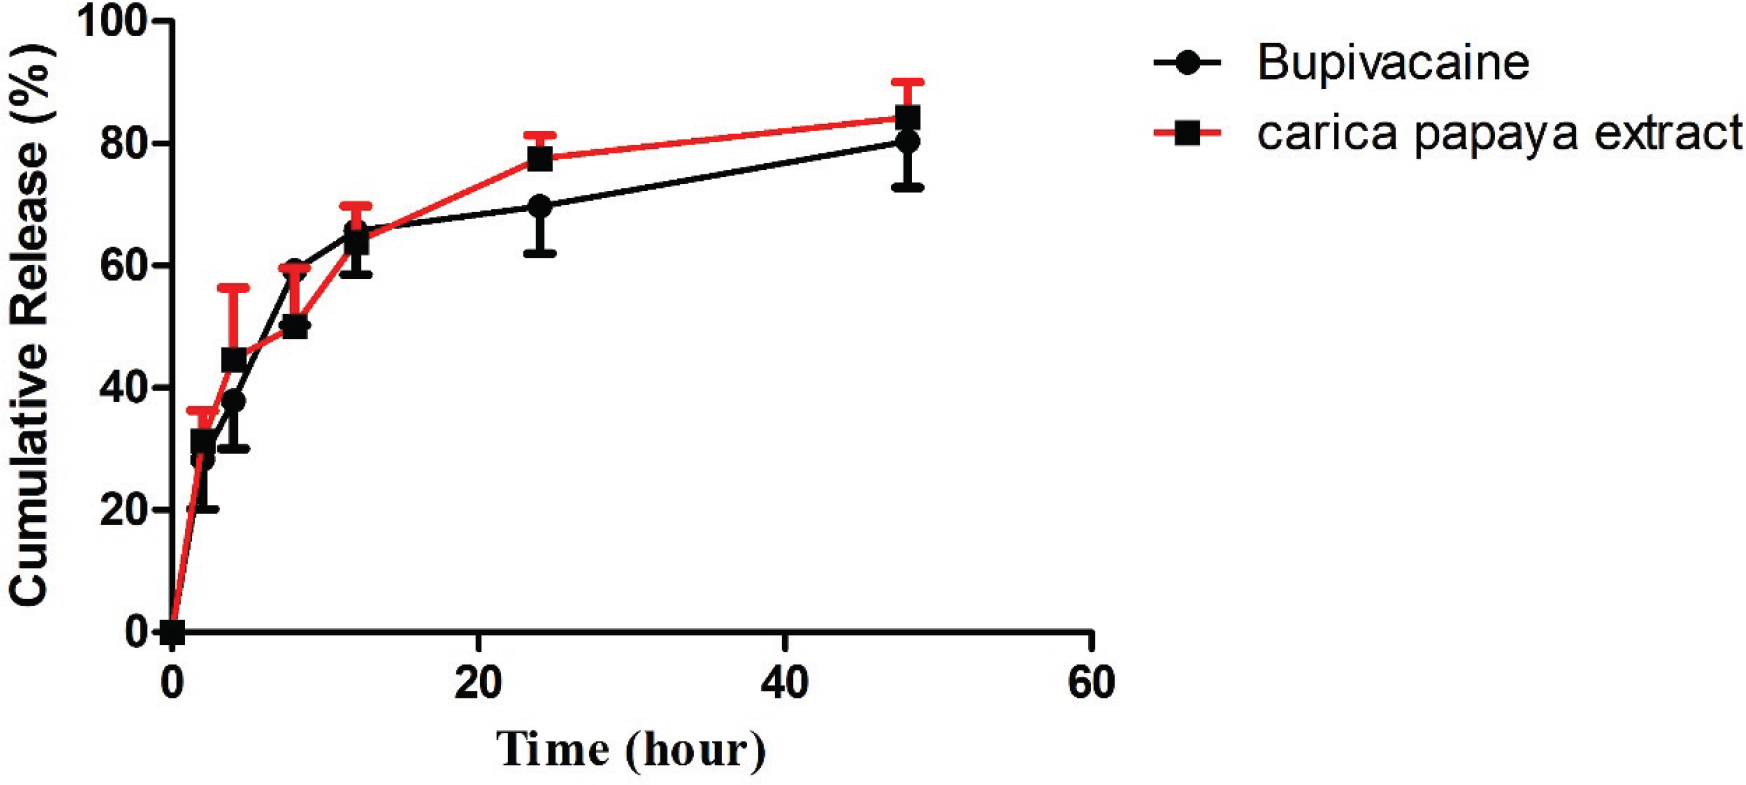
Fig. 3.
Release of bupivacaine and carica papaya extract from the matrix of BUPCPEPCLPVA scaffolds over the course of 48 hour
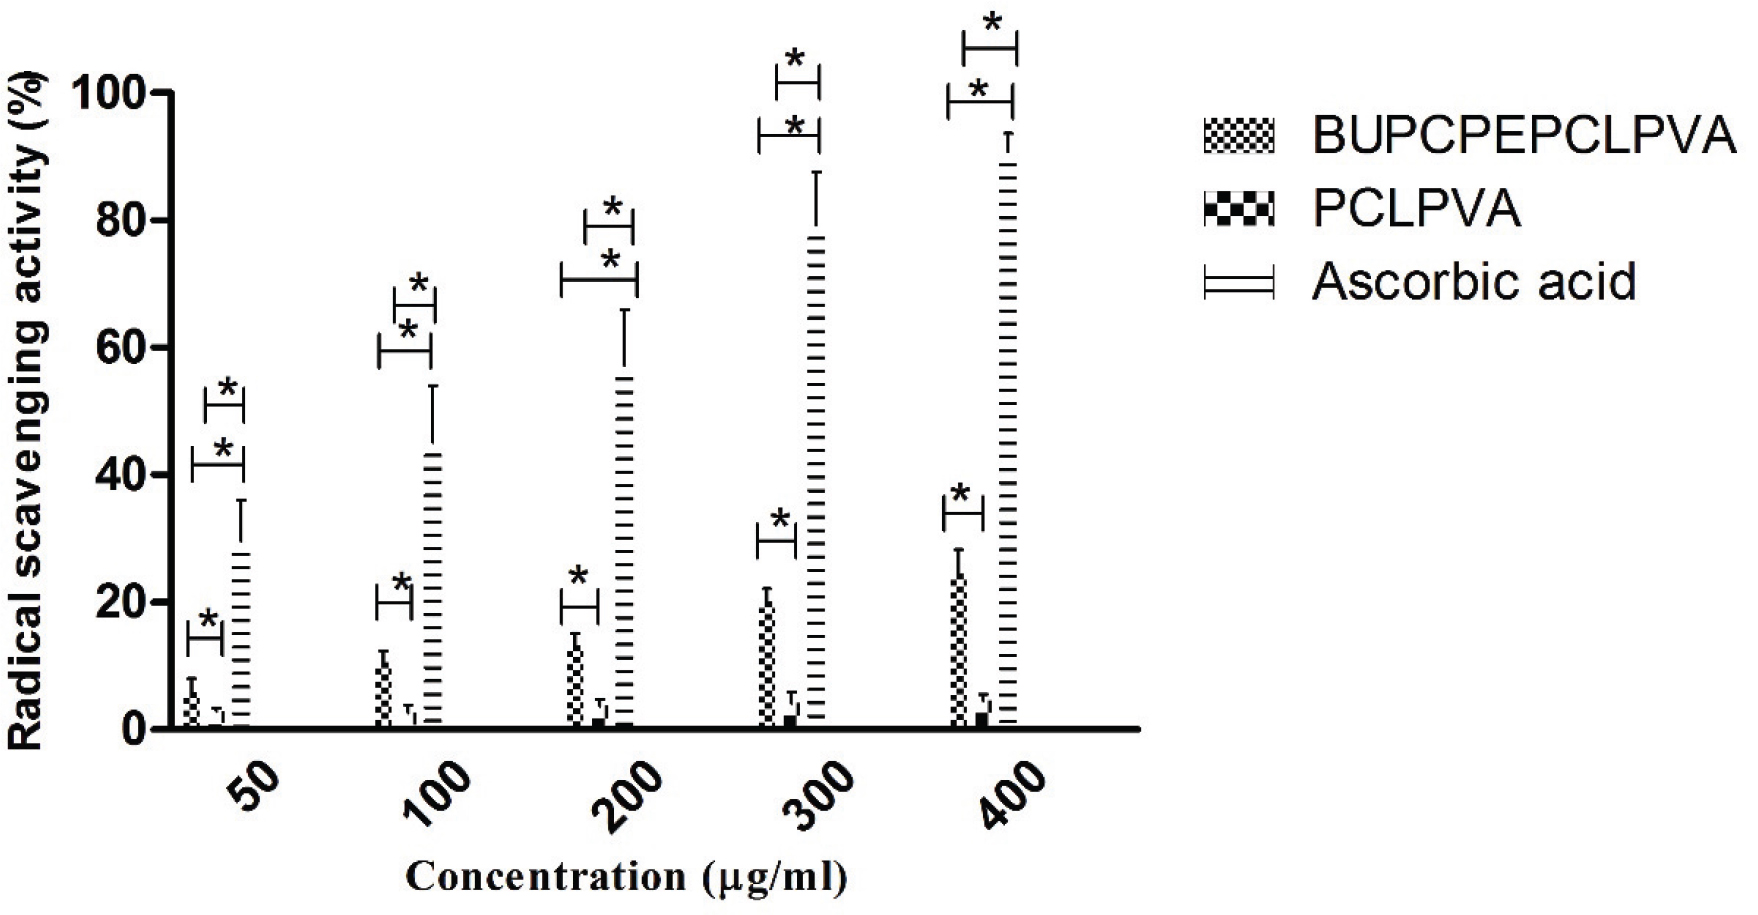
Fig. 4.
Radical scavenging activity of BUPCPEPCLPVA and PCLPVA scaffolds compared with ascorbic acid as the control group, * shows p-value < 0.05
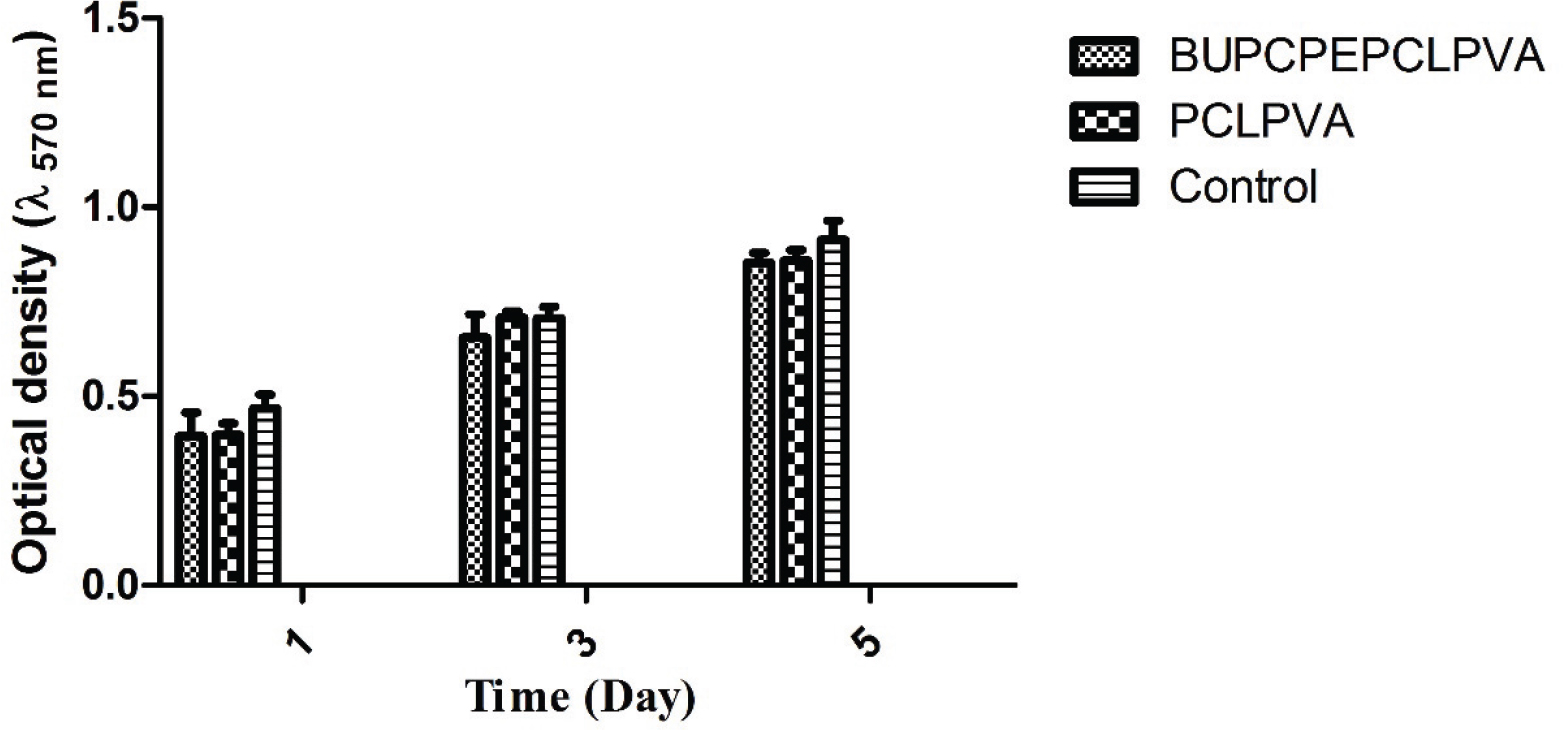
Fig. 5.
MTT assay with L929 cells cultured on BUPCPEPCLPVA and PCLPVA scaffolds compared with the cells cultured on tissue culture plate as the control group
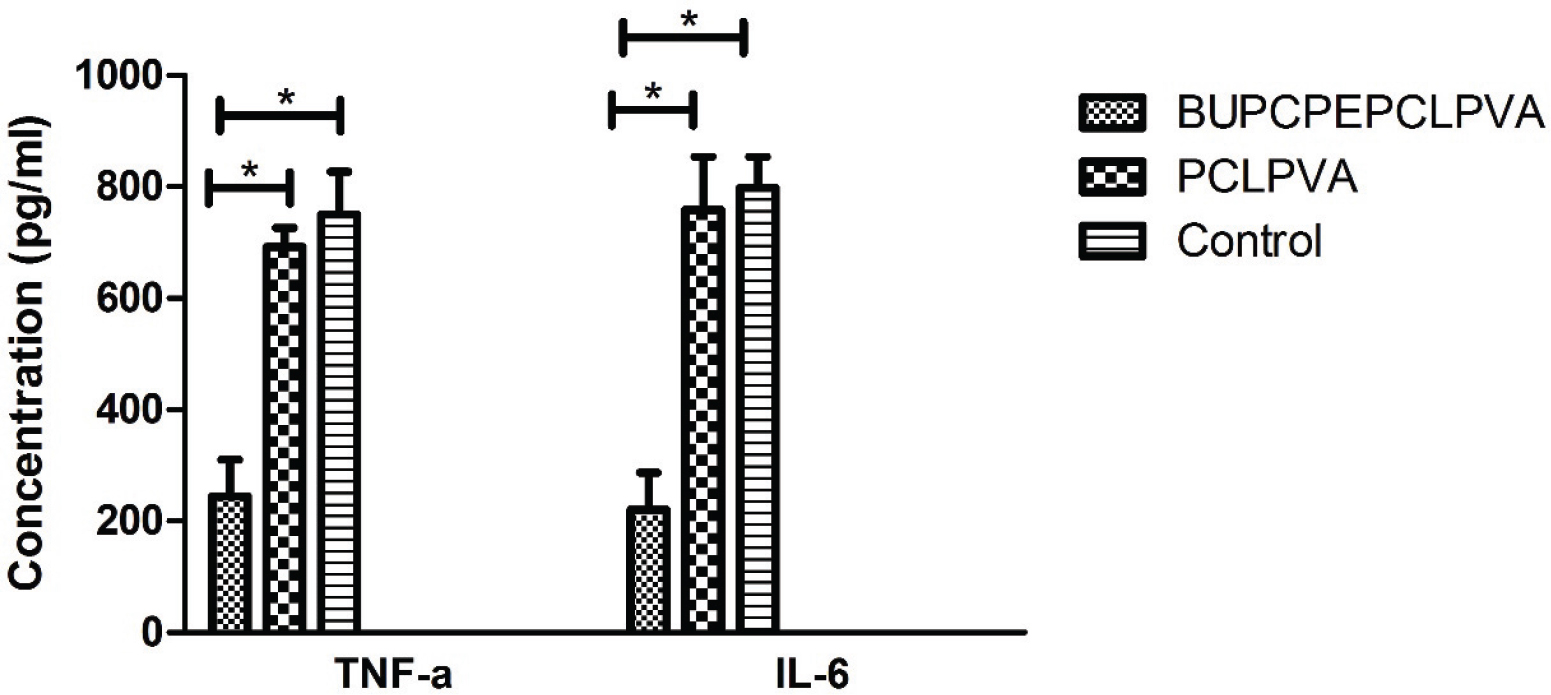
Fig. 6.
Concentrations of TNF-a and IL-6 in the supernatant of RAW 264.7 murine macrophage cells cultured on BUPCPEPCLPVA and PCLPVA scaffolds, * shows p-value < 0.05
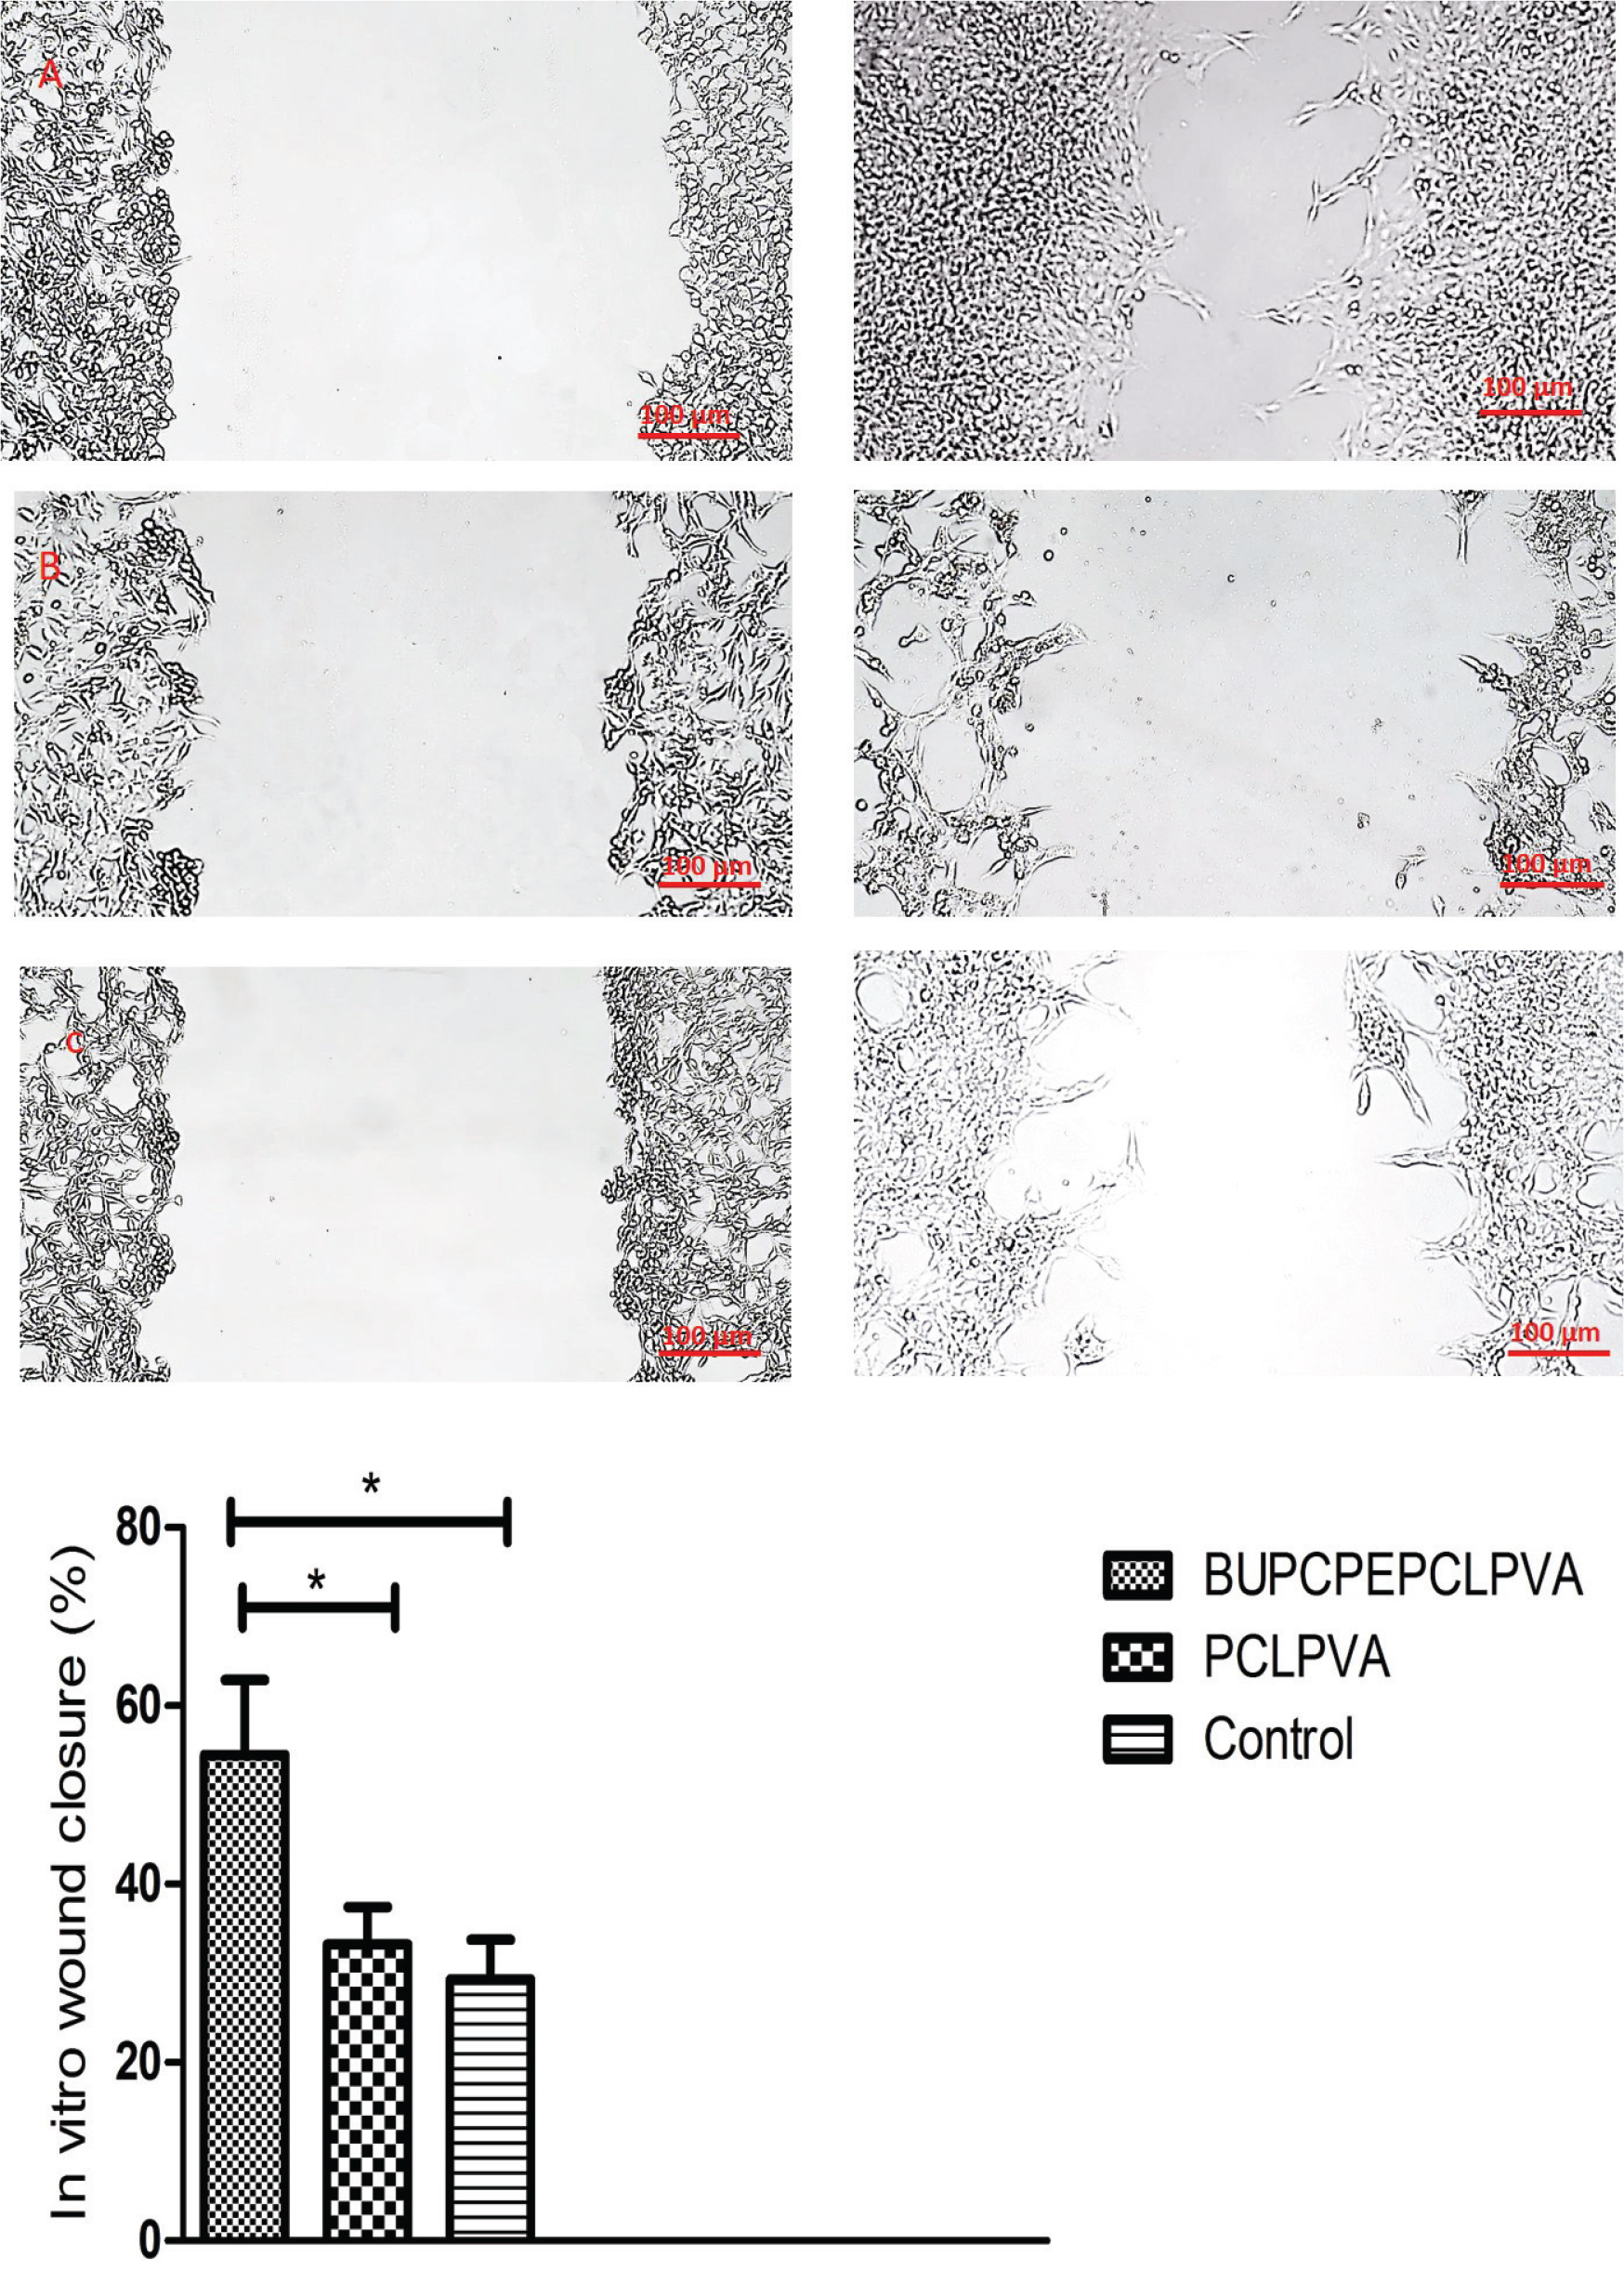
Fig. 7.
In vitro wound closure assessment with L929 cells cultured with (A) BUPCPEPCLPVA scaffolds extract, (B) PCLPVA scaffolds’ extract, (C) normal culture media as the control group, * shows p-value < 0.05
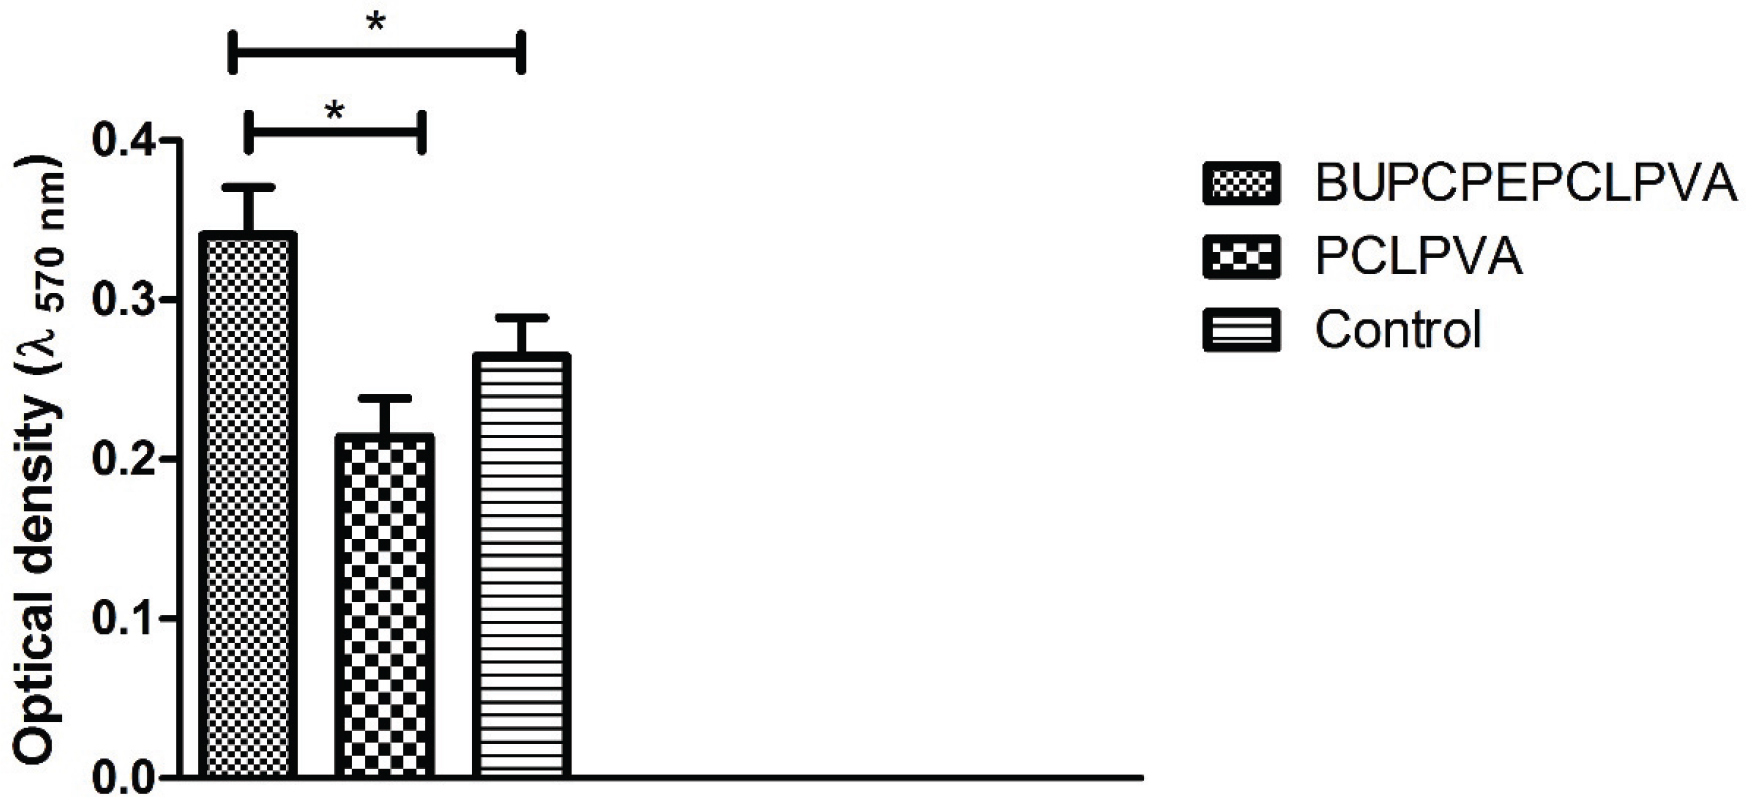
Fig. 8.
MTT assay with L929 fibroblast cells cultured with the extract of BUPCPEPCLPVA and PCLPVA scaffolds under oxidative stress induced by 1% H2O2, * shows p-value < 0.05
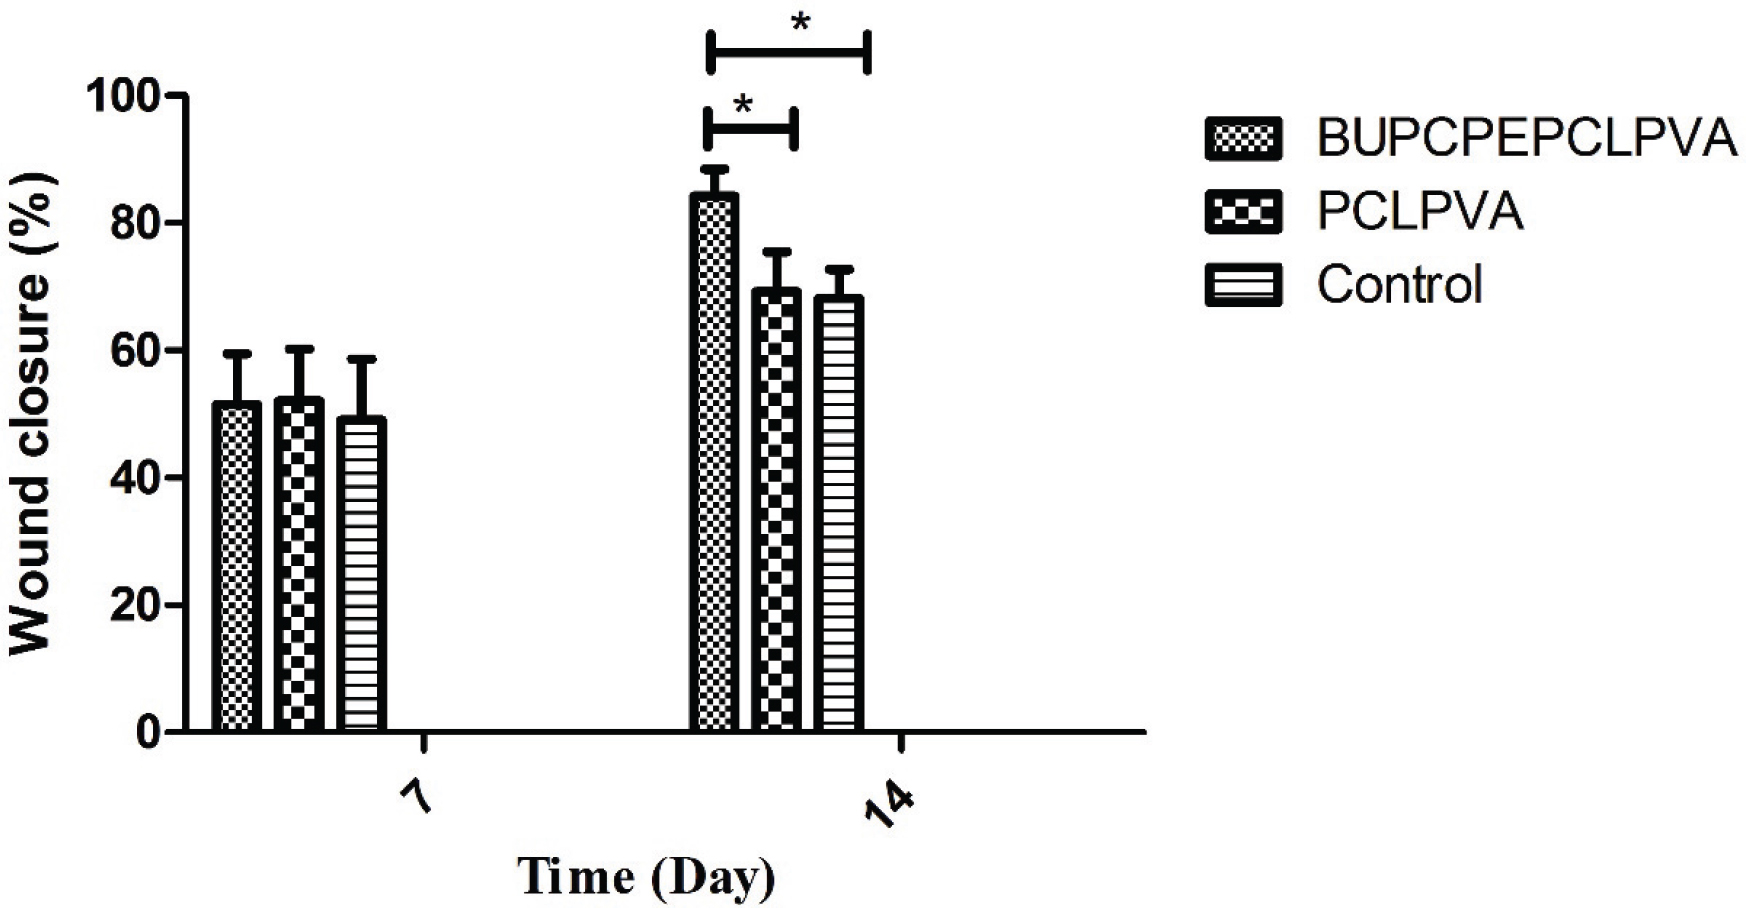
Fig. 9.
Wound closure study of wounds treated with BUPCPEPCLPVA and PCLPVA wound dressings on days 7 and 14 after wounding, * shows p-value < 0.05
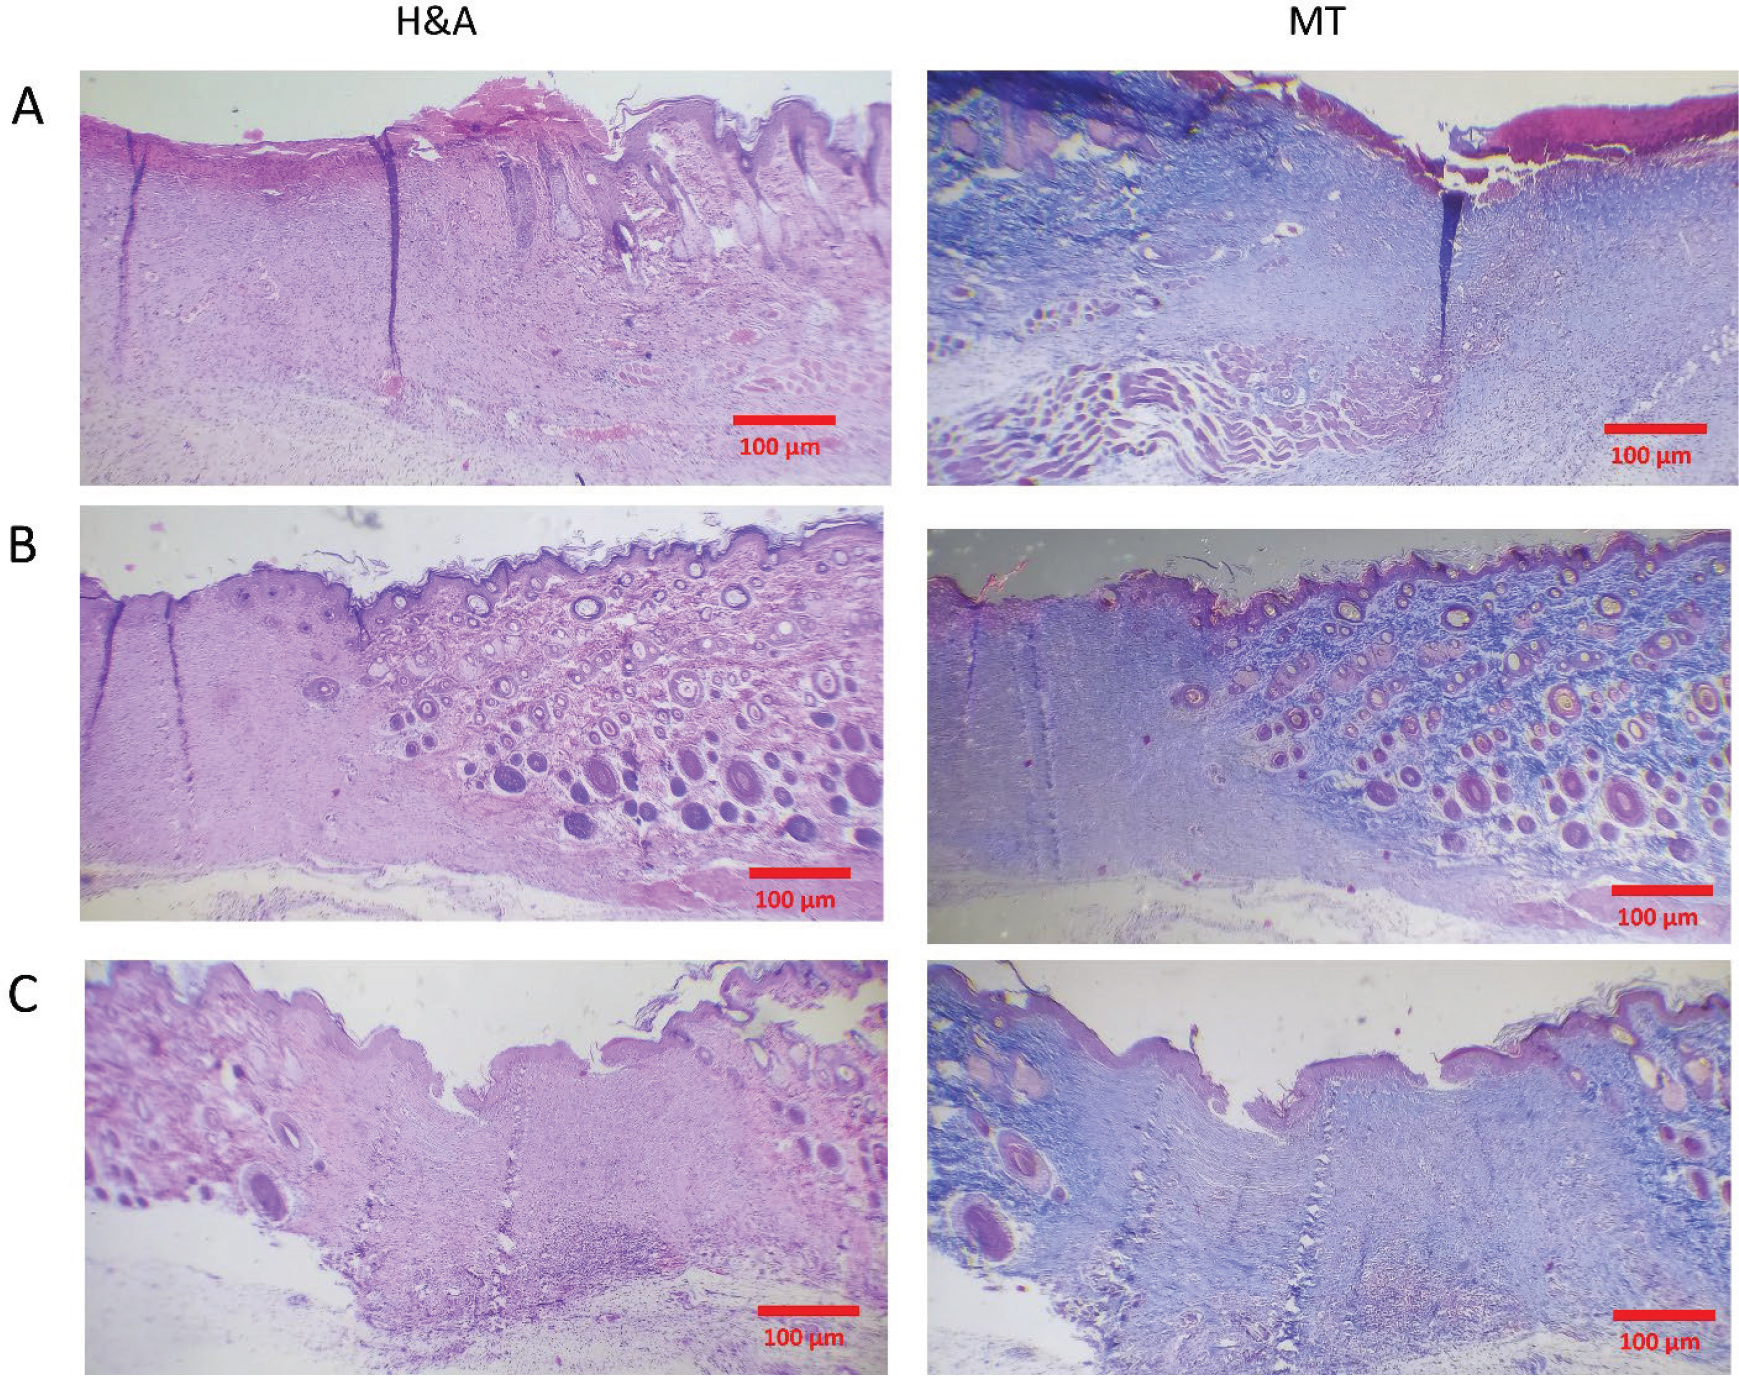
Fig. 10.
Hematoxylin and Eosin (H&E) and Masson’s Trichrome (MT) staining images of wounds treated with (A) BUPCPEPCLPVA, (B) PCLPVA, and (C) control groups
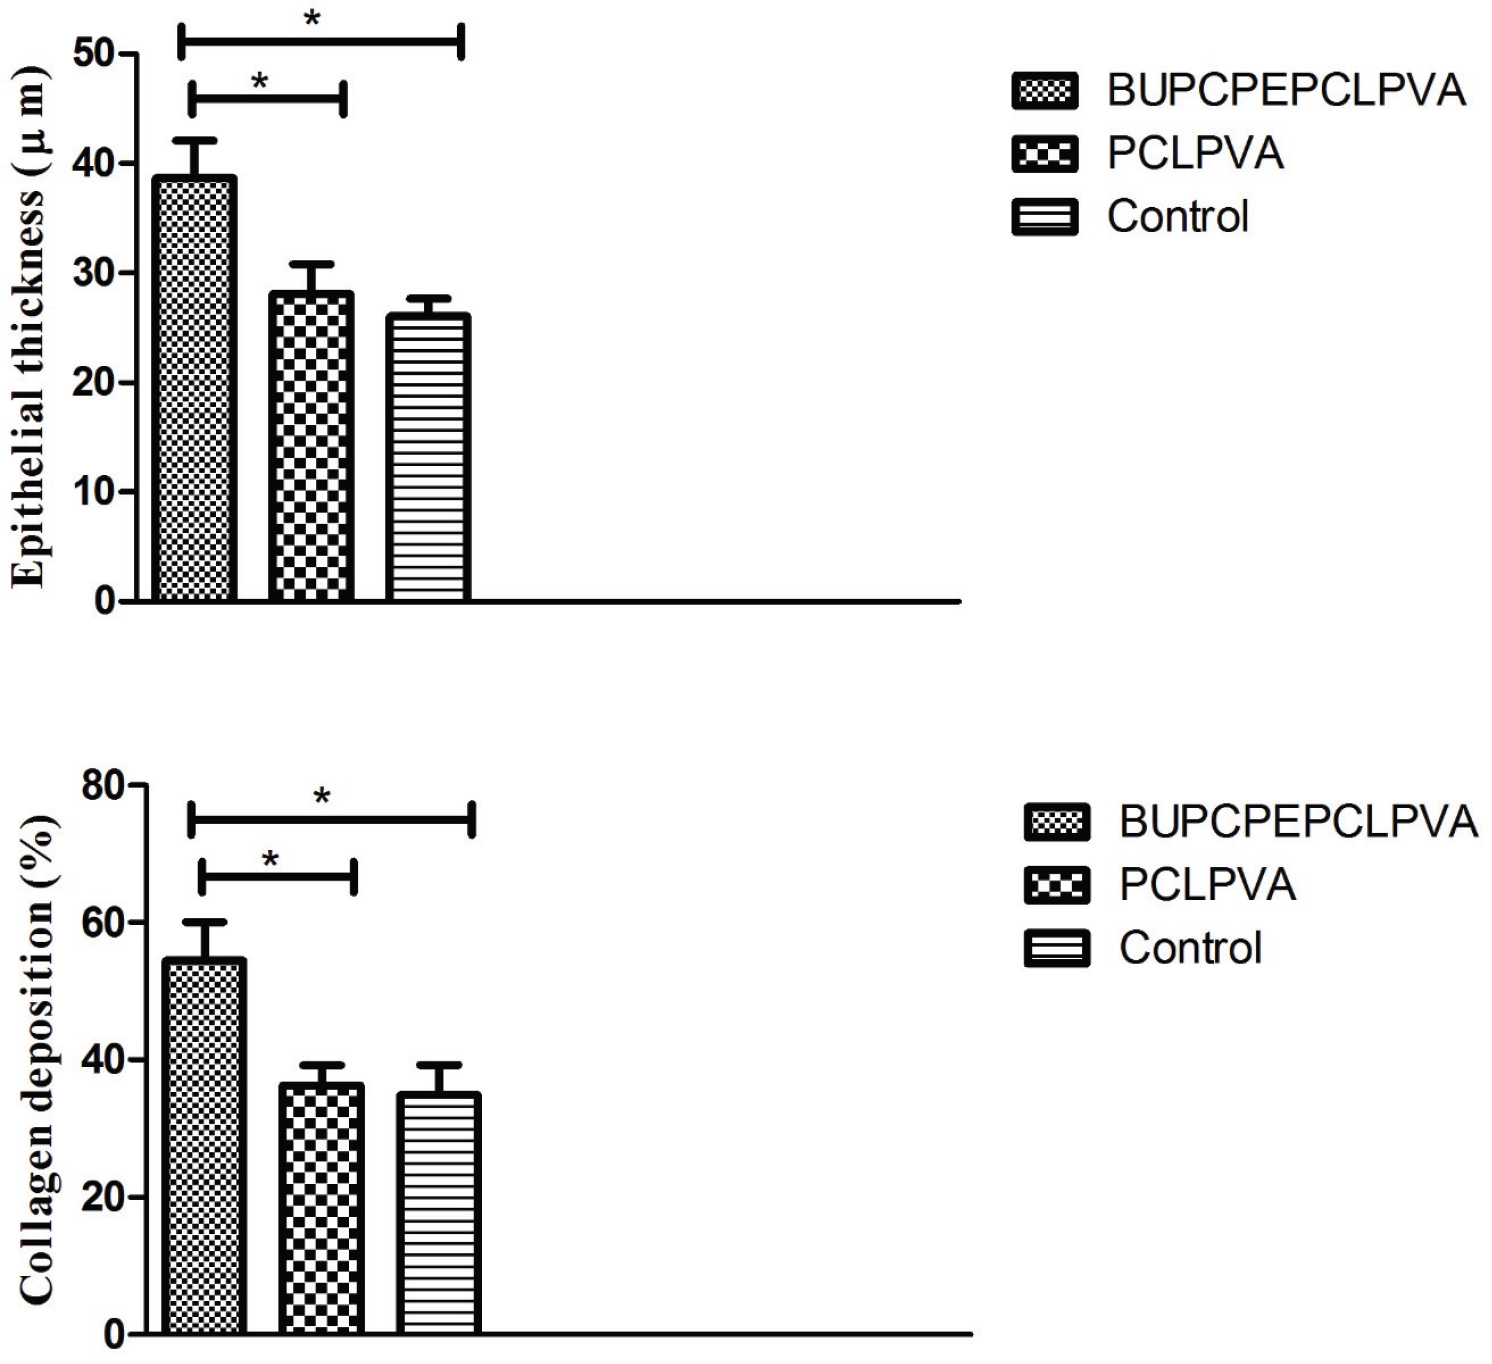
Fig. 11.
Histomorphometric studies acquired from histopathological staining images in wounds treated with different wound dressings, * shows p-value < 0.05
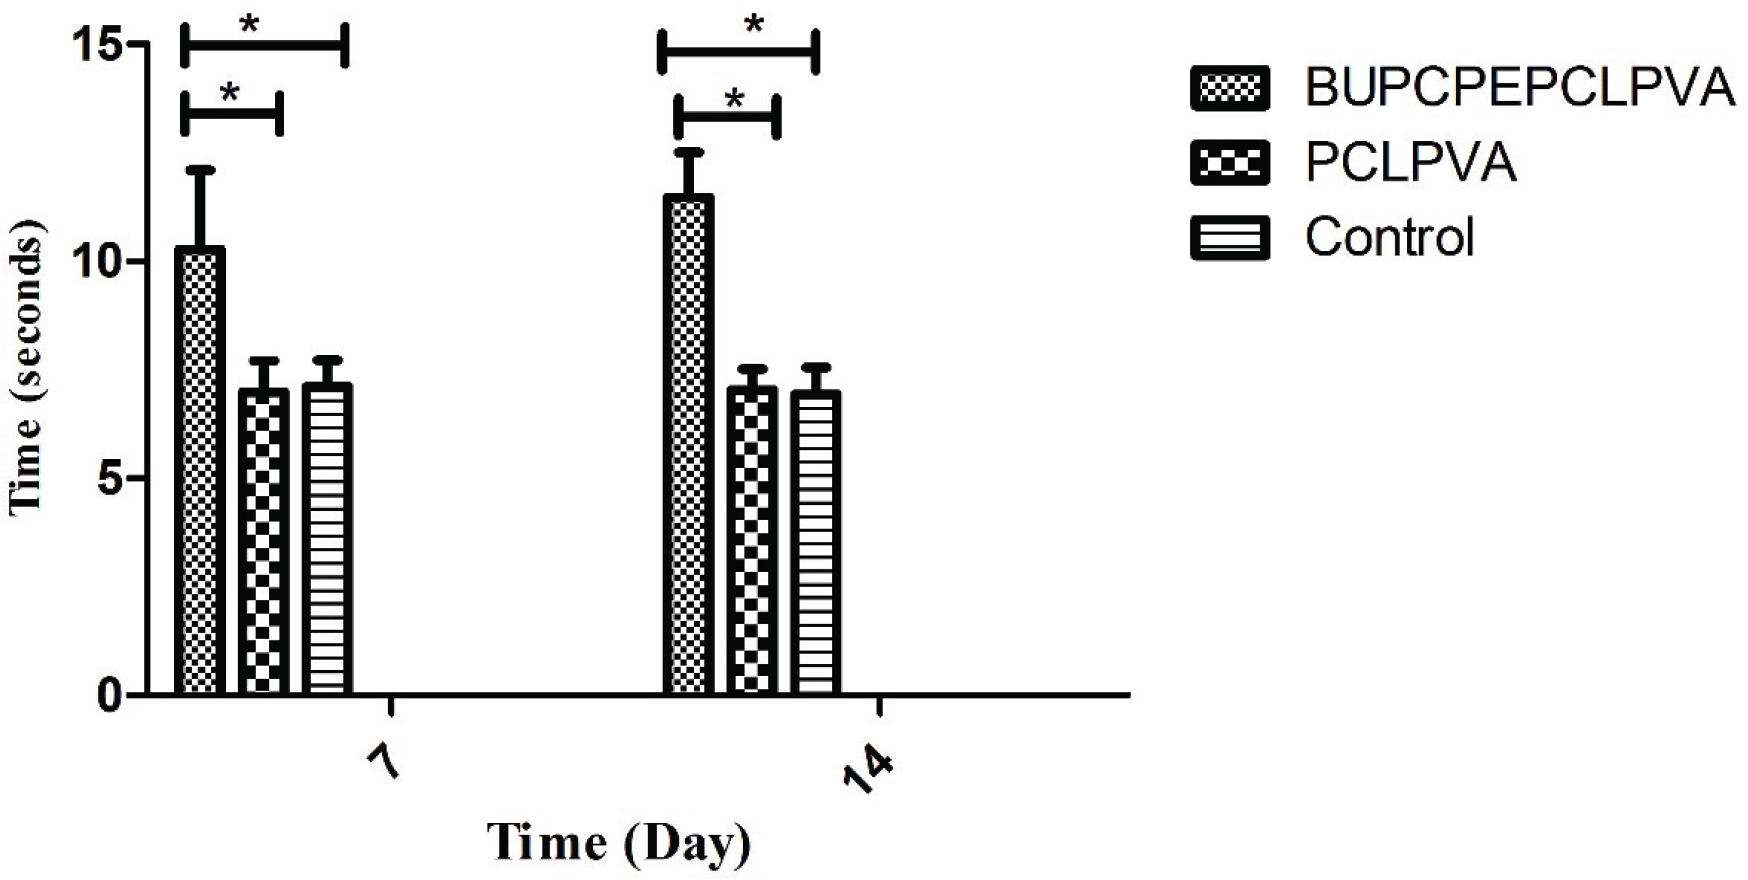
Fig. 12.
Latency time for painful stimuli in wounds treated with BUPCPEPCLPVA and PCLPVA wound dressings compared with non-treated wounds as the control, * shows p-value < 0.05
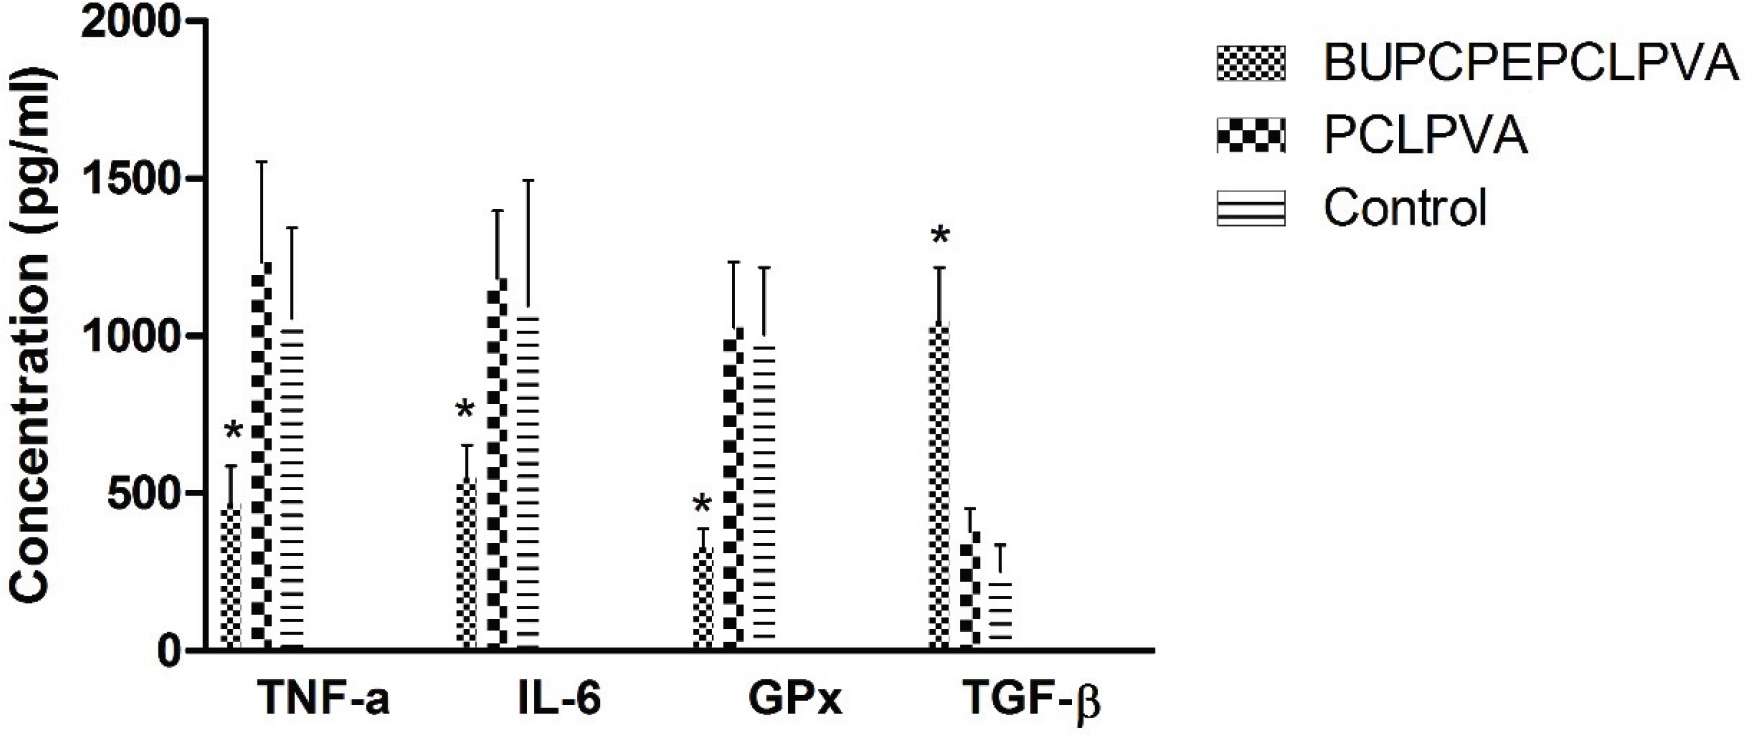
Fig. 13.
ELISA assay results in wound tissues treated with BUPCPEPCLPVA and PCLPVA wound dressings at the end of the 14th day post-wounding, respectively